This is the multi-page printable view of this section. Click here to print.
Queries & Syntax
- 1: GROUP BY
- 1.1: GROUP BY tricks
- 2: Adjustable table partitioning
- 3: DateTime64
- 4: DISTINCT & GROUP BY & LIMIT 1 BY what the difference
- 5: Imprecise parsing of literal Decimal or Float64
- 6: Multiple aligned date columns in PARTITION BY expression
- 7: Row policies overhead (hiding 'removed' tenants)
- 8: Why is simple `SELECT count()` Slow in ClickHouse®?
- 9: Collecting query execution flamegraphs using system.trace_log
- 10: Using array functions to mimic window-functions alike behavior
- 11: -State & -Merge combinators
- 12: ALTER MODIFY COLUMN is stuck, the column is inaccessible.
- 13: ANSI SQL mode
- 14: Async INSERTs
- 15: Atomic insert
- 16: ClickHouse® Projections
- 17: Cumulative Anything
- 18: Data types on disk and in RAM
- 19: DELETE via tombstone column
- 20: EXPLAIN query
- 21: Fill missing values at query time
- 22: FINAL clause speed
- 23: Join with Calendar using Arrays
- 24: JOINs
- 24.1: JOIN optimization tricks
- 25: JSONExtract to parse many attributes at a time
- 26: KILL QUERY
- 27: Lag / Lead
- 28: Machine learning in ClickHouse
- 29: Mutations
- 30: OPTIMIZE vs OPTIMIZE FINAL
- 31: Parameterized views
- 32: Use both projection and raw data in single query
- 33: PIVOT / UNPIVOT
- 34: Possible deadlock avoided. Client should retry
- 35: Roaring bitmaps for calculating retention
- 36: SAMPLE by
- 37: Sampling Example
- 38: Simple aggregate functions & combinators
- 39: Skip indexes
- 39.1: Example: minmax
- 39.2: Skip index bloom_filter Example
- 39.3: Skip indexes examples
- 40: Time zones
- 41: Time-series alignment with interpolation
- 42: Top N & Remain
- 43: Troubleshooting
- 44: TTL
- 44.1: MODIFY (ADD) TTL in ClickHouse®
- 44.2: What are my TTL settings?
- 44.3: TTL GROUP BY Examples
- 44.4: TTL Recompress example
- 45: UPDATE via Dictionary
- 46: Values mapping
- 47: Window functions
1 - GROUP BY
Internal implementation
ClickHouse® uses non-blocking? hash tables, so each thread has at least one hash table.
It makes easier to not care about sync between multiple threads, but has such disadvantages as:
- Bigger memory usage.
- Needs to merge those per-thread hash tables afterwards.
Because second step can be a bottleneck in case of a really big GROUP BY with a lot of distinct keys, another solution has been made.
Two-Level
https://youtu.be/SrucFOs8Y6c?t=2132
┌─name───────────────────────────────┬─value────┬─changed─┬─description────────────────────────────────────────────────────────────────────────────────────────────────────────────────────────────────────────────────────────────────────────────────────────────────┬─min──┬─max──┬─readonly─┬─type───┐
│ group_by_two_level_threshold       │ 100000   │       0 │ From what number of keys, a two-level aggregation starts. 0 - the threshold is not set.                                                                                                                    │ ᴺᵁᴸᴸ │ ᴺᵁᴸᴸ │        0 │ UInt64 │
│ group_by_two_level_threshold_bytes │ 50000000 │       0 │ From what size of the aggregation state in bytes, a two-level aggregation begins to be used. 0 - the threshold is not set. Two-level aggregation is used when at least one of the thresholds is triggered. │ ᴺᵁᴸᴸ │ ᴺᵁᴸᴸ │        0 │ UInt64 │
└────────────────────────────────────┴──────────┴─────────┴────────────────────────────────────────────────────────────────────────────────────────────────────────────────────────────────────────────────────────────────────────────────────────────────────────────┴──────┴──────┴──────────┴────────┘
In order to parallelize merging of hash tables, ie execute such merge via multiple threads, ClickHouse use two-level approach:
On the first step ClickHouse creates 256 buckets for each thread. (determined by one byte of hash function) On the second step ClickHouse can merge those 256 buckets independently by multiple threads.
GROUP BY in external memory
It utilizes a two-level group by and dumps those buckets on disk. And at the last stage ClickHouse will read those buckets from disk one by one and merge them. So you should have enough RAM to hold one bucket (1/256 of whole GROUP BY size).
optimize_aggregation_in_order GROUP BY
Usually it works slower than regular GROUP BY, because ClickHouse needs to read and process data in specific ORDER, which makes it much more complicated to parallelize reading and aggregating.
But it use much less memory, because ClickHouse can stream resultset and there is no need to keep it in memory.
Last item cache
ClickHouse saves value of previous hash calculation, just in case next value will be the same.
https://github.com/ClickHouse/ClickHouse/pull/5417 https://github.com/ClickHouse/ClickHouse/blob/808d9afd0f8110faba5ae027051bf0a64e506da3/src/Common/ColumnsHashingImpl.h#L40
StringHashMap
Actually uses 5 different hash tables
- For empty strings
- For strings < 8 bytes
- For strings < 16 bytes
- For strings < 24 bytes
- For strings > 24 bytes
SELECT count()
FROM
(
    SELECT materialize('1234567890123456') AS key           -- length(key) = 16
    FROM numbers(1000000000)
)
GROUP BY key

Aggregator: Aggregation method: key_string

Elapsed: 8.888 sec. Processed 1.00 billion rows, 8.00 GB (112.51 million rows/s., 900.11 MB/s.)

SELECT count()
FROM
(
    SELECT materialize('12345678901234567') AS key          -- length(key) = 17
    FROM numbers(1000000000)
)
GROUP BY key

Aggregator: Aggregation method: key_string

Elapsed: 9.089 sec. Processed 1.00 billion rows, 8.00 GB (110.03 million rows/s., 880.22 MB/s.)

SELECT count()
FROM
(
    SELECT materialize('123456789012345678901234') AS key   -- length(key) = 24
    FROM numbers(1000000000)
)
GROUP BY key

Aggregator: Aggregation method: key_string

Elapsed: 9.134 sec. Processed 1.00 billion rows, 8.00 GB (109.49 million rows/s., 875.94 MB/s.)

SELECT count()
FROM
(
    SELECT materialize('1234567890123456789012345') AS key  -- length(key) = 25
    FROM numbers(1000000000)
)
GROUP BY key

Aggregator: Aggregation method: key_string

Elapsed: 12.566 sec. Processed 1.00 billion rows, 8.00 GB (79.58 million rows/s., 636.67 MB/s.)
length
16 8.89 17 9.09 24 9.13 25 12.57
For what GROUP BY statement use memory
- Hash tables
It will grow with:
Amount of unique combinations of keys participated in GROUP BY
Size of keys participated in GROUP BY
- States of aggregation functions:
Be careful with function, which state can use unrestricted amount of memory and grow indefinitely:
- groupArray (groupArray(1000)())
- uniqExact (uniq,uniqCombined)
- quantileExact (medianExact) (quantile,quantileTDigest)
- windowFunnel
- groupBitmap
- sequenceCount (sequenceMatch)
- *Map
Why my GROUP BY eat all the RAM
run your query with
set send_logs_level='trace'Remove all aggregation functions from the query, try to understand how many memory simple GROUP BY will take.
One by one remove aggregation functions from query in order to understand which one is taking most of memory
1.1 - GROUP BY tricks
Tricks
Testing dataset
CREATE TABLE sessions
(
    `app` LowCardinality(String),
    `user_id` String,
    `created_at` DateTime,
    `platform` LowCardinality(String),
    `clicks` UInt32,
    `session_id` UUID
)
ENGINE = MergeTree
PARTITION BY toYYYYMM(created_at)
ORDER BY (app, user_id, session_id, created_at)

INSERT INTO sessions WITH
    CAST(number % 4, 'Enum8(\'Orange\' = 0, \'Melon\' = 1, \'Red\' = 2, \'Blue\' = 3)') AS app,
    concat('UID: ', leftPad(toString(number % 20000000), 8, '0')) AS user_id,
    toDateTime('2021-10-01 10:11:12') + (number / 300) AS created_at,
    CAST((number + 14) % 3, 'Enum8(\'Bat\' = 0, \'Mice\' = 1, \'Rat\' = 2)') AS platform,
    number % 17 AS clicks,
    generateUUIDv4() AS session_id
SELECT
    app,
    user_id,
    created_at,
    platform,
    clicks,
    session_id
FROM numbers_mt(1000000000)

0 rows in set. Elapsed: 46.078 sec. Processed 1.00 billion rows, 8.00 GB (21.70 million rows/s., 173.62 MB/s.)

┌─database─┬─table────┬─column─────┬─type───────────────────┬───────rows─┬─compressed_bytes─┬─compressed─┬─uncompressed─┬──────────────ratio─┬─codec─┐
│ default  │ sessions │ session_id │ UUID                   │ 1000000000 │      16065918103 │ 14.96 GiB  │ 14.90 GiB    │ 0.9958970223439835 │       │
│ default  │ sessions │ user_id    │ String                 │ 1000000000 │       3056977462 │ 2.85 GiB   │ 13.04 GiB    │   4.57968701896828 │       │
│ default  │ sessions │ clicks     │ UInt32                 │ 1000000000 │       1859359032 │ 1.73 GiB   │ 3.73 GiB     │  2.151278979023993 │       │
│ default  │ sessions │ created_at │ DateTime               │ 1000000000 │       1332089630 │ 1.24 GiB   │ 3.73 GiB     │ 3.0028009451586226 │       │
│ default  │ sessions │ platform   │ LowCardinality(String) │ 1000000000 │        329702248 │ 314.43 MiB │ 956.63 MiB   │  3.042446801879252 │       │
│ default  │ sessions │ app        │ LowCardinality(String) │ 1000000000 │          4825544 │ 4.60 MiB   │ 956.63 MiB   │ 207.87333386660654 │       │
└──────────┴──────────┴────────────┴────────────────────────┴────────────┴──────────────────┴────────────┴──────────────┴────────────────────┴───────┘
All queries and datasets are unique, so in different situations different hacks could work better or worse.
PreFilter values before GROUP BY
SELECT
    user_id,
    sum(clicks)
FROM sessions
WHERE created_at > '2021-11-01 00:00:00'
GROUP BY user_id
HAVING (argMax(clicks, created_at) = 16) AND (argMax(platform, created_at) = 'Rat')
FORMAT `Null`


<Debug> MemoryTracker: Peak memory usage (for query): 18.36 GiB.

SELECT
    user_id,
    sum(clicks)
FROM sessions
WHERE user_id IN (
    SELECT user_id
    FROM sessions
    WHERE (platform = 'Rat') AND (clicks = 16) AND (created_at > '2021-11-01 00:00:00') -- So we will select user_id which could potentially match our HAVING clause in OUTER query.
) AND (created_at > '2021-11-01 00:00:00')
GROUP BY user_id
HAVING (argMax(clicks, created_at) = 16) AND (argMax(platform, created_at) = 'Rat')
FORMAT `Null`

<Debug> MemoryTracker: Peak memory usage (for query): 4.43 GiB.
Use Fixed-width data types instead of String
For example, you have 2 strings which has values in special form like this
‘ABX 1412312312313’
You can just remove the first 4 characters and convert the rest to UInt64
toUInt64(substr(‘ABX 1412312312313’,5))
And you packed 17 bytes in 8, more than 2 times the improvement of size!
SELECT
    user_id,
    sum(clicks)
FROM sessions
GROUP BY
    user_id,
    platform
FORMAT `Null`

Aggregator: Aggregation method: serialized

<Debug> MemoryTracker: Peak memory usage (for query): 28.19 GiB.

Elapsed: 7.375 sec. Processed 1.00 billion rows, 27.00 GB (135.60 million rows/s., 3.66 GB/s.)

WITH
    CAST(user_id, 'FixedString(14)') AS user_fx,
    CAST(platform, 'FixedString(4)') AS platform_fx
SELECT
    user_fx,
    sum(clicks)
FROM sessions
GROUP BY
    user_fx,
    platform_fx
FORMAT `Null`

Aggregator: Aggregation method: keys256

MemoryTracker: Peak memory usage (for query): 22.24 GiB.

Elapsed: 6.637 sec. Processed 1.00 billion rows, 27.00 GB (150.67 million rows/s., 4.07 GB/s.)

WITH
    CAST(user_id, 'FixedString(14)') AS user_fx,
    CAST(platform, 'Enum8(\'Rat\' = 1, \'Mice\' = 2, \'Bat\' = 0)') AS platform_enum
SELECT
    user_fx,
    sum(clicks)
FROM sessions
GROUP BY
    user_fx,
    platform_enum
FORMAT `Null`

Aggregator: Aggregation method: keys128

MemoryTracker: Peak memory usage (for query): 14.14 GiB.

Elapsed: 5.335 sec. Processed 1.00 billion rows, 27.00 GB (187.43 million rows/s., 5.06 GB/s.)

WITH
    toUInt32OrZero(trim( LEADING '0' FROM substr(user_id,6))) AS user_int,
    CAST(platform, 'Enum8(\'Rat\' = 1, \'Mice\' = 2, \'Bat\' = 0)') AS platform_enum
SELECT
    user_int,
    sum(clicks)
FROM sessions
GROUP BY
    user_int,
    platform_enum
FORMAT `Null`

Aggregator: Aggregation method: keys64

MemoryTracker: Peak memory usage (for query): 10.14 GiB.

Elapsed: 8.549 sec. Processed 1.00 billion rows, 27.00 GB (116.97 million rows/s., 3.16 GB/s.)


WITH
    toUInt32('1' || substr(user_id,6)) AS user_int,
    CAST(platform, 'Enum8(\'Rat\' = 1, \'Mice\' = 2, \'Bat\' = 0)') AS platform_enum
SELECT
    user_int,
    sum(clicks)
FROM sessions
GROUP BY
    user_int,
    platform_enum
FORMAT `Null`

Aggregator: Aggregation method: keys64

Peak memory usage (for query): 10.14 GiB.

Elapsed: 6.247 sec. Processed 1.00 billion rows, 27.00 GB (160.09 million rows/s., 4.32 GB/s.)
It can be especially useful when you tries to do GROUP BY lc_column_1, lc_column_2 and ClickHouse® falls back to serialized algorithm.
Two LowCardinality Columns in GROUP BY
SELECT
    app,
    sum(clicks)
FROM sessions
GROUP BY app
FORMAT `Null`

Aggregator: Aggregation method: low_cardinality_key_string

MemoryTracker: Peak memory usage (for query): 43.81 MiB.

Elapsed: 0.545 sec. Processed 1.00 billion rows, 5.00 GB (1.83 billion rows/s., 9.17 GB/s.)

SELECT
    app,
    platform,
    sum(clicks)
FROM sessions
GROUP BY
    app,
    platform
FORMAT `Null`

Aggregator: Aggregation method: serialized -- Slowest method!

MemoryTracker: Peak memory usage (for query): 222.86 MiB.

Elapsed: 2.923 sec. Processed 1.00 billion rows, 6.00 GB (342.11 million rows/s., 2.05 GB/s.)

SELECT
    CAST(app, 'FixedString(6)') AS app_fx,
    CAST(platform, 'FixedString(4)') AS platform_fx,
    sum(clicks)
FROM sessions
GROUP BY
    app_fx,
    platform_fx
FORMAT `Null`

Aggregator: Aggregation method: keys128

MemoryTracker: Peak memory usage (for query): 160.23 MiB.

Elapsed: 1.632 sec. Processed 1.00 billion rows, 6.00 GB (612.63 million rows/s., 3.68 GB/s.)
Split your query in multiple smaller queries and execute them one BY one
SELECT
    user_id,
    sum(clicks)
FROM sessions
GROUP BY
    user_id,
    platform
FORMAT `Null`

MemoryTracker: Peak memory usage (for query): 28.19 GiB.

Elapsed: 7.375 sec. Processed 1.00 billion rows, 27.00 GB (135.60 million rows/s., 3.66 GB/s.)


SELECT
    user_id,
    sum(clicks)
FROM sessions
WHERE (cityHash64(user_id) % 4) = 0
GROUP BY
    user_id,
    platform
FORMAT `Null`

MemoryTracker: Peak memory usage (for query): 8.16 GiB.

Elapsed: 2.910 sec. Processed 1.00 billion rows, 27.00 GB (343.64 million rows/s., 9.28 GB/s.)
Shard your data by one of common high cardinal GROUP BY key
So on each shard you will have 1/N of all unique combination and this will result in smaller hash tables.
Let’s create 2 distributed tables with different distribution: rand() and by user_id
CREATE TABLE sessions_distributed AS sessions
ENGINE = Distributed('distr-groupby', default, sessions, rand());

INSERT INTO sessions_distributed WITH
    CAST(number % 4, 'Enum8(\'Orange\' = 0, \'Melon\' = 1, \'Red\' = 2, \'Blue\' = 3)') AS app,
    concat('UID: ', leftPad(toString(number % 20000000), 8, '0')) AS user_id,
    toDateTime('2021-10-01 10:11:12') + (number / 300) AS created_at,
    CAST((number + 14) % 3, 'Enum8(\'Bat\' = 0, \'Mice\' = 1, \'Rat\' = 2)') AS platform,
    number % 17 AS clicks,
    generateUUIDv4() AS session_id
SELECT
    app,
    user_id,
    created_at,
    platform,
    clicks,
    session_id
FROM numbers_mt(1000000000);

CREATE TABLE sessions_2 ON CLUSTER 'distr-groupby'
(
    `app` LowCardinality(String),
    `user_id` String,
    `created_at` DateTime,
    `platform` LowCardinality(String),
    `clicks` UInt32,
    `session_id` UUID
)
ENGINE = MergeTree
PARTITION BY toYYYYMM(created_at)
ORDER BY (app, user_id, session_id, created_at);

CREATE TABLE sessions_distributed_2 AS sessions
ENGINE = Distributed('distr-groupby', default, sessions_2, cityHash64(user_id));

INSERT INTO sessions_distributed_2 WITH
    CAST(number % 4, 'Enum8(\'Orange\' = 0, \'Melon\' = 1, \'Red\' = 2, \'Blue\' = 3)') AS app,
    concat('UID: ', leftPad(toString(number % 20000000), 8, '0')) AS user_id,
    toDateTime('2021-10-01 10:11:12') + (number / 300) AS created_at,
    CAST((number + 14) % 3, 'Enum8(\'Bat\' = 0, \'Mice\' = 1, \'Rat\' = 2)') AS platform,
    number % 17 AS clicks,
    generateUUIDv4() AS session_id
SELECT
    app,
    user_id,
    created_at,
    platform,
    clicks,
    session_id
FROM numbers_mt(1000000000);
SELECT
    app,
    platform,
    sum(clicks)
FROM
(
    SELECT
        argMax(app, created_at) AS app,
        argMax(platform, created_at) AS platform,
        user_id,
        argMax(clicks, created_at) AS clicks
    FROM sessions_distributed
    GROUP BY user_id
)
GROUP BY
    app,
    platform;

[chi-distr-groupby-distr-groupby-0-0-0] MemoryTracker: Current memory usage (for query): 12.02 GiB.
[chi-distr-groupby-distr-groupby-1-0-0] MemoryTracker: Current memory usage (for query): 12.05 GiB.
[chi-distr-groupby-distr-groupby-2-0-0] MemoryTracker: Current memory usage (for query): 12.05 GiB.

MemoryTracker: Peak memory usage (for query): 12.20 GiB.

12 rows in set. Elapsed: 28.345 sec. Processed 1.00 billion rows, 32.00 GB (35.28 million rows/s., 1.13 GB/s.)

SELECT
    app,
    platform,
    sum(clicks)
FROM
(
    SELECT
        argMax(app, created_at) AS app,
        argMax(platform, created_at) AS platform,
        user_id,
        argMax(clicks, created_at) AS clicks
    FROM sessions_distributed_2
    GROUP BY user_id
)
GROUP BY
    app,
    platform;

[chi-distr-groupby-distr-groupby-0-0-0] MemoryTracker: Current memory usage (for query): 5.05 GiB.
[chi-distr-groupby-distr-groupby-1-0-0] MemoryTracker: Current memory usage (for query): 5.05 GiB.
[chi-distr-groupby-distr-groupby-2-0-0] MemoryTracker: Current memory usage (for query): 5.05 GiB.

MemoryTracker: Peak memory usage (for query): 5.61 GiB.

12 rows in set. Elapsed: 11.952 sec. Processed 1.00 billion rows, 32.00 GB (83.66 million rows/s., 2.68 GB/s.)

SELECT
    app,
    platform,
    sum(clicks)
FROM
(
    SELECT
        argMax(app, created_at) AS app,
        argMax(platform, created_at) AS platform,
        user_id,
        argMax(clicks, created_at) AS clicks
    FROM sessions_distributed_2
    GROUP BY user_id
)
GROUP BY
    app,
    platform
SETTINGS optimize_distributed_group_by_sharding_key = 1

[chi-distr-groupby-distr-groupby-0-0-0] MemoryTracker: Current memory usage (for query): 5.05 GiB.
[chi-distr-groupby-distr-groupby-1-0-0] MemoryTracker: Current memory usage (for query): 5.05 GiB.
[chi-distr-groupby-distr-groupby-2-0-0] MemoryTracker: Current memory usage (for query): 5.05 GiB.
MemoryTracker: Peak memory usage (for query): 5.61 GiB.

12 rows in set. Elapsed: 11.916 sec. Processed 1.00 billion rows, 32.00 GB (83.92 million rows/s., 2.69 GB/s.)


SELECT
    app,
    platform,
    sum(clicks)
FROM cluster('distr-groupby', view(
    SELECT
        app,
        platform,
        sum(clicks) as clicks
    FROM
    (
        SELECT
            argMax(app, created_at) AS app,
            argMax(platform, created_at) AS platform,
            user_id,
            argMax(clicks, created_at) AS clicks
        FROM sessions_2
        GROUP BY user_id
    )
    GROUP BY
        app,
        platform
))
GROUP BY
    app,
    platform;

[chi-distr-groupby-distr-groupby-0-0-0] MemoryTracker: Current memory usage (for query): 5.05 GiB.
[chi-distr-groupby-distr-groupby-1-0-0] MemoryTracker: Current memory usage (for query): 5.05 GiB.
[chi-distr-groupby-distr-groupby-2-0-0] MemoryTracker: Current memory usage (for query): 5.05 GiB.

MemoryTracker: Peak memory usage (for query): 5.55 GiB.

12 rows in set. Elapsed: 9.491 sec. Processed 1.00 billion rows, 32.00 GB (105.36 million rows/s., 3.37 GB/s.)
Query with bigger state:
SELECT
    app,
    platform,
    sum(last_click) as sum,
    max(max_clicks) as max,
    min(min_clicks) as min,
    max(max_time) as max_time,
    min(min_time) as min_time
FROM
(
    SELECT
        argMax(app, created_at) AS app,
        argMax(platform, created_at) AS platform,
        user_id,
        argMax(clicks, created_at) AS last_click,
        max(clicks) AS max_clicks,
        min(clicks) AS min_clicks,
        max(created_at) AS max_time,
        min(created_at) AS min_time
    FROM sessions_distributed
    GROUP BY user_id
)
GROUP BY
    app,
    platform;

MemoryTracker: Peak memory usage (for query): 19.95 GiB.
12 rows in set. Elapsed: 34.339 sec. Processed 1.00 billion rows, 32.00 GB (29.12 million rows/s., 932.03 MB/s.)

SELECT
    app,
    platform,
    sum(last_click) as sum,
    max(max_clicks) as max,
    min(min_clicks) as min,
    max(max_time) as max_time,
    min(min_time) as min_time
FROM
(
    SELECT
        argMax(app, created_at) AS app,
        argMax(platform, created_at) AS platform,
        user_id,
        argMax(clicks, created_at) AS last_click,
        max(clicks) AS max_clicks,
        min(clicks) AS min_clicks,
        max(created_at) AS max_time,
        min(created_at) AS min_time
    FROM sessions_distributed_2
    GROUP BY user_id
)
GROUP BY
    app,
    platform;


MemoryTracker: Peak memory usage (for query): 10.09 GiB.

12 rows in set. Elapsed: 13.220 sec. Processed 1.00 billion rows, 32.00 GB (75.64 million rows/s., 2.42 GB/s.)

SELECT
    app,
    platform,
    sum(last_click) AS sum,
    max(max_clicks) AS max,
    min(min_clicks) AS min,
    max(max_time) AS max_time,
    min(min_time) AS min_time
FROM
(
    SELECT
        argMax(app, created_at) AS app,
        argMax(platform, created_at) AS platform,
        user_id,
        argMax(clicks, created_at) AS last_click,
        max(clicks) AS max_clicks,
        min(clicks) AS min_clicks,
        max(created_at) AS max_time,
        min(created_at) AS min_time
    FROM sessions_distributed_2
    GROUP BY user_id
)
GROUP BY
    app,
    platform
SETTINGS optimize_distributed_group_by_sharding_key = 1;

MemoryTracker: Peak memory usage (for query): 10.09 GiB.

12 rows in set. Elapsed: 13.361 sec. Processed 1.00 billion rows, 32.00 GB (74.85 million rows/s., 2.40 GB/s.)

SELECT
    app,
    platform,
    sum(last_click) AS sum,
    max(max_clicks) AS max,
    min(min_clicks) AS min,
    max(max_time) AS max_time,
    min(min_time) AS min_time
FROM
(
    SELECT
        argMax(app, created_at) AS app,
        argMax(platform, created_at) AS platform,
        user_id,
        argMax(clicks, created_at) AS last_click,
        max(clicks) AS max_clicks,
        min(clicks) AS min_clicks,
        max(created_at) AS max_time,
        min(created_at) AS min_time
    FROM sessions_distributed_2
    GROUP BY user_id
)
GROUP BY
    app,
    platform
SETTINGS distributed_group_by_no_merge=2;

MemoryTracker: Peak memory usage (for query): 10.02 GiB.

12 rows in set. Elapsed: 9.789 sec. Processed 1.00 billion rows, 32.00 GB (102.15 million rows/s., 3.27 GB/s.)

SELECT
    app,
    platform,
    sum(sum),
    max(max),
    min(min),
    max(max_time) AS max_time,
    min(min_time) AS min_time
FROM cluster('distr-groupby', view(
    SELECT
        app,
        platform,
        sum(last_click) AS sum,
        max(max_clicks) AS max,
        min(min_clicks) AS min,
        max(max_time) AS max_time,
        min(min_time) AS min_time
    FROM
    (
        SELECT
            argMax(app, created_at) AS app,
            argMax(platform, created_at) AS platform,
            user_id,
            argMax(clicks, created_at) AS last_click,
            max(clicks) AS max_clicks,
            min(clicks) AS min_clicks,
            max(created_at) AS max_time,
            min(created_at) AS min_time
        FROM sessions_2
        GROUP BY user_id
    )
    GROUP BY
        app,
        platform
))
GROUP BY
    app,
    platform;

MemoryTracker: Peak memory usage (for query): 10.09 GiB.

12 rows in set. Elapsed: 9.525 sec. Processed 1.00 billion rows, 32.00 GB (104.98 million rows/s., 3.36 GB/s.)
SELECT
    app,
    platform,
    sum(sessions)
FROM
(
    SELECT
        argMax(app, created_at) AS app,
        argMax(platform, created_at) AS platform,
        user_id,
        uniq(session_id) as sessions
    FROM sessions_distributed_2
    GROUP BY user_id
)
GROUP BY
    app,
    platform

MemoryTracker: Peak memory usage (for query): 14.57 GiB.
12 rows in set. Elapsed: 37.730 sec. Processed 1.00 billion rows, 44.01 GB (26.50 million rows/s., 1.17 GB/s.)


SELECT
    app,
    platform,
    sum(sessions)
FROM
(
    SELECT
        argMax(app, created_at) AS app,
        argMax(platform, created_at) AS platform,
        user_id,
        uniq(session_id) as sessions
    FROM sessions_distributed_2
    GROUP BY user_id
)
GROUP BY
    app,
    platform
SETTINGS optimize_distributed_group_by_sharding_key = 1;

MemoryTracker: Peak memory usage (for query): 14.56 GiB.

12 rows in set. Elapsed: 37.792 sec. Processed 1.00 billion rows, 44.01 GB (26.46 million rows/s., 1.16 GB/s.)

SELECT
    app,
    platform,
    sum(sessions)
FROM
(
    SELECT
        argMax(app, created_at) AS app,
        argMax(platform, created_at) AS platform,
        user_id,
        uniq(session_id) as sessions
    FROM sessions_distributed_2
    GROUP BY user_id
)
GROUP BY
    app,
    platform
SETTINGS distributed_group_by_no_merge = 2;

MemoryTracker: Peak memory usage (for query): 14.54 GiB.
12 rows in set. Elapsed: 17.762 sec. Processed 1.00 billion rows, 44.01 GB (56.30 million rows/s., 2.48 GB/s.)

SELECT
    app,
    platform,
    sum(sessions)
FROM cluster('distr-groupby', view(
SELECT
    app,
    platform,
    sum(sessions) as sessions
FROM
(
    SELECT
        argMax(app, created_at) AS app,
        argMax(platform, created_at) AS platform,
        user_id,
        uniq(session_id) as sessions
    FROM sessions_2
    GROUP BY user_id
)
GROUP BY
    app,
    platform))
GROUP BY
    app,
    platform

MemoryTracker: Peak memory usage (for query): 14.55 GiB.

12 rows in set. Elapsed: 17.574 sec. Processed 1.00 billion rows, 44.01 GB (56.90 million rows/s., 2.50 GB/s.)
Reduce number of threads
Because each thread uses an independent hash table, if you lower thread amount it will reduce number of hash tables as well and lower memory usage at the cost of slower query execution.
SELECT
    user_id,
    sum(clicks)
FROM sessions
GROUP BY
    user_id,
    platform
FORMAT `Null`


MemoryTracker: Peak memory usage (for query): 28.19 GiB.

Elapsed: 7.375 sec. Processed 1.00 billion rows, 27.00 GB (135.60 million rows/s., 3.66 GB/s.)

SET max_threads = 2;

SELECT
    user_id,
    sum(clicks)
FROM sessions
GROUP BY
    user_id,
    platform
FORMAT `Null`

MemoryTracker: Peak memory usage (for query): 13.26 GiB.

Elapsed: 62.014 sec. Processed 1.00 billion rows, 27.00 GB (16.13 million rows/s., 435.41 MB/s.)
UNION ALL
SELECT
    user_id,
    sum(clicks)
FROM sessions
GROUP BY
    app,
    user_id
FORMAT `Null`

MemoryTracker: Peak memory usage (for query): 24.19 GiB.

Elapsed: 5.043 sec. Processed 1.00 billion rows, 27.00 GB (198.29 million rows/s., 5.35 GB/s.)


SELECT
    user_id,
    sum(clicks)
FROM sessions WHERE app = 'Orange'
GROUP BY
    user_id
UNION ALL
SELECT
    user_id,
    sum(clicks)
FROM sessions WHERE app = 'Red'
GROUP BY
    user_id
UNION ALL
SELECT
    user_id,
    sum(clicks)
FROM sessions WHERE app = 'Melon'
GROUP BY
    user_id
UNION ALL
SELECT
    user_id,
    sum(clicks)
FROM sessions WHERE app = 'Blue'
GROUP BY
    user_id
FORMAT Null

MemoryTracker: Peak memory usage (for query): 7.99 GiB.

Elapsed: 2.852 sec. Processed 1.00 billion rows, 27.01 GB (350.74 million rows/s., 9.47 GB/s.)
aggregation_in_order
SELECT
    user_id,
    sum(clicks)
FROM sessions
WHERE app = 'Orange'
GROUP BY user_id
FORMAT `Null`

MemoryTracker: Peak memory usage (for query): 969.33 MiB.

Elapsed: 2.494 sec. Processed 250.09 million rows, 6.75 GB (100.27 million rows/s., 2.71 GB/s.)


SET optimize_aggregation_in_order = 1;

SELECT
    user_id,
    sum(clicks)
FROM sessions
WHERE app = 'Orange'
GROUP BY
    app,
    user_id
FORMAT `Null`

AggregatingInOrderTransform: Aggregating in order

MemoryTracker: Peak memory usage (for query): 169.24 MiB.

Elapsed: 4.925 sec. Processed 250.09 million rows, 6.75 GB (50.78 million rows/s., 1.37 GB/s.)
Reduce dimensions from GROUP BY with functions like sumMap, *Resample
One
SELECT
    user_id,
    toDate(created_at) AS day,
    sum(clicks)
FROM sessions
WHERE (created_at >= toDate('2021-10-01')) AND (created_at < toDate('2021-11-01')) AND (app IN ('Orange', 'Red', 'Blue'))
GROUP BY
    user_id,
    day
FORMAT `Null`

MemoryTracker: Peak memory usage (for query): 50.74 GiB.

Elapsed: 22.671 sec. Processed 594.39 million rows, 18.46 GB (26.22 million rows/s., 814.41 MB/s.)


SELECT
    user_id,
    (toDate('2021-10-01') + date_diff) - 1 AS day,
    clicks
FROM
(
    SELECT
        user_id,
        sumResample(0, 31, 1)(clicks, toDate(created_at) - toDate('2021-10-01')) AS clicks_arr
    FROM sessions
    WHERE (created_at >= toDate('2021-10-01')) AND (created_at < toDate('2021-11-01')) AND (app IN ('Orange', 'Red', 'Blue'))
    GROUP BY user_id
)
ARRAY JOIN
    clicks_arr AS clicks,
    arrayEnumerate(clicks_arr) AS date_diff
FORMAT `Null`

Peak memory usage (for query): 8.24 GiB.

Elapsed: 5.191 sec. Processed 594.39 million rows, 18.46 GB (114.50 million rows/s., 3.56 GB/s.)
Multiple
SELECT
    user_id,
    platform,
    toDate(created_at) AS day,
    sum(clicks)
FROM sessions
WHERE (created_at >= toDate('2021-10-01')) AND (created_at < toDate('2021-11-01')) AND (app IN ('Orange')) AND user_id ='UID: 08525196'
GROUP BY
    user_id,
    platform,
    day
ORDER BY user_id,
    day,
    platform
FORMAT `Null`

Peak memory usage (for query): 29.50 GiB.

Elapsed: 8.181 sec. Processed 198.14 million rows, 6.34 GB (24.22 million rows/s., 775.14 MB/s.)

WITH arrayJoin(arrayZip(clicks_arr_lvl_2, range(3))) AS clicks_res
SELECT
    user_id,
    CAST(clicks_res.2 + 1, 'Enum8(\'Rat\' = 1, \'Mice\' = 2, \'Bat\' = 3)') AS platform,
    (toDate('2021-10-01') + date_diff) - 1 AS day,
    clicks_res.1 AS clicks
FROM
(
    SELECT
        user_id,
        sumResampleResample(1, 4, 1, 0, 31, 1)(clicks, CAST(platform, 'Enum8(\'Rat\' = 1, \'Mice\' = 2, \'Bat\' = 3)'), toDate(created_at) - toDate('2021-10-01')) AS clicks_arr
    FROM sessions
    WHERE (created_at >= toDate('2021-10-01')) AND (created_at < toDate('2021-11-01')) AND (app IN ('Orange'))
    GROUP BY user_id
)
ARRAY JOIN
    clicks_arr AS clicks_arr_lvl_2,
    range(31) AS date_diff
FORMAT `Null`

Peak memory usage (for query): 9.92 GiB.

Elapsed: 4.170 sec. Processed 198.14 million rows, 6.34 GB (47.52 million rows/s., 1.52 GB/s.)


WITH arrayJoin(arrayZip(clicks_arr_lvl_2, range(3))) AS clicks_res
SELECT
    user_id,
    CAST(clicks_res.2 + 1, 'Enum8(\'Rat\' = 1, \'Mice\' = 2, \'Bat\' = 3)') AS platform,
    (toDate('2021-10-01') + date_diff) - 1 AS day,
    clicks_res.1 AS clicks
FROM
(
    SELECT
        user_id,
        sumResampleResample(1, 4, 1, 0, 31, 1)(clicks, CAST(platform, 'Enum8(\'Rat\' = 1, \'Mice\' = 2, \'Bat\' = 3)'), toDate(created_at) - toDate('2021-10-01')) AS clicks_arr
    FROM sessions
    WHERE (created_at >= toDate('2021-10-01')) AND (created_at < toDate('2021-11-01')) AND (app IN ('Orange'))
    GROUP BY user_id
)
ARRAY JOIN
    clicks_arr AS clicks_arr_lvl_2,
    range(31) AS date_diff
WHERE clicks > 0
FORMAT `Null`

Peak memory usage (for query): 10.14 GiB.

Elapsed: 9.533 sec. Processed 198.14 million rows, 6.34 GB (20.78 million rows/s., 665.20 MB/s.)

SELECT
    user_id,
    CAST(plat + 1, 'Enum8(\'Rat\' = 1, \'Mice\' = 2, \'Bat\' = 3)') AS platform,
    (toDate('2021-10-01') + date_diff) - 1 AS day,
    clicks
FROM
(
    WITH
        (SELECT flatten(arrayMap(x -> range(3) AS platforms, range(31) as days))) AS platform_arr,
        (SELECT flatten(arrayMap(x -> [x, x, x], range(31) as days))) AS days_arr
    SELECT
        user_id,
        flatten(sumResampleResample(1, 4, 1, 0, 31, 1)(clicks, CAST(platform, 'Enum8(\'Rat\' = 1, \'Mice\' = 2, \'Bat\' = 3)'), toDate(created_at) - toDate('2021-10-01'))) AS clicks_arr,
        platform_arr,
        days_arr
    FROM sessions
    WHERE (created_at >= toDate('2021-10-01')) AND (created_at < toDate('2021-11-01')) AND (app IN ('Orange'))
    GROUP BY user_id
)
ARRAY JOIN
    clicks_arr AS clicks,
    platform_arr AS plat,
    days_arr AS date_diff
FORMAT `Null`

Peak memory usage (for query): 9.95 GiB.

Elapsed: 3.095 sec. Processed 198.14 million rows, 6.34 GB (64.02 million rows/s., 2.05 GB/s.)

SELECT
    user_id,
    CAST(plat + 1, 'Enum8(\'Rat\' = 1, \'Mice\' = 2, \'Bat\' = 3)') AS platform,
    (toDate('2021-10-01') + date_diff) - 1 AS day,
    clicks
FROM
(
    WITH
        (SELECT flatten(arrayMap(x -> range(3) AS platforms, range(31) as days))) AS platform_arr,
        (SELECT flatten(arrayMap(x -> [x, x, x], range(31) as days))) AS days_arr
    SELECT
        user_id,
        sumResampleResample(1, 4, 1, 0, 31, 1)(clicks, CAST(platform, 'Enum8(\'Rat\' = 1, \'Mice\' = 2, \'Bat\' = 3)'), toDate(created_at) - toDate('2021-10-01')) AS clicks_arr,
        arrayFilter(x -> ((x.1) > 0), arrayZip(flatten(clicks_arr), platform_arr, days_arr)) AS result
    FROM sessions
    WHERE (created_at >= toDate('2021-10-01')) AND (created_at < toDate('2021-11-01')) AND (app IN ('Orange'))
    GROUP BY user_id
)
ARRAY JOIN
    result.1 AS clicks,
    result.2 AS plat,
    result.3 AS date_diff
FORMAT `Null`

Peak memory usage (for query): 9.93 GiB.

Elapsed: 4.717 sec. Processed 198.14 million rows, 6.34 GB (42.00 million rows/s., 1.34 GB/s.)

SELECT
    user_id,
    CAST(range % 3, 'Enum8(\'Rat\' = 0, \'Mice\' = 1, \'Bat\' = 2)') AS platform,
    toDate('2021-10-01') + intDiv(range, 3) AS day,
    clicks
FROM
(
    WITH (
            SELECT range(93)
        ) AS range_arr
    SELECT
        user_id,
        sumResample(0, 93, 1)(clicks, ((toDate(created_at) - toDate('2021-10-01')) * 3) + toUInt8(CAST(platform, 'Enum8(\'Rat\' = 0, \'Mice\' = 1, \'Bat\' = 2)'))) AS clicks_arr,
        range_arr
    FROM sessions
    WHERE (created_at >= toDate('2021-10-01')) AND (created_at < toDate('2021-11-01')) AND (app IN ('Orange'))
    GROUP BY user_id
)
ARRAY JOIN
    clicks_arr AS clicks,
    range_arr AS range
FORMAT `Null`

Peak memory usage (for query): 8.24 GiB.

Elapsed: 4.838 sec. Processed 198.14 million rows, 6.36 GB (40.95 million rows/s., 1.31 GB/s.)

SELECT
    user_id,
    sumResampleResample(1, 4, 1, 0, 31, 1)(clicks, CAST(platform, 'Enum8(\'Rat\' = 1, \'Mice\' = 2, \'Bat\' = 3)'), toDate(created_at) - toDate('2021-10-01')) AS clicks_arr
FROM sessions
WHERE (created_at >= toDate('2021-10-01')) AND (created_at < toDate('2021-11-01')) AND (app IN ('Orange'))
GROUP BY user_id
FORMAT `Null`

Peak memory usage (for query): 5.19 GiB.

0 rows in set. Elapsed: 1.160 sec. Processed 198.14 million rows, 6.34 GB (170.87 million rows/s., 5.47 GB/s.)
ARRAY JOIN can be expensive
https://kb.altinity.com/altinity-kb-functions/array-like-memory-usage/
sumMap, *Resample
https://kb.altinity.com/altinity-kb-functions/resample-vs-if-vs-map-vs-subquery/
Play with two-level
Disable:
SET group_by_two_level_threshold = 0, group_by_two_level_threshold_bytes = 0;
From 22.4 ClickHouse can predict, when it make sense to initialize aggregation with two-level from start, instead of rehashing on fly. It can improve query time. https://github.com/ClickHouse/ClickHouse/pull/33439
GROUP BY in external memory
Slow!
Use hash function for GROUP BY keys
GROUP BY cityHash64(‘xxxx’)
Can lead to incorrect results as hash functions is not 1 to 1 mapping.
Performance bugs
https://github.com/ClickHouse/ClickHouse/issues/15005
https://github.com/ClickHouse/ClickHouse/issues/29131
https://github.com/ClickHouse/ClickHouse/issues/31120
https://github.com/ClickHouse/ClickHouse/issues/35096 Fixed in 22.7
2 - Adjustable table partitioning
In that example, partitioning is being calculated via MATERIALIZED column expression toDate(toStartOfInterval(ts, toIntervalT(...))), but partition id also can be generated on application side and inserted to ClickHouse® as is.
CREATE TABLE tbl
(
    `ts` DateTime,
    `key` UInt32,
    `partition_key` Date MATERIALIZED toDate(toStartOfInterval(ts, toIntervalYear(1)))
)
ENGINE = MergeTree
PARTITION BY (partition_key, ignore(ts))
ORDER BY key;

SET send_logs_level = 'trace';

INSERT INTO tbl SELECT toDateTime(toDate('2020-01-01') + number) as ts, number as key FROM numbers(300);

Renaming temporary part tmp_insert_20200101-0_1_1_0 to 20200101-0_1_1_0

INSERT INTO tbl SELECT toDateTime(toDate('2021-01-01') + number) as ts, number as key FROM numbers(300);

Renaming temporary part tmp_insert_20210101-0_2_2_0 to 20210101-0_2_2_0

ALTER TABLE tbl
    MODIFY COLUMN `partition_key` Date MATERIALIZED toDate(toStartOfInterval(ts, toIntervalMonth(1)));

INSERT INTO tbl SELECT toDateTime(toDate('2022-01-01') + number) as ts, number as key FROM numbers(300);

Renaming temporary part tmp_insert_20220101-0_3_3_0 to 20220101-0_3_3_0
Renaming temporary part tmp_insert_20220201-0_4_4_0 to 20220201-0_4_4_0
Renaming temporary part tmp_insert_20220301-0_5_5_0 to 20220301-0_5_5_0
Renaming temporary part tmp_insert_20220401-0_6_6_0 to 20220401-0_6_6_0
Renaming temporary part tmp_insert_20220501-0_7_7_0 to 20220501-0_7_7_0
Renaming temporary part tmp_insert_20220601-0_8_8_0 to 20220601-0_8_8_0
Renaming temporary part tmp_insert_20220701-0_9_9_0 to 20220701-0_9_9_0
Renaming temporary part tmp_insert_20220801-0_10_10_0 to 20220801-0_10_10_0
Renaming temporary part tmp_insert_20220901-0_11_11_0 to 20220901-0_11_11_0
Renaming temporary part tmp_insert_20221001-0_12_12_0 to 20221001-0_12_12_0


ALTER TABLE tbl
    MODIFY COLUMN `partition_key` Date MATERIALIZED toDate(toStartOfInterval(ts, toIntervalDay(1)));

INSERT INTO tbl SELECT toDateTime(toDate('2023-01-01') + number) as ts, number as key FROM numbers(5);

Renaming temporary part tmp_insert_20230101-0_13_13_0 to 20230101-0_13_13_0
Renaming temporary part tmp_insert_20230102-0_14_14_0 to 20230102-0_14_14_0
Renaming temporary part tmp_insert_20230103-0_15_15_0 to 20230103-0_15_15_0
Renaming temporary part tmp_insert_20230104-0_16_16_0 to 20230104-0_16_16_0
Renaming temporary part tmp_insert_20230105-0_17_17_0 to 20230105-0_17_17_0


SELECT _partition_id, min(ts), max(ts), count() FROM tbl GROUP BY _partition_id ORDER BY _partition_id;

┌─_partition_id─┬─────────────min(ts)─┬─────────────max(ts)─┬─count()─┐
│ 20200101-0    │ 2020-01-01 00:00:00 │ 2020-10-26 00:00:00 │     300 │
│ 20210101-0    │ 2021-01-01 00:00:00 │ 2021-10-27 00:00:00 │     300 │
│ 20220101-0    │ 2022-01-01 00:00:00 │ 2022-01-31 00:00:00 │      31 │
│ 20220201-0    │ 2022-02-01 00:00:00 │ 2022-02-28 00:00:00 │      28 │
│ 20220301-0    │ 2022-03-01 00:00:00 │ 2022-03-31 00:00:00 │      31 │
│ 20220401-0    │ 2022-04-01 00:00:00 │ 2022-04-30 00:00:00 │      30 │
│ 20220501-0    │ 2022-05-01 00:00:00 │ 2022-05-31 00:00:00 │      31 │
│ 20220601-0    │ 2022-06-01 00:00:00 │ 2022-06-30 00:00:00 │      30 │
│ 20220701-0    │ 2022-07-01 00:00:00 │ 2022-07-31 00:00:00 │      31 │
│ 20220801-0    │ 2022-08-01 00:00:00 │ 2022-08-31 00:00:00 │      31 │
│ 20220901-0    │ 2022-09-01 00:00:00 │ 2022-09-30 00:00:00 │      30 │
│ 20221001-0    │ 2022-10-01 00:00:00 │ 2022-10-27 00:00:00 │      27 │
│ 20230101-0    │ 2023-01-01 00:00:00 │ 2023-01-01 00:00:00 │       1 │
│ 20230102-0    │ 2023-01-02 00:00:00 │ 2023-01-02 00:00:00 │       1 │
│ 20230103-0    │ 2023-01-03 00:00:00 │ 2023-01-03 00:00:00 │       1 │
│ 20230104-0    │ 2023-01-04 00:00:00 │ 2023-01-04 00:00:00 │       1 │
│ 20230105-0    │ 2023-01-05 00:00:00 │ 2023-01-05 00:00:00 │       1 │
└───────────────┴─────────────────────┴─────────────────────┴─────────┘


SELECT count() FROM tbl WHERE ts > '2023-01-04';

Key condition: unknown
MinMax index condition: (column 0 in [1672758001, +Inf))
Selected 1/17 parts by partition key, 1 parts by primary key, 1/1 marks by primary key, 1 marks to read from 1 ranges
Spreading mark ranges among streams (default reading)
Reading 1 ranges in order from part 20230105-0_17_17_0, approx. 1 rows starting from 0
3 - DateTime64
Subtract fractional seconds
WITH toDateTime64('2021-09-07 13:41:50.926', 3) AS time
SELECT
    time - 1,
    time - 0.1 AS no_affect,
    time - toDecimal64(0.1, 3) AS uncorrect_result,
    time - toIntervalMillisecond(100) AS correct_result -- from 22.4

Query id: 696722bd-3c22-4270-babe-c6b124fee97f

┌──────────minus(time, 1)─┬───────────────no_affect─┬────────uncorrect_result─┬──────────correct_result─┐
│ 2021-09-07 13:41:49.926 │ 2021-09-07 13:41:50.926 │ 1970-01-01 00:00:00.000 │ 2021-09-07 13:41:50.826 │
└─────────────────────────┴─────────────────────────┴─────────────────────────┴─────────────────────────┘


WITH
    toDateTime64('2021-03-03 09:30:00.100', 3) AS time,
    fromUnixTimestamp64Milli(toInt64(toUnixTimestamp64Milli(time) + (1.25 * 1000))) AS first,
    toDateTime64(toDecimal64(time, 3) + toDecimal64('1.25', 3), 3) AS second,
    reinterpret(reinterpret(time, 'Decimal64(3)') + toDecimal64('1.25', 3), 'DateTime64(3)') AS third,
    time + toIntervalMillisecond(1250) AS fourth, -- from 22.4
    addMilliseconds(time, 1250) AS fifth          -- from 22.4
SELECT
    first,
    second,
    third,
    fourth,
    fifth

Query id: 176cd2e7-68bf-4e26-a492-63e0b5a87cc5

┌───────────────────first─┬──────────────────second─┬───────────────────third─┬──────────────────fourth─┬───────────────────fifth─┐
│ 2021-03-03 09:30:01.350 │ 2021-03-03 09:30:01.350 │ 2021-03-03 09:30:01.350 │ 2021-03-03 09:30:01.350 │ 2021-03-03 09:30:01.350 │
└─────────────────────────┴─────────────────────────┴─────────────────────────┴─────────────────────────┴─────────────────────────┘

SET max_threads=1;

Starting from 22.4

WITH
    materialize(toDateTime64('2021-03-03 09:30:00.100', 3)) AS time,
    time + toIntervalMillisecond(1250) AS fourth
SELECT count()
FROM numbers(100000000)
WHERE NOT ignore(fourth)

1 rows in set. Elapsed: 0.215 sec. Processed 100.03 million rows, 800.21 MB (464.27 million rows/s., 3.71 GB/s.)

WITH
    materialize(toDateTime64('2021-03-03 09:30:00.100', 3)) AS time,
    addMilliseconds(time, 1250) AS fifth
SELECT count()
FROM numbers(100000000)
WHERE NOT ignore(fifth)

1 rows in set. Elapsed: 0.208 sec. Processed 100.03 million rows, 800.21 MB (481.04 million rows/s., 3.85 GB/s.)

###########

WITH
    materialize(toDateTime64('2021-03-03 09:30:00.100', 3)) AS time,
    fromUnixTimestamp64Milli(reinterpretAsInt64(toUnixTimestamp64Milli(time) + (1.25 * 1000))) AS first
SELECT count()
FROM numbers(100000000)
WHERE NOT ignore(first)

1 rows in set. Elapsed: 0.370 sec. Processed 100.03 million rows, 800.21 MB (270.31 million rows/s., 2.16 GB/s.)

WITH
    materialize(toDateTime64('2021-03-03 09:30:00.100', 3)) AS time,
    fromUnixTimestamp64Milli(toUnixTimestamp64Milli(time) + toInt16(1.25 * 1000)) AS first
SELECT count()
FROM numbers(100000000)
WHERE NOT ignore(first)

1 rows in set. Elapsed: 0.256 sec. Processed 100.03 million rows, 800.21 MB (391.06 million rows/s., 3.13 GB/s.)


WITH
    materialize(toDateTime64('2021-03-03 09:30:00.100', 3)) AS time,
    toDateTime64(toDecimal64(time, 3) + toDecimal64('1.25', 3), 3) AS second
SELECT count()
FROM numbers(100000000)
WHERE NOT ignore(second)

1 rows in set. Elapsed: 2.240 sec. Processed 100.03 million rows, 800.21 MB (44.65 million rows/s., 357.17 MB/s.)

SET decimal_check_overflow=0;

WITH
    materialize(toDateTime64('2021-03-03 09:30:00.100', 3)) AS time,
    toDateTime64(toDecimal64(time, 3) + toDecimal64('1.25', 3), 3) AS second
SELECT count()
FROM numbers(100000000)
WHERE NOT ignore(second)

1 rows in set. Elapsed: 1.991 sec. Processed 100.03 million rows, 800.21 MB (50.23 million rows/s., 401.81 MB/s.)


WITH
    materialize(toDateTime64('2021-03-03 09:30:00.100', 3)) AS time,
    reinterpret(reinterpret(time, 'Decimal64(3)') + toDecimal64('1.25', 3), 'DateTime64(3)') AS third
SELECT count()
FROM numbers(100000000)
WHERE NOT ignore(third)

1 rows in set. Elapsed: 0.515 sec. Processed 100.03 million rows, 800.21 MB (194.39 million rows/s., 1.56 GB/s.)

SET decimal_check_overflow=0;

WITH
    materialize(toDateTime64('2021-03-03 09:30:00.100', 3)) AS time,
    reinterpret(reinterpret(time, 'Decimal64(3)') + toDecimal64('1.25', 3), 'DateTime64(3)') AS third
SELECT count()
FROM numbers(100000000)
WHERE NOT ignore(third)

1 rows in set. Elapsed: 0.281 sec. Processed 100.03 million rows, 800.21 MB (356.21 million rows/s., 2.85 GB/s.)
4 - DISTINCT & GROUP BY & LIMIT 1 BY what the difference
DISTINCT
SELECT DISTINCT number
FROM numbers_mt(100000000)
FORMAT `Null`

MemoryTracker: Peak memory usage (for query): 4.00 GiB.

0 rows in set. Elapsed: 18.720 sec. Processed 100.03 million rows, 800.21 MB (5.34 million rows/s., 42.75 MB/s.)

SELECT DISTINCT number
FROM numbers_mt(100000000)
SETTINGS max_threads = 1
FORMAT `Null`

MemoryTracker: Peak memory usage (for query): 4.00 GiB.

0 rows in set. Elapsed: 18.349 sec. Processed 100.03 million rows, 800.21 MB (5.45 million rows/s., 43.61 MB/s.)

SELECT DISTINCT number
FROM numbers_mt(100000000)
LIMIT 1000
FORMAT `Null`

MemoryTracker: Peak memory usage (for query): 21.56 MiB.

0 rows in set. Elapsed: 0.014 sec. Processed 589.54 thousand rows, 4.72 MB (43.08 million rows/s., 344.61 MB/s.)


SELECT DISTINCT number % 1000
FROM numbers_mt(1000000000)
LIMIT 1000
FORMAT `Null`

MemoryTracker: Peak memory usage (for query): 1.80 MiB.

0 rows in set. Elapsed: 0.005 sec. Processed 589.54 thousand rows, 4.72 MB (127.23 million rows/s., 1.02 GB/s.)

SELECT DISTINCT number % 1000
FROM numbers(1000000000)
LIMIT 1001
FORMAT `Null`

MemoryTracker: Peak memory usage (for query): 847.05 KiB.

0 rows in set. Elapsed: 0.448 sec. Processed 1.00 billion rows, 8.00 GB (2.23 billion rows/s., 17.88 GB/s.)
- Final distinct step is single threaded
- Stream resultset
GROUP BY
SELECT number
FROM numbers_mt(100000000)
GROUP BY number
FORMAT `Null`

MemoryTracker: Peak memory usage (for query): 4.04 GiB.

0 rows in set. Elapsed: 8.212 sec. Processed 100.00 million rows, 800.00 MB (12.18 million rows/s., 97.42 MB/s.)

SELECT number
FROM numbers_mt(100000000)
GROUP BY number
SETTINGS max_threads = 1
FORMAT `Null`

MemoryTracker: Peak memory usage (for query): 6.00 GiB.

0 rows in set. Elapsed: 19.206 sec. Processed 100.03 million rows, 800.21 MB (5.21 million rows/s., 41.66 MB/s.)

SELECT number
FROM numbers_mt(100000000)
GROUP BY number
LIMIT 1000
FORMAT `Null`

MemoryTracker: Peak memory usage (for query): 4.05 GiB.

0 rows in set. Elapsed: 4.852 sec. Processed 100.00 million rows, 800.00 MB (20.61 million rows/s., 164.88 MB/s.)

This query faster than first, because ClickHouse® doesn't need to merge states for all keys, only for first 1000 (based on LIMIT)


SELECT number % 1000 AS key
FROM numbers_mt(1000000000)
GROUP BY key
LIMIT 1000
FORMAT `Null`

MemoryTracker: Peak memory usage (for query): 3.15 MiB.

0 rows in set. Elapsed: 0.770 sec. Processed 1.00 billion rows, 8.00 GB (1.30 billion rows/s., 10.40 GB/s.)

SELECT number % 1000 AS key
FROM numbers_mt(1000000000)
GROUP BY key
LIMIT 1001
FORMAT `Null`

MemoryTracker: Peak memory usage (for query): 3.77 MiB.

0 rows in set. Elapsed: 0.770 sec. Processed 1.00 billion rows, 8.00 GB (1.30 billion rows/s., 10.40 GB/s.)
- Multi threaded
- Will return result only after completion of aggregation
LIMIT BY
SELECT number
FROM numbers_mt(100000000)
LIMIT 1 BY number
FORMAT `Null`

MemoryTracker: Peak memory usage (for query): 6.00 GiB.

0 rows in set. Elapsed: 39.541 sec. Processed 100.00 million rows, 800.00 MB (2.53 million rows/s., 20.23 MB/s.)

SELECT number
FROM numbers_mt(100000000)
LIMIT 1 BY number
SETTINGS max_threads = 1
FORMAT `Null`

MemoryTracker: Peak memory usage (for query): 6.01 GiB.

0 rows in set. Elapsed: 36.773 sec. Processed 100.03 million rows, 800.21 MB (2.72 million rows/s., 21.76 MB/s.)

SELECT number
FROM numbers_mt(100000000)
LIMIT 1 BY number
LIMIT 1000
FORMAT `Null`

MemoryTracker: Peak memory usage (for query): 10.56 MiB.

0 rows in set. Elapsed: 0.019 sec. Processed 589.54 thousand rows, 4.72 MB (30.52 million rows/s., 244.20 MB/s.)


SELECT number % 1000 AS key
FROM numbers_mt(1000000000)
LIMIT 1 BY key
LIMIT 1000
FORMAT `Null`

MemoryTracker: Peak memory usage (for query): 5.14 MiB.

0 rows in set. Elapsed: 0.008 sec. Processed 589.54 thousand rows, 4.72 MB (71.27 million rows/s., 570.16 MB/s.)

SELECT number % 1000 AS key
FROM numbers_mt(1000000000)
LIMIT 1 BY key
LIMIT 1001
FORMAT `Null`

MemoryTracker: Peak memory usage (for query): 3.23 MiB.

0 rows in set. Elapsed: 36.027 sec. Processed 1.00 billion rows, 8.00 GB (27.76 million rows/s., 222.06 MB/s.)
- Single threaded
- Stream resultset
- Can return arbitrary amount of rows per each key
5 - Imprecise parsing of literal Decimal or Float64
Decimal
SELECT
    9.2::Decimal64(2) AS postgresql_cast,
    toDecimal64(9.2, 2) AS to_function,
    CAST(9.2, 'Decimal64(2)') AS cast_float_literal,
    CAST('9.2', 'Decimal64(2)') AS cast_string_literal

┌─postgresql_cast─┬─to_function─┬─cast_float_literal─┬─cast_string_literal─┐
│             9.2 │        9.19 │               9.19 │                 9.2 │
└─────────────────┴─────────────┴────────────────────┴─────────────────────┘
When we try to type cast 64.32 to Decimal128(2) the resulted value is 64.31.
When it sees a number with a decimal separator it interprets as Float64 literal (where 64.32 have no accurate representation, and actually you get something like 64.319999999999999999) and later that Float is casted to Decimal by removing the extra precision.
Workaround is very simple - wrap the number in quotes (and it will be considered as a string literal by query parser, and will be transformed to Decimal directly), or use postgres-alike casting syntax:
select cast(64.32,'Decimal128(2)') a, cast('64.32','Decimal128(2)') b, 64.32::Decimal128(2) c;

┌─────a─┬─────b─┬─────c─┐
│ 64.31 │ 64.32 │ 64.32 │
└───────┴───────┴───────┘
Float64
SELECT
    toFloat64(15008753.) AS to_func,
    toFloat64('1.5008753E7') AS to_func_scientific,
    CAST('1.5008753E7', 'Float64') AS cast_scientific

┌──to_func─┬─to_func_scientific─┬────cast_scientific─┐
│ 15008753 │ 15008753.000000002 │ 15008753.000000002 │
└──────────┴────────────────────┴────────────────────┘
6 - Multiple aligned date columns in PARTITION BY expression
Alternative to doing that by minmax skip index .
CREATE TABLE part_key_multiple_dates
(
    `key` UInt32,
    `date` Date,
    `time` DateTime,
    `created_at` DateTime,
    `inserted_at` DateTime
)
ENGINE = MergeTree
PARTITION BY (toYYYYMM(date), ignore(created_at, inserted_at))
ORDER BY (key, time);


INSERT INTO part_key_multiple_dates SELECT
    number,
    toDate(x),
    now() + intDiv(number, 10) AS x,
    x - (rand() % 100),
    x + (rand() % 100)
FROM numbers(100000000);

SELECT count()
FROM part_key_multiple_dates
WHERE date > (now() + toIntervalDay(105));

┌─count()─┐
│ 8434210 │
└─────────┘

1 rows in set. Elapsed: 0.022 sec. Processed 11.03 million rows, 22.05 MB (501.94 million rows/s., 1.00 GB/s.)

SELECT count()
FROM part_key_multiple_dates
WHERE inserted_at > (now() + toIntervalDay(105));

┌─count()─┐
│ 9279818 │
└─────────┘

1 rows in set. Elapsed: 0.046 sec. Processed 11.03 million rows, 44.10 MB (237.64 million rows/s., 950.57 MB/s.)

SELECT count()
FROM part_key_multiple_dates
WHERE created_at > (now() + toIntervalDay(105));

┌─count()─┐
│ 9279139 │
└─────────┘

1 rows in set. Elapsed: 0.043 sec. Processed 11.03 million rows, 44.10 MB (258.22 million rows/s., 1.03 GB/s.)
7 - Row policies overhead (hiding 'removed' tenants)
No row policy
CREATE TABLE test_delete
(
    tenant Int64,
    key Int64,
    ts DateTime,
    value_a String
)
ENGINE = MergeTree
PARTITION BY toYYYYMM(ts)
ORDER BY (tenant, key, ts);

INSERT INTO test_delete
SELECT
    number%5,
    number,
    toDateTime('2020-01-01')+number/10,
    concat('some_looong_string', toString(number)),
FROM numbers(1e8);

INSERT INTO test_delete  -- multiple small tenants
SELECT
    number%5000,
    number,
    toDateTime('2020-01-01')+number/10,
    concat('some_looong_string', toString(number)),
FROM numbers(1e8);
Q1) SELECT tenant, count() FROM test_delete GROUP BY tenant ORDER BY tenant LIMIT 6;
┌─tenant─┬──count()─┐
│      0 │ 20020000 │
│      1 │ 20020000 │
│      2 │ 20020000 │
│      3 │ 20020000 │
│      4 │ 20020000 │
│      5 │    20000 │
└────────┴──────────┘
6 rows in set. Elapsed: 0.285 sec. Processed 200.00 million rows, 1.60 GB (702.60 million rows/s., 5.62 GB/s.)

Q2) SELECT uniq(value_a) FROM test_delete where tenant = 4;
┌─uniq(value_a)─┐
│      20016427 │
└───────────────┘
1 row in set. Elapsed: 0.265 sec. Processed 20.23 million rows, 863.93 MB (76.33 million rows/s., 3.26 GB/s.)

Q3) SELECT max(ts) FROM test_delete where tenant = 4;
┌─────────────max(ts)─┐
│ 2020-04-25 17:46:39 │
└─────────────────────┘
1 row in set. Elapsed: 0.062 sec. Processed 20.23 million rows, 242.31 MB (324.83 million rows/s., 3.89 GB/s.)

Q4) SELECT max(ts) FROM test_delete where tenant = 4 and key = 444;
┌─────────────max(ts)─┐
│ 2020-01-01 00:00:44 │
└─────────────────────┘
1 row in set. Elapsed: 0.009 sec. Processed 212.99 thousand rows, 1.80 MB (24.39 million rows/s., 206.36 MB/s.)
row policy using expression
CREATE ROW POLICY pol1 ON test_delete USING tenant not in (1,2,3) TO all;

Q1) SELECT tenant, count() FROM test_delete GROUP BY tenant ORDER BY tenant LIMIT 6;
┌─tenant─┬──count()─┐
│      0 │ 20020000 │
│      4 │ 20020000 │
│      5 │    20000 │
│      6 │    20000 │
│      7 │    20000 │
│      8 │    20000 │
└────────┴──────────┘
6 rows in set. Elapsed: 0.333 sec. Processed 140.08 million rows, 1.12 GB (420.59 million rows/s., 3.36 GB/s.)

Q2) SELECT uniq(value_a) FROM test_delete where tenant = 4;
┌─uniq(value_a)─┐
│      20016427 │
└───────────────┘
1 row in set. Elapsed: 0.287 sec. Processed 20.23 million rows, 863.93 MB (70.48 million rows/s., 3.01 GB/s.)

Q3) SELECT max(ts) FROM test_delete where tenant = 4;
┌─────────────max(ts)─┐
│ 2020-04-25 17:46:39 │
└─────────────────────┘
1 row in set. Elapsed: 0.080 sec. Processed 20.23 million rows, 242.31 MB (254.20 million rows/s., 3.05 GB/s.)

Q4) SELECT max(ts) FROM test_delete where tenant = 4 and key = 444;
┌─────────────max(ts)─┐
│ 2020-01-01 00:00:44 │
└─────────────────────┘
1 row in set. Elapsed: 0.011 sec. Processed 212.99 thousand rows, 3.44 MB (19.53 million rows/s., 315.46 MB/s.)

Q5) SELECT uniq(value_a) FROM test_delete where tenant = 1;
┌─uniq(value_a)─┐
│             0 │
└───────────────┘
1 row in set. Elapsed: 0.008 sec. Processed 180.22 thousand rows, 1.44 MB (23.69 million rows/s., 189.54 MB/s.)

DROP ROW POLICY pol1 ON test_delete;
row policy using table subquery
create table deleted_tenants(tenant Int64) ENGINE=MergeTree order by tenant;

CREATE ROW POLICY pol1 ON test_delete USING tenant not in deleted_tenants TO all;

SELECT tenant, count() FROM test_delete GROUP BY tenant ORDER BY tenant LIMIT 6;
┌─tenant─┬──count()─┐
│      0 │ 20020000 │
│      1 │ 20020000 │
│      2 │ 20020000 │
│      3 │ 20020000 │
│      4 │ 20020000 │
│      5 │    20000 │
└────────┴──────────┘
6 rows in set. Elapsed: 0.455 sec. Processed 200.00 million rows, 1.60 GB (439.11 million rows/s., 3.51 GB/s.)

insert into deleted_tenants values(1),(2),(3);

Q1) SELECT tenant, count() FROM test_delete GROUP BY tenant ORDER BY tenant LIMIT 6;
┌─tenant─┬──count()─┐
│      0 │ 20020000 │
│      4 │ 20020000 │
│      5 │    20000 │
│      6 │    20000 │
│      7 │    20000 │
│      8 │    20000 │
└────────┴──────────┘
6 rows in set. Elapsed: 0.329 sec. Processed 140.08 million rows, 1.12 GB (426.34 million rows/s., 3.41 GB/s.)

Q2) SELECT uniq(value_a) FROM test_delete where tenant = 4;
┌─uniq(value_a)─┐
│      20016427 │
└───────────────┘
1 row in set. Elapsed: 0.287 sec. Processed 20.23 million rows, 863.93 MB (70.56 million rows/s., 3.01 GB/s.)

Q3) SELECT max(ts) FROM test_delete where tenant = 4;
┌─────────────max(ts)─┐
│ 2020-04-25 17:46:39 │
└─────────────────────┘
1 row in set. Elapsed: 0.080 sec. Processed 20.23 million rows, 242.31 MB (251.39 million rows/s., 3.01 GB/s.)

Q4) SELECT max(ts) FROM test_delete where tenant = 4 and key = 444;
┌─────────────max(ts)─┐
│ 2020-01-01 00:00:44 │
└─────────────────────┘
1 row in set. Elapsed: 0.010 sec. Processed 213.00 thousand rows, 3.44 MB (20.33 million rows/s., 328.44 MB/s.)

Q5) SELECT uniq(value_a) FROM test_delete where tenant = 1;
┌─uniq(value_a)─┐
│             0 │
└───────────────┘
1 row in set. Elapsed: 0.008 sec. Processed 180.23 thousand rows, 1.44 MB (22.11 million rows/s., 176.90 MB/s.)

DROP ROW POLICY pol1 ON test_delete;
DROP TABLE deleted_tenants;
row policy using external dictionary (NOT dictHas)
create table deleted_tenants(tenant Int64, deleted UInt8 default 1) ENGINE=MergeTree order by tenant;

insert into deleted_tenants(tenant) values(1),(2),(3);

CREATE DICTIONARY deleted_tenants_dict (tenant UInt64, deleted UInt8)
PRIMARY KEY tenant SOURCE(CLICKHOUSE(TABLE deleted_tenants))
LIFETIME(600) LAYOUT(FLAT());

CREATE ROW POLICY pol1 ON test_delete USING NOT dictHas('deleted_tenants_dict', tenant) TO all;

Q1) SELECT tenant, count() FROM test_delete GROUP BY tenant ORDER BY tenant LIMIT 6;
┌─tenant─┬──count()─┐
│      0 │ 20020000 │
│      4 │ 20020000 │
│      5 │    20000 │
│      6 │    20000 │
│      7 │    20000 │
│      8 │    20000 │
└────────┴──────────┘
6 rows in set. Elapsed: 0.388 sec. Processed 200.00 million rows, 1.60 GB (515.79 million rows/s., 4.13 GB/s.)

Q2) SELECT uniq(value_a) FROM test_delete where tenant = 4;
┌─uniq(value_a)─┐
│      20016427 │
└───────────────┘
1 row in set. Elapsed: 0.291 sec. Processed 20.23 million rows, 863.93 MB (69.47 million rows/s., 2.97 GB/s.)

Q3) SELECT max(ts) FROM test_delete where tenant = 4;
┌─────────────max(ts)─┐
│ 2020-04-25 17:46:39 │
└─────────────────────┘
1 row in set. Elapsed: 0.084 sec. Processed 20.23 million rows, 242.31 MB (240.07 million rows/s., 2.88 GB/s.)

Q4) SELECT max(ts) FROM test_delete where tenant = 4 and key = 444;
┌─────────────max(ts)─┐
│ 2020-01-01 00:00:44 │
└─────────────────────┘
1 row in set. Elapsed: 0.010 sec. Processed 212.99 thousand rows, 3.44 MB (21.45 million rows/s., 346.56 MB/s.)

Q5) SELECT uniq(value_a) FROM test_delete where tenant = 1;
┌─uniq(value_a)─┐
│             0 │
└───────────────┘
1 row in set. Elapsed: 0.046 sec. Processed 20.22 million rows, 161.74 MB (440.26 million rows/s., 3.52 GB/s.)

DROP ROW POLICY pol1 ON test_delete;
DROP DICTIONARY deleted_tenants_dict;
DROP TABLE deleted_tenants;
row policy using external dictionary (dictHas)
create table deleted_tenants(tenant Int64, deleted UInt8 default 1) ENGINE=MergeTree order by tenant;

insert into deleted_tenants(tenant) select distinct tenant from test_delete where tenant not in (1,2,3);

CREATE DICTIONARY deleted_tenants_dict (tenant UInt64, deleted UInt8)
PRIMARY KEY tenant SOURCE(CLICKHOUSE(TABLE deleted_tenants))
LIFETIME(600) LAYOUT(FLAT());

CREATE ROW POLICY pol1 ON test_delete USING dictHas('deleted_tenants_dict', tenant) TO all;

Q1) SELECT tenant, count() FROM test_delete GROUP BY tenant ORDER BY tenant LIMIT 6;
┌─tenant─┬──count()─┐
│      0 │ 20020000 │
│      4 │ 20020000 │
│      5 │    20000 │
│      6 │    20000 │
│      7 │    20000 │
│      8 │    20000 │
└────────┴──────────┘
6 rows in set. Elapsed: 0.399 sec. Processed 200.00 million rows, 1.60 GB (501.18 million rows/s., 4.01 GB/s.)

Q2) SELECT uniq(value_a) FROM test_delete where tenant = 4;
┌─uniq(value_a)─┐
│      20016427 │
└───────────────┘
1 row in set. Elapsed: 0.284 sec. Processed 20.23 million rows, 863.93 MB (71.30 million rows/s., 3.05 GB/s.)

Q3) SELECT max(ts) FROM test_delete where tenant = 4;
┌─────────────max(ts)─┐
│ 2020-04-25 17:46:39 │
└─────────────────────┘
1 row in set. Elapsed: 0.080 sec. Processed 20.23 million rows, 242.31 MB (251.88 million rows/s., 3.02 GB/s.)

Q4) SELECT max(ts) FROM test_delete where tenant = 4 and key = 444;
┌─────────────max(ts)─┐
│ 2020-01-01 00:00:44 │
└─────────────────────┘
1 row in set. Elapsed: 0.010 sec. Processed 212.99 thousand rows, 3.44 MB (22.01 million rows/s., 355.50 MB/s.)

Q5) SELECT uniq(value_a) FROM test_delete where tenant = 1;
┌─uniq(value_a)─┐
│             0 │
└───────────────┘
1 row in set. Elapsed: 0.034 sec. Processed 20.22 million rows, 161.74 MB (589.90 million rows/s., 4.72 GB/s.)

DROP ROW POLICY pol1 ON test_delete;
DROP DICTIONARY deleted_tenants_dict;
DROP TABLE deleted_tenants;
row policy using engine=Set
create table deleted_tenants(tenant Int64) ENGINE=Set;

insert into deleted_tenants(tenant) values(1),(2),(3);

CREATE ROW POLICY pol1 ON test_delete USING tenant not in deleted_tenants TO all;

Q1) SELECT tenant, count() FROM test_delete GROUP BY tenant ORDER BY tenant LIMIT 6;
┌─tenant─┬──count()─┐
│      0 │ 20020000 │
│      4 │ 20020000 │
│      5 │    20000 │
│      6 │    20000 │
│      7 │    20000 │
│      8 │    20000 │
└────────┴──────────┘
6 rows in set. Elapsed: 0.322 sec. Processed 200.00 million rows, 1.60 GB (621.38 million rows/s., 4.97 GB/s.)

Q2) SELECT uniq(value_a) FROM test_delete where tenant = 4;
┌─uniq(value_a)─┐
│      20016427 │
└───────────────┘
1 row in set. Elapsed: 0.275 sec. Processed 20.23 million rows, 863.93 MB (73.56 million rows/s., 3.14 GB/s.)

Q3) SELECT max(ts) FROM test_delete where tenant = 4;
┌─────────────max(ts)─┐
│ 2020-04-25 17:46:39 │
└─────────────────────┘
1 row in set. Elapsed: 0.084 sec. Processed 20.23 million rows, 242.31 MB (240.07 million rows/s., 2.88 GB/s.)

Q4) SELECT max(ts) FROM test_delete where tenant = 4 and key = 444;
┌─────────────max(ts)─┐
│ 2020-01-01 00:00:44 │
└─────────────────────┘
1 row in set. Elapsed: 0.010 sec. Processed 212.99 thousand rows, 3.44 MB (20.69 million rows/s., 334.18 MB/s.)

Q5) SELECT uniq(value_a) FROM test_delete where tenant = 1;
┌─uniq(value_a)─┐
│             0 │
└───────────────┘
1 row in set. Elapsed: 0.030 sec. Processed 20.22 million rows, 161.74 MB (667.06 million rows/s., 5.34 GB/s.)

DROP ROW POLICY pol1 ON test_delete;
DROP TABLE deleted_tenants;
results
expression: CREATE ROW POLICY pol1 ON test_delete USING tenant not in (1,2,3) TO all;
table subq: CREATE ROW POLICY pol1 ON test_delete USING tenant not in deleted_tenants TO all;
ext. dict. NOT dictHas : CREATE ROW POLICY pol1 ON test_delete USING NOT dictHas('deleted_tenants_dict', tenant) TO all;
ext. dict. dictHas :
| Q | no policy | expression | table subq | ext. dict. NOT | ext. dict. | engine=Set |
|---|---|---|---|---|---|---|
| Q1 | 0.285 / 200.00m | 0.333 / 140.08m | 0.329 / 140.08m | 0.388 / 200.00m | 0.399 / 200.00m | 0.322 / 200.00m |
| Q2 | 0.265 / 20.23m | 0.287 / 20.23m | 0.287 / 20.23m | 0.291 / 20.23m | 0.284 / 20.23m | 0.275 / 20.23m |
| Q3 | 0.062 / 20.23m | 0.080 / 20.23m | 0.080 / 20.23m | 0.084 / 20.23m | 0.080 / 20.23m | 0.084 / 20.23m |
| Q4 | 0.009 / 212.99t | 0.011 / 212.99t | 0.010 / 213.00t | 0.010 / 212.99t | 0.010 / 212.99t | 0.010 / 212.99t |
| Q5 | 0.008 / 180.22t | 0.008 / 180.23t | 0.046 / 20.22m | 0.034 / 20.22m | 0.030 / 20.22m |
Expression in row policy seems to be fastest way (Q1, Q5).
8 - Why is simple `SELECT count()` Slow in ClickHouse®?
ClickHouse is a columnar database that provides excellent performance for analytical queries. However, in some cases, a simple count query can be slow. In this article, we’ll explore the reasons why this can happen and how to optimize the query.
Three Strategies for Counting Rows in ClickHouse
There are three ways to count rows in a table in ClickHouse:
optimize_trivial_count_query: This strategy extracts the number of rows from the table metadata. It’s the fastest and most efficient way to count rows, but it only works for simple count queries.allow_experimental_projection_optimization: This strategy uses a virtual projection called _minmax_count_projection to count rows. It’s faster than scanning the table but slower than the trivial count query.Scanning the smallest column in the table and reading rows from that. This is the slowest strategy and is only used when the other two strategies can’t be used.
Why Does ClickHouse Sometimes Choose the Slowest Counting Strategy?
In some cases, ClickHouse may choose the slowest counting strategy even when there are faster options available. Here are some possible reasons why this can happen:
Row policies are used on the table: If row policies are used, ClickHouse needs to filter rows to give the proper count. You can check if row policies are used by selecting from system.row_policies.
Experimental light-weight delete feature was used on the table: If the experimental light-weight delete feature was used, ClickHouse may use the slowest counting strategy. You can check this by looking into parts_columns for the column named _row_exists. To do this, run the following query:
SELECT DISTINCT database, table FROM system.parts_columns WHERE column = '_row_exists';
You can also refer to this issue on GitHub for more information: https://github.com/ClickHouse/ClickHouse/issues/47930 .
SELECT FINALorfinal=1setting is used.max_parallel_replicas > 1is used.Sampling is used.
Some other features like
allow_experimental_query_deduplicationorempty_result_for_aggregation_by_empty_setis used.
9 - Collecting query execution flamegraphs using system.trace_log
ClickHouse® has embedded functionality to analyze the details of query performance.
It’s system.trace_log table.
By default it collects information only about queries when runs longer than 1 sec (and collects stacktraces every second).
You can adjust that per query using settings query_profiler_real_time_period_ns & query_profiler_cpu_time_period_ns.
Both works very similar (with desired interval dump the stacktraces of all the threads which execute the query). real timer - allows to ‘see’ the situations when cpu was not working much, but time was spend for example on IO. cpu timer - allows to see the ‘hot’ points in calculations more accurately (skip the io time).
Trying to collect stacktraces with a frequency higher than few KHz is usually not possible.
To check where most of the RAM is used you can collect stacktraces during memory allocations / deallocation, by using the
setting memory_profiler_sample_probability.
clickhouse-speedscope
# install
wget https://github.com/laplab/clickhouse-speedscope/archive/refs/heads/master.tar.gz -O clickhouse-speedscope.tar.gz
tar -xvzf clickhouse-speedscope.tar.gz
cd clickhouse-speedscope-master/
pip3 install -r requirements.txt
For debugging particular query:
clickhouse-client

SET query_profiler_cpu_time_period_ns=1000000; -- 1000 times per 'cpu' sec
-- or SET query_profiler_real_time_period_ns=2000000; -- 500 times per 'real' sec.
-- or SET memory_profiler_sample_probability=0.1; -- to debug the memory allocations

SELECT ... <your select>

SYSTEM FLUSH LOGS;

-- get the query_id from the clickhouse-client output or from system.query_log (also pay attention on query_id vs initial_query_id for distributed queries).
Now let’s process that:
python3 main.py &  # start the proxy in background
python3 main.py --query-id 908952ee-71a8-48a4-84d5-f4db92d45a5d # process the stacktraces
fg # get the proxy from background
Ctrl + C  # stop it.
To access ClickHouse with other username / password etc. - see the sources of https://github.com/laplab/clickhouse-speedscope/blob/master/main.py
clickhouse-flamegraph
Installation & usage instructions: https://github.com/Slach/clickhouse-flamegraph
pure flamegraph.pl examples
git clone https://github.com/brendangregg/FlameGraph /opt/flamegraph

clickhouse-client -q "SELECT  arrayStringConcat(arrayReverse(arrayMap(x -> concat( addressToLine(x), '#', demangle(addressToSymbol(x)) ), trace)), ';') AS stack, count() AS samples FROM system.trace_log WHERE event_time >= subtractMinutes(now(),10) GROUP BY trace FORMAT TabSeparated" | /opt/flamegraph/flamegraph.pl > flamegraph.svg

clickhouse-client -q "SELECT  arrayStringConcat((arrayMap(x -> concat(splitByChar('/', addressToLine(x))[-1], '#', demangle(addressToSymbol(x)) ), trace)), ';') AS stack, sum(abs(size)) AS samples FROM system.trace_log where trace_type = 'Memory' and event_date = today() group by trace order by samples desc FORMAT TabSeparated" | /opt/flamegraph/flamegraph.pl > allocs.svg
clickhouse-client -q "SELECT  arrayStringConcat(arrayReverse(arrayMap(x -> concat(splitByChar('/', addressToLine(x))[-1], '#', demangle(addressToSymbol(x)) ), trace)), ';') AS stack, count() AS samples FROM system.trace_log where trace_type = 'Memory' group by trace FORMAT TabSeparated SETTINGS allow_introspection_functions=1" | /opt/flamegraph/flamegraph.pl > ~/mem1.svg
similar using perf
apt-get update -y
apt-get install -y linux-tools-common linux-tools-generic linux-tools-`uname -r`git
apt-get install -y clickhouse-common-static-dbg clickhouse-common-dbg
mkdir -p /opt/flamegraph
git clone https://github.com/brendangregg/FlameGraph /opt/flamegraph

perf record -F 99 -p $(pidof clickhouse) -G
perf script > /tmp/out.perf
/opt/flamegraph/stackcollapse-perf.pl /tmp/out.perf | /opt/flamegraph/flamegraph.pl > /tmp/flamegraph.svg
also
https://kb.altinity.com/altinity-kb-queries-and-syntax/troubleshooting/#flamegraph
10 - Using array functions to mimic window-functions alike behavior
There are cases where you may need to mimic window functions using arrays in ClickHouse. This could be for optimization purposes, to better manage memory, or to enable on-disk spilling, especially if you’re working with an older version of ClickHouse that doesn’t natively support window functions.
Here’s an example demonstrating how to mimic a window function like runningDifference() using arrays:
Step 1: Create Sample Data
We’ll start by creating a test table with some sample data:
DROP TABLE IS EXISTS test_running_difference

CREATE TABLE test_running_difference
ENGINE = Log AS
SELECT
    number % 20 AS id,
    toDateTime('2010-01-01 00:00:00') + (intDiv(number, 20) * 15) AS ts,
    (number * round(xxHash32(number % 20) / 1000000)) - round(rand() / 1000000) AS val
FROM numbers(100)


SELECT * FROM test_running_difference;

┌─id─┬──────────────────ts─┬────val─┐
│  0 │ 2010-01-01 00:00:00 │  -1209 │
│  1 │ 2010-01-01 00:00:00 │     43 │
│  2 │ 2010-01-01 00:00:00 │   4322 │
│  3 │ 2010-01-01 00:00:00 │    -25 │
│  4 │ 2010-01-01 00:00:00 │  13720 │
│  5 │ 2010-01-01 00:00:00 │    903 │
│  6 │ 2010-01-01 00:00:00 │  18062 │
│  7 │ 2010-01-01 00:00:00 │  -2873 │
│  8 │ 2010-01-01 00:00:00 │   6286 │
│  9 │ 2010-01-01 00:00:00 │  13399 │
│ 10 │ 2010-01-01 00:00:00 │  18320 │
│ 11 │ 2010-01-01 00:00:00 │  11731 │
│ 12 │ 2010-01-01 00:00:00 │    857 │
│ 13 │ 2010-01-01 00:00:00 │   8752 │
│ 14 │ 2010-01-01 00:00:00 │  23060 │
│ 15 │ 2010-01-01 00:00:00 │  41902 │
│ 16 │ 2010-01-01 00:00:00 │  39406 │
│ 17 │ 2010-01-01 00:00:00 │  50010 │
│ 18 │ 2010-01-01 00:00:00 │  57673 │
│ 19 │ 2010-01-01 00:00:00 │  51389 │
│  0 │ 2010-01-01 00:00:15 │  66839 │
│  1 │ 2010-01-01 00:00:15 │  19440 │
│  2 │ 2010-01-01 00:00:15 │  74513 │
│  3 │ 2010-01-01 00:00:15 │  10542 │
│  4 │ 2010-01-01 00:00:15 │  94245 │
│  5 │ 2010-01-01 00:00:15 │   8230 │
│  6 │ 2010-01-01 00:00:15 │  87823 │
│  7 │ 2010-01-01 00:00:15 │   -128 │
│  8 │ 2010-01-01 00:00:15 │  30101 │
│  9 │ 2010-01-01 00:00:15 │  54321 │
│ 10 │ 2010-01-01 00:00:15 │  64078 │
│ 11 │ 2010-01-01 00:00:15 │  31886 │
│ 12 │ 2010-01-01 00:00:15 │   8749 │
│ 13 │ 2010-01-01 00:00:15 │  28982 │
│ 14 │ 2010-01-01 00:00:15 │  61299 │
│ 15 │ 2010-01-01 00:00:15 │  95867 │
│ 16 │ 2010-01-01 00:00:15 │  93667 │
│ 17 │ 2010-01-01 00:00:15 │ 114072 │
│ 18 │ 2010-01-01 00:00:15 │ 124279 │
│ 19 │ 2010-01-01 00:00:15 │ 109605 │
│  0 │ 2010-01-01 00:00:30 │ 135082 │
│  1 │ 2010-01-01 00:00:30 │  37345 │
│  2 │ 2010-01-01 00:00:30 │ 148744 │
│  3 │ 2010-01-01 00:00:30 │  21607 │
│  4 │ 2010-01-01 00:00:30 │ 171744 │
│  5 │ 2010-01-01 00:00:30 │  14736 │
│  6 │ 2010-01-01 00:00:30 │ 155349 │
│  7 │ 2010-01-01 00:00:30 │  -3901 │
│  8 │ 2010-01-01 00:00:30 │  54303 │
│  9 │ 2010-01-01 00:00:30 │  89629 │
│ 10 │ 2010-01-01 00:00:30 │ 106595 │
│ 11 │ 2010-01-01 00:00:30 │  54545 │
│ 12 │ 2010-01-01 00:00:30 │  18903 │
│ 13 │ 2010-01-01 00:00:30 │  48023 │
│ 14 │ 2010-01-01 00:00:30 │  97930 │
│ 15 │ 2010-01-01 00:00:30 │ 152165 │
│ 16 │ 2010-01-01 00:00:30 │ 146130 │
│ 17 │ 2010-01-01 00:00:30 │ 174854 │
│ 18 │ 2010-01-01 00:00:30 │ 189194 │
│ 19 │ 2010-01-01 00:00:30 │ 170134 │
│  0 │ 2010-01-01 00:00:45 │ 207471 │
│  1 │ 2010-01-01 00:00:45 │  54323 │
│  2 │ 2010-01-01 00:00:45 │ 217984 │
│  3 │ 2010-01-01 00:00:45 │  31835 │
│  4 │ 2010-01-01 00:00:45 │ 252709 │
│  5 │ 2010-01-01 00:00:45 │  21493 │
│  6 │ 2010-01-01 00:00:45 │ 221271 │
│  7 │ 2010-01-01 00:00:45 │   -488 │
│  8 │ 2010-01-01 00:00:45 │  76827 │
│  9 │ 2010-01-01 00:00:45 │ 131066 │
│ 10 │ 2010-01-01 00:00:45 │ 149087 │
│ 11 │ 2010-01-01 00:00:45 │  71934 │
│ 12 │ 2010-01-01 00:00:45 │  25125 │
│ 13 │ 2010-01-01 00:00:45 │  65274 │
│ 14 │ 2010-01-01 00:00:45 │ 135980 │
│ 15 │ 2010-01-01 00:00:45 │ 210910 │
│ 16 │ 2010-01-01 00:00:45 │ 200007 │
│ 17 │ 2010-01-01 00:00:45 │ 235872 │
│ 18 │ 2010-01-01 00:00:45 │ 256112 │
│ 19 │ 2010-01-01 00:00:45 │ 229371 │
│  0 │ 2010-01-01 00:01:00 │ 275331 │
│  1 │ 2010-01-01 00:01:00 │  72668 │
│  2 │ 2010-01-01 00:01:00 │ 290366 │
│  3 │ 2010-01-01 00:01:00 │  46074 │
│  4 │ 2010-01-01 00:01:00 │ 329207 │
│  5 │ 2010-01-01 00:01:00 │  26770 │
│  6 │ 2010-01-01 00:01:00 │ 287619 │
│  7 │ 2010-01-01 00:01:00 │  -2207 │
│  8 │ 2010-01-01 00:01:00 │ 100456 │
│  9 │ 2010-01-01 00:01:00 │ 165688 │
│ 10 │ 2010-01-01 00:01:00 │ 194136 │
│ 11 │ 2010-01-01 00:01:00 │  94113 │
│ 12 │ 2010-01-01 00:01:00 │  35810 │
│ 13 │ 2010-01-01 00:01:00 │  85081 │
│ 14 │ 2010-01-01 00:01:00 │ 170256 │
│ 15 │ 2010-01-01 00:01:00 │ 265445 │
│ 16 │ 2010-01-01 00:01:00 │ 254828 │
│ 17 │ 2010-01-01 00:01:00 │ 297238 │
│ 18 │ 2010-01-01 00:01:00 │ 323494 │
│ 19 │ 2010-01-01 00:01:00 │ 286252 │
└────┴─────────────────────┴────────┘

100 rows in set. Elapsed: 0.003 sec.
This table contains IDs, timestamps (ts), and values (val), where each id appears multiple times with different timestamps.
Step 2: Running Difference Example
If you try using runningDifference directly, it works block by block, which can be problematic when the data needs to be ordered or when group changes occur.
select id, val, runningDifference(val) from (select * from test_running_difference order by id, ts);

┌─id─┬────val─┬─runningDifference(val)─┐
│  0 │  -1209 │                      0 │
│  0 │  66839 │                  68048 │
│  0 │ 135082 │                  68243 │
│  0 │ 207471 │                  72389 │
│  0 │ 275331 │                  67860 │
│  1 │     43 │                -275288 │
│  1 │  19440 │                  19397 │
│  1 │  37345 │                  17905 │
│  1 │  54323 │                  16978 │
│  1 │  72668 │                  18345 │
│  2 │   4322 │                 -68346 │
│  2 │  74513 │                  70191 │
│  2 │ 148744 │                  74231 │
│  2 │ 217984 │                  69240 │
│  2 │ 290366 │                  72382 │
│  3 │    -25 │                -290391 │
│  3 │  10542 │                  10567 │
│  3 │  21607 │                  11065 │
│  3 │  31835 │                  10228 │
│  3 │  46074 │                  14239 │
│  4 │  13720 │                 -32354 │
│  4 │  94245 │                  80525 │
│  4 │ 171744 │                  77499 │
│  4 │ 252709 │                  80965 │
│  4 │ 329207 │                  76498 │
│  5 │    903 │                -328304 │
│  5 │   8230 │                   7327 │
│  5 │  14736 │                   6506 │
│  5 │  21493 │                   6757 │
│  5 │  26770 │                   5277 │
│  6 │  18062 │                  -8708 │
│  6 │  87823 │                  69761 │
│  6 │ 155349 │                  67526 │
│  6 │ 221271 │                  65922 │
│  6 │ 287619 │                  66348 │
│  7 │  -2873 │                -290492 │
│  7 │   -128 │                   2745 │
│  7 │  -3901 │                  -3773 │
│  7 │   -488 │                   3413 │
│  7 │  -2207 │                  -1719 │
│  8 │   6286 │                   8493 │
│  8 │  30101 │                  23815 │
│  8 │  54303 │                  24202 │
│  8 │  76827 │                  22524 │
│  8 │ 100456 │                  23629 │
│  9 │  13399 │                 -87057 │
│  9 │  54321 │                  40922 │
│  9 │  89629 │                  35308 │
│  9 │ 131066 │                  41437 │
│  9 │ 165688 │                  34622 │
│ 10 │  18320 │                -147368 │
│ 10 │  64078 │                  45758 │
│ 10 │ 106595 │                  42517 │
│ 10 │ 149087 │                  42492 │
│ 10 │ 194136 │                  45049 │
│ 11 │  11731 │                -182405 │
│ 11 │  31886 │                  20155 │
│ 11 │  54545 │                  22659 │
│ 11 │  71934 │                  17389 │
│ 11 │  94113 │                  22179 │
│ 12 │    857 │                 -93256 │
│ 12 │   8749 │                   7892 │
│ 12 │  18903 │                  10154 │
│ 12 │  25125 │                   6222 │
│ 12 │  35810 │                  10685 │
│ 13 │   8752 │                 -27058 │
│ 13 │  28982 │                  20230 │
│ 13 │  48023 │                  19041 │
│ 13 │  65274 │                  17251 │
│ 13 │  85081 │                  19807 │
│ 14 │  23060 │                 -62021 │
│ 14 │  61299 │                  38239 │
│ 14 │  97930 │                  36631 │
│ 14 │ 135980 │                  38050 │
│ 14 │ 170256 │                  34276 │
│ 15 │  41902 │                -128354 │
│ 15 │  95867 │                  53965 │
│ 15 │ 152165 │                  56298 │
│ 15 │ 210910 │                  58745 │
│ 15 │ 265445 │                  54535 │
│ 16 │  39406 │                -226039 │
│ 16 │  93667 │                  54261 │
│ 16 │ 146130 │                  52463 │
│ 16 │ 200007 │                  53877 │
│ 16 │ 254828 │                  54821 │
│ 17 │  50010 │                -204818 │
│ 17 │ 114072 │                  64062 │
│ 17 │ 174854 │                  60782 │
│ 17 │ 235872 │                  61018 │
│ 17 │ 297238 │                  61366 │
│ 18 │  57673 │                -239565 │
│ 18 │ 124279 │                  66606 │
│ 18 │ 189194 │                  64915 │
│ 18 │ 256112 │                  66918 │
│ 18 │ 323494 │                  67382 │
│ 19 │  51389 │                -272105 │
│ 19 │ 109605 │                  58216 │
│ 19 │ 170134 │                  60529 │
│ 19 │ 229371 │                  59237 │
│ 19 │ 286252 │                  56881 │
└────┴────────┴────────────────────────┘

100 rows in set. Elapsed: 0.005 sec.
The output may look inconsistent because runningDifference requires ordered data within blocks.
Step 3: Using Arrays for Grouping and Calculation
Instead of using runningDifference, we can utilize arrays to group data, sort it, and apply similar logic more efficiently.
Grouping Data into Arrays - You can group multiple columns into arrays by using the groupArray function. For example, to collect several columns as arrays of tuples, you can use the following query:
SELECT
    id,
    groupArray(tuple(ts, val))
FROM test_running_difference
GROUP BY id

┌─id─┬─groupArray(tuple(ts, val))──────────────────────────────────────────────────────────────────────────────────────────────────────────────────────────────────┐
│  0 │ [('2010-01-01 00:00:00',-1209),('2010-01-01 00:00:15',66839),('2010-01-01 00:00:30',135082),('2010-01-01 00:00:45',207471),('2010-01-01 00:01:00',275331)]  │
│  1 │ [('2010-01-01 00:00:00',43),('2010-01-01 00:00:15',19440),('2010-01-01 00:00:30',37345),('2010-01-01 00:00:45',54323),('2010-01-01 00:01:00',72668)]        │
│  2 │ [('2010-01-01 00:00:00',4322),('2010-01-01 00:00:15',74513),('2010-01-01 00:00:30',148744),('2010-01-01 00:00:45',217984),('2010-01-01 00:01:00',290366)]   │
│  3 │ [('2010-01-01 00:00:00',-25),('2010-01-01 00:00:15',10542),('2010-01-01 00:00:30',21607),('2010-01-01 00:00:45',31835),('2010-01-01 00:01:00',46074)]       │
│  4 │ [('2010-01-01 00:00:00',13720),('2010-01-01 00:00:15',94245),('2010-01-01 00:00:30',171744),('2010-01-01 00:00:45',252709),('2010-01-01 00:01:00',329207)]  │
│  5 │ [('2010-01-01 00:00:00',903),('2010-01-01 00:00:15',8230),('2010-01-01 00:00:30',14736),('2010-01-01 00:00:45',21493),('2010-01-01 00:01:00',26770)]        │
│  6 │ [('2010-01-01 00:00:00',18062),('2010-01-01 00:00:15',87823),('2010-01-01 00:00:30',155349),('2010-01-01 00:00:45',221271),('2010-01-01 00:01:00',287619)]  │
│  7 │ [('2010-01-01 00:00:00',-2873),('2010-01-01 00:00:15',-128),('2010-01-01 00:00:30',-3901),('2010-01-01 00:00:45',-488),('2010-01-01 00:01:00',-2207)]       │
│  8 │ [('2010-01-01 00:00:00',6286),('2010-01-01 00:00:15',30101),('2010-01-01 00:00:30',54303),('2010-01-01 00:00:45',76827),('2010-01-01 00:01:00',100456)]     │
│  9 │ [('2010-01-01 00:00:00',13399),('2010-01-01 00:00:15',54321),('2010-01-01 00:00:30',89629),('2010-01-01 00:00:45',131066),('2010-01-01 00:01:00',165688)]   │
│ 10 │ [('2010-01-01 00:00:00',18320),('2010-01-01 00:00:15',64078),('2010-01-01 00:00:30',106595),('2010-01-01 00:00:45',149087),('2010-01-01 00:01:00',194136)]  │
│ 11 │ [('2010-01-01 00:00:00',11731),('2010-01-01 00:00:15',31886),('2010-01-01 00:00:30',54545),('2010-01-01 00:00:45',71934),('2010-01-01 00:01:00',94113)]     │
│ 12 │ [('2010-01-01 00:00:00',857),('2010-01-01 00:00:15',8749),('2010-01-01 00:00:30',18903),('2010-01-01 00:00:45',25125),('2010-01-01 00:01:00',35810)]        │
│ 13 │ [('2010-01-01 00:00:00',8752),('2010-01-01 00:00:15',28982),('2010-01-01 00:00:30',48023),('2010-01-01 00:00:45',65274),('2010-01-01 00:01:00',85081)]      │
│ 14 │ [('2010-01-01 00:00:00',23060),('2010-01-01 00:00:15',61299),('2010-01-01 00:00:30',97930),('2010-01-01 00:00:45',135980),('2010-01-01 00:01:00',170256)]   │
│ 15 │ [('2010-01-01 00:00:00',41902),('2010-01-01 00:00:15',95867),('2010-01-01 00:00:30',152165),('2010-01-01 00:00:45',210910),('2010-01-01 00:01:00',265445)]  │
│ 16 │ [('2010-01-01 00:00:00',39406),('2010-01-01 00:00:15',93667),('2010-01-01 00:00:30',146130),('2010-01-01 00:00:45',200007),('2010-01-01 00:01:00',254828)]  │
│ 17 │ [('2010-01-01 00:00:00',50010),('2010-01-01 00:00:15',114072),('2010-01-01 00:00:30',174854),('2010-01-01 00:00:45',235872),('2010-01-01 00:01:00',297238)] │
│ 18 │ [('2010-01-01 00:00:00',57673),('2010-01-01 00:00:15',124279),('2010-01-01 00:00:30',189194),('2010-01-01 00:00:45',256112),('2010-01-01 00:01:00',323494)] │
│ 19 │ [('2010-01-01 00:00:00',51389),('2010-01-01 00:00:15',109605),('2010-01-01 00:00:30',170134),('2010-01-01 00:00:45',229371),('2010-01-01 00:01:00',286252)] │
└────┴─────────────────────────────────────────────────────────────────────────────────────────────────────────────────────────────────────────────────────────────┘
Sorting Arrays - To sort the arrays by a specific element, for example, by the second element of the tuple, you can use the arraySort function:
SELECT
    id,
    arraySort(x -> (x.2), groupArray((ts, val)))
FROM test_running_difference
GROUP BY id

┌─id─┬─arraySort(lambda(tuple(x), tupleElement(x, 2)), groupArray(tuple(ts, val)))─────────────────────────────────────────────────────────────────────────────────┐
│  0 │ [('2010-01-01 00:00:00',-1209),('2010-01-01 00:00:15',66839),('2010-01-01 00:00:30',135082),('2010-01-01 00:00:45',207471),('2010-01-01 00:01:00',275331)]  │
│  1 │ [('2010-01-01 00:00:00',43),('2010-01-01 00:00:15',19440),('2010-01-01 00:00:30',37345),('2010-01-01 00:00:45',54323),('2010-01-01 00:01:00',72668)]        │
│  2 │ [('2010-01-01 00:00:00',4322),('2010-01-01 00:00:15',74513),('2010-01-01 00:00:30',148744),('2010-01-01 00:00:45',217984),('2010-01-01 00:01:00',290366)]   │
│  3 │ [('2010-01-01 00:00:00',-25),('2010-01-01 00:00:15',10542),('2010-01-01 00:00:30',21607),('2010-01-01 00:00:45',31835),('2010-01-01 00:01:00',46074)]       │
│  4 │ [('2010-01-01 00:00:00',13720),('2010-01-01 00:00:15',94245),('2010-01-01 00:00:30',171744),('2010-01-01 00:00:45',252709),('2010-01-01 00:01:00',329207)]  │
│  5 │ [('2010-01-01 00:00:00',903),('2010-01-01 00:00:15',8230),('2010-01-01 00:00:30',14736),('2010-01-01 00:00:45',21493),('2010-01-01 00:01:00',26770)]        │
│  6 │ [('2010-01-01 00:00:00',18062),('2010-01-01 00:00:15',87823),('2010-01-01 00:00:30',155349),('2010-01-01 00:00:45',221271),('2010-01-01 00:01:00',287619)]  │
│  7 │ [('2010-01-01 00:00:30',-3901),('2010-01-01 00:00:00',-2873),('2010-01-01 00:01:00',-2207),('2010-01-01 00:00:45',-488),('2010-01-01 00:00:15',-128)]       │
│  8 │ [('2010-01-01 00:00:00',6286),('2010-01-01 00:00:15',30101),('2010-01-01 00:00:30',54303),('2010-01-01 00:00:45',76827),('2010-01-01 00:01:00',100456)]     │
│  9 │ [('2010-01-01 00:00:00',13399),('2010-01-01 00:00:15',54321),('2010-01-01 00:00:30',89629),('2010-01-01 00:00:45',131066),('2010-01-01 00:01:00',165688)]   │
│ 10 │ [('2010-01-01 00:00:00',18320),('2010-01-01 00:00:15',64078),('2010-01-01 00:00:30',106595),('2010-01-01 00:00:45',149087),('2010-01-01 00:01:00',194136)]  │
│ 11 │ [('2010-01-01 00:00:00',11731),('2010-01-01 00:00:15',31886),('2010-01-01 00:00:30',54545),('2010-01-01 00:00:45',71934),('2010-01-01 00:01:00',94113)]     │
│ 12 │ [('2010-01-01 00:00:00',857),('2010-01-01 00:00:15',8749),('2010-01-01 00:00:30',18903),('2010-01-01 00:00:45',25125),('2010-01-01 00:01:00',35810)]        │
│ 13 │ [('2010-01-01 00:00:00',8752),('2010-01-01 00:00:15',28982),('2010-01-01 00:00:30',48023),('2010-01-01 00:00:45',65274),('2010-01-01 00:01:00',85081)]      │
│ 14 │ [('2010-01-01 00:00:00',23060),('2010-01-01 00:00:15',61299),('2010-01-01 00:00:30',97930),('2010-01-01 00:00:45',135980),('2010-01-01 00:01:00',170256)]   │
│ 15 │ [('2010-01-01 00:00:00',41902),('2010-01-01 00:00:15',95867),('2010-01-01 00:00:30',152165),('2010-01-01 00:00:45',210910),('2010-01-01 00:01:00',265445)]  │
│ 16 │ [('2010-01-01 00:00:00',39406),('2010-01-01 00:00:15',93667),('2010-01-01 00:00:30',146130),('2010-01-01 00:00:45',200007),('2010-01-01 00:01:00',254828)]  │
│ 17 │ [('2010-01-01 00:00:00',50010),('2010-01-01 00:00:15',114072),('2010-01-01 00:00:30',174854),('2010-01-01 00:00:45',235872),('2010-01-01 00:01:00',297238)] │
│ 18 │ [('2010-01-01 00:00:00',57673),('2010-01-01 00:00:15',124279),('2010-01-01 00:00:30',189194),('2010-01-01 00:00:45',256112),('2010-01-01 00:01:00',323494)] │
│ 19 │ [('2010-01-01 00:00:00',51389),('2010-01-01 00:00:15',109605),('2010-01-01 00:00:30',170134),('2010-01-01 00:00:45',229371),('2010-01-01 00:01:00',286252)] │
└────┴─────────────────────────────────────────────────────────────────────────────────────────────────────────────────────────────────────────────────────────────┘

20 rows in set. Elapsed: 0.004 sec.
This sorts each array by the val (second element of the tuple) for each id.
Simplified Sorting Example - We can rewrite the query in a more concise way using WITH clauses for better readability:
WITH
    groupArray(tuple(ts, val)) as window_rows,
    arraySort(x -> x.1, window_rows) as sorted_window_rows
SELECT
    id,
    sorted_window_rows
FROM test_running_difference
GROUP BY id
Applying Calculations with Arrays - Once the data is sorted, you can apply array functions like arrayMap and arrayDifference to calculate differences between values in the arrays:
WITH
    groupArray(tuple(ts, val)) as window_rows,
    arraySort(x -> x.1, window_rows) as sorted_window_rows,
    arrayMap(x -> x.2, sorted_window_rows) as sorted_window_rows_val_column,
	arrayDifference(sorted_window_rows_val_column) as sorted_window_rows_val_column_diff
SELECT
    id,
    sorted_window_rows_val_column_diff
FROM test_running_difference
GROUP BY id

┌─id─┬─sorted_window_rows_val_column_diff─┐
│  0 │ [0,68048,68243,72389,67860]        │
│  1 │ [0,19397,17905,16978,18345]        │
│  2 │ [0,70191,74231,69240,72382]        │
│  3 │ [0,10567,11065,10228,14239]        │
│  4 │ [0,80525,77499,80965,76498]        │
│  5 │ [0,7327,6506,6757,5277]            │
│  6 │ [0,69761,67526,65922,66348]        │
│  7 │ [0,2745,-3773,3413,-1719]          │
│  8 │ [0,23815,24202,22524,23629]        │
│  9 │ [0,40922,35308,41437,34622]        │
│ 10 │ [0,45758,42517,42492,45049]        │
│ 11 │ [0,20155,22659,17389,22179]        │
│ 12 │ [0,7892,10154,6222,10685]          │
│ 13 │ [0,20230,19041,17251,19807]        │
│ 14 │ [0,38239,36631,38050,34276]        │
│ 15 │ [0,53965,56298,58745,54535]        │
│ 16 │ [0,54261,52463,53877,54821]        │
│ 17 │ [0,64062,60782,61018,61366]        │
│ 18 │ [0,66606,64915,66918,67382]        │
│ 19 │ [0,58216,60529,59237,56881]        │
└────┴────────────────────────────────────┘

20 rows in set. Elapsed: 0.005 sec.
You can do also a lot of magic with arrayEnumerate and accessing different values by their ids.
Reverting Arrays Back to Rows - You can convert the arrays back into rows using arrayJoin:
WITH
    groupArray(tuple(ts, val)) as window_rows,
    arraySort(x -> x.1, window_rows) as sorted_window_rows,
    arrayMap(x -> x.2, sorted_window_rows) as sorted_window_rows_val_column,
	arrayDifference(sorted_window_rows_val_column) as sorted_window_rows_val_column_diff,
	arrayJoin(sorted_window_rows_val_column_diff) as diff
SELECT
    id,
    diff
FROM test_running_difference
GROUP BY id
Or use ARRAY JOIN to join the arrays back to the original structure:
SELECT
  id,
  diff,
  ts
FROM
(
WITH
    groupArray(tuple(ts, val)) as window_rows,
    arraySort(x -> x.1, window_rows) as sorted_window_rows,
    arrayMap(x -> x.2, sorted_window_rows) as sorted_window_rows_val_column
SELECT
    id,
	arrayDifference(sorted_window_rows_val_column) as sorted_window_rows_val_column_diff,
    arrayMap(x -> x.1, sorted_window_rows) as sorted_window_rows_ts_column
FROM test_running_difference
GROUP BY id
) as t1
ARRAY JOIN sorted_window_rows_val_column_diff as diff, sorted_window_rows_ts_column as ts
This allows you to manipulate and analyze data within arrays effectively, using powerful functions such as arrayMap, arrayDifference, and arrayEnumerate.
11 - -State & -Merge combinators
The -State combinator in ClickHouse® does not store additional information about the -If combinator, which means that aggregate functions with and without -If have the same serialized data structure. This can be verified through various examples, as demonstrated below.
Example 1: maxIfState and maxState In this example, we use the maxIfState and maxState functions on a dataset of numbers, serialize the result, and merge it using the maxMerge function.
$ clickhouse-local --query "SELECT maxIfState(number,number % 2) as x, maxState(number) as y FROM numbers(10) FORMAT RowBinary" | clickhouse-local --input-format RowBinary --structure="x AggregateFunction(max,UInt64), y AggregateFunction(max,UInt64)" --query "SELECT maxMerge(x), maxMerge(y) FROM table"
9       9
$ clickhouse-local --query "SELECT maxIfState(number,number % 2) as x, maxState(number) as y FROM numbers(11) FORMAT RowBinary" | clickhouse-local --input-format RowBinary --structure="x AggregateFunction(max,UInt64), y AggregateFunction(max,UInt64)" --query "SELECT maxMerge(x), maxMerge(y) FROM table"
9       10
In both cases, the -State combinator results in identical serialized data footprints, regardless of the conditions in the -If variant. The maxMerge function merges the state without concern for the original -If condition.
Example 2: quantilesTDigestIfState Here, we use the quantilesTDigestIfState function to demonstrate that functions like quantile-based and sequence matching functions follow the same principle regarding serialized data consistency.
$ clickhouse-local --query "SELECT quantilesTDigestIfState(0.1,0.9)(number,number % 2) FROM  numbers(1000000) FORMAT RowBinary" | clickhouse-local --input-format RowBinary --structure="x AggregateFunction(quantileTDigestWeighted(0.5),UInt64,UInt8)" --query "SELECT quantileTDigestWeightedMerge(0.4)(x) FROM table"
400000

$ clickhouse-local --query "SELECT quantilesTDigestIfState(0.1,0.9)(number,number % 2) FROM  numbers(1000000) FORMAT RowBinary" | clickhouse-local --input-format RowBinary --structure="x AggregateFunction(quantilesTDigestWeighted(0.5),UInt64,UInt8)" --query "SELECT quantilesTDigestWeightedMerge(0.4,0.8)(x) FROM table"
[400000,800000]
Example 3: Quantile Functions with -Merge This example shows how the quantileState and quantileMerge functions work together to calculate a specific quantile.
SELECT quantileMerge(0.9)(x)
FROM
(
    SELECT quantileState(0.1)(number) AS x
    FROM numbers(1000)
)

┌─quantileMerge(0.9)(x)─┐
│                 899.1 │
└───────────────────────┘
Example 4: sequenceMatch and sequenceCount Functions with -Merge Finally, we demonstrate the behavior of sequenceMatchState and sequenceMatchMerge, as well as sequenceCountState and sequenceCountMerge, in ClickHouse.
SELECT
    sequenceMatchMerge('(?2)(?3)')(x) AS `2_3`,
    sequenceMatchMerge('(?1)(?4)')(x) AS `1_4`,
    sequenceMatchMerge('(?1)(?2)(?3)')(x) AS `1_2_3`
FROM
(
    SELECT sequenceMatchState('(?1)(?2)(?3)')(number, number = 8, number = 5, number = 6, number = 9) AS x
    FROM numbers(10)
)

┌─2_3─┬─1_4─┬─1_2_3─┐
│   1 │   1 │     0 │
└─────┴─────┴───────┘
Similarly, sequenceCountState and sequenceCountMerge functions behave consistently when merging states:
SELECT
    sequenceCountMerge('(?1)(?2)')(x) AS `2_3`,
    sequenceCountMerge('(?1)(?4)')(x) AS `1_4`,
    sequenceCountMerge('(?1)(?2)(?3)')(x) AS `1_2_3`
FROM
(
    WITH number % 4 AS cond
    SELECT sequenceCountState('(?1)(?2)(?3)')(number, cond = 1, cond = 2, cond = 3, cond = 5) AS x
    FROM numbers(11)
)

┌─2_3─┬─1_4─┬─1_2_3─┐
│   3 │   0 │     2 │
└─────┴─────┴───────┘
ClickHouse’s -State combinator stores serialized data in a consistent manner, irrespective of conditions used with -If. The same applies to a wide range of functions, including quantile and sequence-based functions. This behavior ensures that functions like maxMerge, quantileMerge, sequenceMatchMerge, and sequenceCountMerge work seamlessly, even across varied inputs.
12 - ALTER MODIFY COLUMN is stuck, the column is inaccessible.
Problem
You’ve created a table in ClickHouse with the following structure:
CREATE TABLE modify_column(column_n String) ENGINE=MergeTree() ORDER BY tuple();
You populated the table with some data:
INSERT INTO modify_column VALUES ('key_a');
INSERT INTO modify_column VALUES ('key_b');
INSERT INTO modify_column VALUES ('key_c');
Next, you attempted to change the column type using this query:
ALTER TABLE modify_column MODIFY COLUMN column_n Enum8('key_a'=1, 'key_b'=2);
However, the operation failed, and you encountered an error when inspecting the system.mutations table:
SELECT *
FROM system.mutations
WHERE (table = 'modify_column') AND (is_done = 0)
FORMAT Vertical

Row 1:
──────
database:                   default
table:                      modify_column
mutation_id:                mutation_4.txt
command:                    MODIFY COLUMN `column_n` Enum8('key_a' = 1, 'key_b' = 2)
create_time:                2021-03-03 18:38:09
block_numbers.partition_id: ['']
block_numbers.number:       [4]
parts_to_do_names:          ['all_3_3_0']
parts_to_do:                1
is_done:                    0
latest_failed_part:         all_3_3_0
latest_fail_time:           2021-03-03 18:38:59
latest_fail_reason:         Code: 36, e.displayText() = DB::Exception: Unknown element 'key_c' for type Enum8('key_a' = 1, 'key_b' = 2): while executing 'FUNCTION CAST(column_n :: 0, 'Enum8(\'key_a\' = 1, \'key_b\' = 2)' :: 1) -> cast(column_n, 'Enum8(\'key_a\' = 1, \'key_b\' = 2)') Enum8('key_a' = 1, 'key_b' = 2) : 2': (while reading from part /var/lib/clickhouse/data/default/modify_column/all_3_3_0/): While executing MergeTree (version 21.3.1.6041)
The mutation result showed an error indicating that the value ‘key_c’ was not recognized in the Enum8 definition:
Unknown element 'key_c' for type Enum8('key_a' = 1, 'key_b' = 2)
Now, when trying to query the column, ClickHouse returns an exception and the column becomes inaccessible:
SELECT column_n
FROM modify_column

┌─column_n─┐
│ key_a    │
└──────────┘
┌─column_n─┐
│ key_b    │
└──────────┘
↓ Progress: 2.00 rows, 2.00 B (19.48 rows/s., 19.48 B/s.)
2 rows in set. Elapsed: 0.104 sec.

Received exception from server (version 21.3.1):
Code: 36. DB::Exception: Received from localhost:9000. DB::Exception: Unknown element 'key_c' for type Enum8('key_a' = 1, 'key_b' = 2): while executing 'FUNCTION CAST(column_n :: 0, 'Enum8(\'key_a\' = 1, \'key_b\' = 2)' :: 1) -> cast(column_n, 'Enum8(\'key_a\' = 1, \'key_b\' = 2)') Enum8('key_a' = 1, 'key_b' = 2) : 2': (while reading from part /var/lib/clickhouse/data/default/modify_column/all_3_3_0/): While executing MergeTreeThread.
This query results in:
Code: 36. DB::Exception: Unknown element 'key_c' for type Enum8('key_a' = 1, 'key_b' = 2)
Root Cause
The failure occurred because the Enum8 type only allows for predefined values. Since ‘key_c’ wasn’t included in the definition, the mutation failed and left the table in an inconsistent state.
Solution
- Identify and Terminate the Stuck Mutation First, you need to locate the mutation that’s stuck in an incomplete state.
SELECT * FROM system.mutations WHERE table = 'modify_column' AND is_done=0 FORMAT Vertical;
Once you’ve identified the mutation, terminate it using:
KILL MUTATION WHERE table = 'modify_column' AND mutation_id = 'id_of_stuck_mutation';
This will stop the operation and allow you to revert the changes.
- Revert the Column Type Next, revert the column back to its original type, which was String, to restore the table’s accessibility:
ALTER TABLE modify_column MODIFY COLUMN column_n String;
- Verify the Column is Accessible Again To ensure the column is functioning normally, run a simple query to verify its data:
SELECT column_n, count() FROM modify_column GROUP BY column_n;
- Apply the Correct Column Modification Now that the column is accessible, you can safely reapply the ALTER query, but this time include all the required enum values:
ALTER TABLE modify_column MODIFY COLUMN column_n Enum8('key_a'=1, 'key_b'=2, 'key_c'=3);
- Monitor Progress You can monitor the progress of the column modification using the system.mutations or system.parts_columns tables to ensure everything proceeds as expected:
To track mutation progress:
SELECT
    command,
    parts_to_do,
    is_done
FROM system.mutations
WHERE table = 'modify_column';
To review the column’s active parts:
SELECT
    column,
    type,
    count() AS parts,
    sum(rows) AS rows,
    sum(bytes_on_disk) AS bytes
FROM system.parts_columns
WHERE (table = 'modify_column') AND (column = 'column_n') AND active
GROUP BY
    column,
    type;
13 - ANSI SQL mode
To make ClickHouse® more compatible with ANSI SQL standards (at the expense of some performance), you can adjust several settings. These configurations will bring ClickHouse closer to ANSI SQL behavior but may introduce a slowdown in query performance:
join_use_nulls=1
Introduced in: early versions Ensures that JOIN operations return NULL for non-matching rows, aligning with standard SQL behavior.
cast_keep_nullable=1
Introduced in: v20.5 Preserves the NULL flag when casting between data types, which is typical in ANSI SQL.
union_default_mode='DISTINCT'
Introduced in: v21.1 Makes the UNION operation default to UNION DISTINCT, which removes duplicate rows, following ANSI SQL behavior.
allow_experimental_window_functions=1
Introduced in: v21.3 Enables support for window functions, which are a standard feature in ANSI SQL.
prefer_column_name_to_alias=1
Introduced in: v21.4 This setting resolves ambiguities by preferring column names over aliases, following ANSI SQL conventions.
group_by_use_nulls=1
Introduced in: v22.7 Allows NULL values to appear in the GROUP BY clause, consistent with ANSI SQL behavior.
By enabling these settings, ClickHouse becomes more ANSI SQL-compliant, although this may come with a trade-off in terms of performance. Each of these options can be enabled as needed, based on the specific SQL compatibility requirements of your application.
14 - Async INSERTs
Overview
Async INSERTs is a ClickHouse® feature that enables automatic server-side batching of data. While we generally recommend batching at the application/ingestor level for better control and decoupling, async inserts are valuable when you have hundreds or thousands of clients performing small inserts and client-side batching is not feasible.
Key Documentation: Official Async Inserts Documentation
How Async Inserts Work
When async_insert=1 is enabled, ClickHouse buffers incoming inserts and flushes them to disk when one of these conditions is met:
- Buffer reaches specified size (
async_insert_max_data_size) - Time threshold elapses (
async_insert_busy_timeout_ms) - Maximum number of queries accumulate (
async_insert_max_query_number)
Critical Configuration Settings
Core Settings
-- Enable async inserts (0=disabled, 1=enabled)
SET async_insert = 1;

-- Wait behavior (STRONGLY RECOMMENDED: use 1)
-- 0 = fire-and-forget mode (risky - no error feedback)
-- 1 = wait for data to be written to storage
SET wait_for_async_insert = 1;

-- Buffer flush conditions
SET async_insert_max_data_size = 1000000;  -- 1MB default
SET async_insert_busy_timeout_ms = 1000;    -- 1 second
SET async_insert_max_query_number = 100;    -- max queries before flush
Adaptive Timeout (Since 24.3)
-- Adaptive timeout automatically adjusts flush timing based on server load
-- Default: 1 (enabled) - OVERRIDES manual timeout settings
-- Set to 0 for deterministic behavior with manual settings
SET async_insert_use_adaptive_busy_timeout = 0;
Important Behavioral Notes
What Works and What Doesn’t
✅ Works with Async Inserts:
- Direct INSERT with VALUES
- INSERT with FORMAT (JSONEachRow, CSV, etc.)
- Native protocol inserts (since 22.x)
❌ Does NOT Work:
INSERT .. SELECTstatements - Other strategies are needed for managing performance and load. Do not useasync_insert.
Data Safety Considerations
ALWAYS use wait_for_async_insert = 1 in production!
Risks with wait_for_async_insert = 0:
- Silent data loss on errors (read-only table, disk full, too many parts)
- Data loss on sudden restart (no fsync by default)
- Data not immediately queryable after acknowledgment
- No error feedback to client
Deduplication Behavior
- Sync inserts: Automatic deduplication enabled by default
- Async inserts: Deduplication disabled by default
- Enable with
async_insert_deduplicate = 1(since 22.x) - Warning: Don’t use with
deduplicate_blocks_in_dependent_materialized_views = 1
features / improvements
- Async insert dedup: Support block deduplication for asynchronous inserts. Before this change, async inserts did not support deduplication, because multiple small inserts coexisted in one inserted batch:
- Added system table
asynchronous_insert_log. It contains information about asynchronous inserts (including results of queries in fire-and-forget mode. (with wait_for_async_insert=0)) for better introspection #42040 - Support async inserts in clickhouse-client for queries with inlined data (Native protocol):
- Async insert backpressure #4762
- Limit the deduplication overhead when using
async_insert_deduplicate#46549 SYSTEM FLUSH ASYNC INSERTS#49160- Adjustable asynchronous insert timeouts #58486
bugfixes
- Fixed bug which could lead to deadlock while using asynchronous inserts #43233 .
- Fix crash when async inserts with deduplication are used for ReplicatedMergeTree tables using a nondefault merging algorithm #51676
- Async inserts not working with log_comment setting 48430
- Fix misbehaviour with async inserts with deduplication #50663
- Reject Insert if
async_insert=1anddeduplicate_blocks_in_dependent_materialized_views=1#60888 - Disable
async_insert_use_adaptive_busy_timeoutcorrectly with compatibility settings #61486
observability / introspection
In 22.x versions, it is not possible to relate part_log/query_id column with asynchronous_insert_log/query_id column. We need to use query_log/query_id:
asynchronous_insert_log shows up the query_id and flush_query_id of each async insert. The query_id from asynchronous_insert_log shows up in the system.query_log as type = 'QueryStart' but the same query_id does not show up in the query_id column of the system.part_log. Because the query_id column in the part_log is the identifier of the INSERT query that created a data part, and it seems it is for sync INSERTS but not for async inserts.
So in asynchronous_inserts table you can check the current batch that still has not been flushed. In the asynchronous_insert_log you can find a log of all the flushed async inserts.
This has been improved in ClickHouse 23.7 Flush queries for async inserts (the queries that do the final push of data) are now logged in the system.query_log where they appear as query_kind = 'AsyncInsertFlush' #51160
Versions
- 23.8 is a good version to start using async inserts because of the improvements and bugfixes.
- 24.3 the new adaptive timeout mechanism has been added so ClickHouse will throttle the inserts based on the server load.#58486
This new feature is enabled by default and will OVERRRIDE current async insert settings, so better to disable it if your async insert settings are working. Here’s how to do it in a clickhouse-client session:
SET async_insert_use_adaptive_busy_timeout = 0;You can also add it as a setting on the INSERT or as a profile setting.
Metrics
SELECT name
FROM system.columns
WHERE (`table` = 'metric_log') AND ((name ILIKE '%asyncinsert%') OR (name ILIKE '%asynchronousinsert%'))

┌─name─────────────────────────────────────────────┐
│ ProfileEvent_AsyncInsertQuery                    │
│ ProfileEvent_AsyncInsertBytes                    │
│ ProfileEvent_AsyncInsertRows                     │
│ ProfileEvent_AsyncInsertCacheHits                │
│ ProfileEvent_FailedAsyncInsertQuery              │
│ ProfileEvent_DistributedAsyncInsertionFailures   │
│ CurrentMetric_AsynchronousInsertThreads          │
│ CurrentMetric_AsynchronousInsertThreadsActive    │
│ CurrentMetric_AsynchronousInsertThreadsScheduled │
│ CurrentMetric_AsynchronousInsertQueueSize        │
│ CurrentMetric_AsynchronousInsertQueueBytes       │
│ CurrentMetric_PendingAsyncInsert                 │
│ CurrentMetric_AsyncInsertCacheSize               │
└──────────────────────────────────────────────────┘

SELECT *
FROM system.metrics
WHERE (metric ILIKE '%asyncinsert%') OR (metric ILIKE '%asynchronousinsert%')

┌─metric─────────────────────────────┬─value─┬─description─────────────────────────────────────────────────────────────┐
│ AsynchronousInsertThreads          │     1 │ Number of threads in the AsynchronousInsert thread pool.                │
│ AsynchronousInsertThreadsActive    │     0 │ Number of threads in the AsynchronousInsert thread pool running a task. │
│ AsynchronousInsertThreadsScheduled │     0 │ Number of queued or active jobs in the AsynchronousInsert thread pool.  │
│ AsynchronousInsertQueueSize        │     1 │ Number of pending tasks in the AsynchronousInsert queue.                │
│ AsynchronousInsertQueueBytes       │   680 │ Number of pending bytes in the AsynchronousInsert queue.                │
│ PendingAsyncInsert                 │     7 │ Number of asynchronous inserts that are waiting for flush.              │
│ AsyncInsertCacheSize               │     0 │ Number of async insert hash id in cache                                 │
└────────────────────────────────────┴───────┴─────────────────────────────────────────────────────────────────────────┘
15 - Atomic insert
An insert is atomic if it creates only one part.
An insert will create one part if:
- Data is inserted directly into a MergeTree table
- Data is inserted into a single partition.
- Smaller blocks are properly squashed up to the configured block size (
min_insert_block_size_rowsandmin_insert_block_size_bytes) - For INSERT FORMAT:
- Number of rows is less than
max_insert_block_size(default is1048545) - Parallel formatting is disabled (For TSV, TSKV, CSV, and JSONEachRow formats setting
input_format_parallel_parsing=0is set).
- Number of rows is less than
- For INSERT SELECT (including all variants with table functions), data for insert should be created fully deterministically.
- non-deterministic functions there like rand() not used in SELECT
- Number of rows/bytes is less than
min_insert_block_size_rowsandmin_insert_block_size_bytes - And one of:
- setting max_threads to 1
- adding ORDER BY to the table’s DDL (not ordering by tuple)
- There is some ORDER BY inside SELECT
- See example
- The MergeTree table doesn’t have Materialized Views (there is no atomicity Table <> MV)
https://github.com/ClickHouse/ClickHouse/issues/9195#issuecomment-587500824 https://github.com/ClickHouse/ClickHouse/issues/5148#issuecomment-487757235
Example how to make a large insert atomically
Generate test data in Native and TSV format ( 100 millions rows )
Text formats and Native format require different set of settings, here I want to find / demonstrate mandatory minimum of settings for any case.
clickhouse-client -q \
     'SELECT toInt64(number) A, toString(number) S FROM numbers(100000000) FORMAT Native' > t.native
clickhouse-client -q \
     'SELECT toInt64(number) A, toString(number) S FROM numbers(100000000) FORMAT TSV' > t.tsv
Insert with default settings (not atomic)
DROP TABLE IF EXISTS trg;
CREATE TABLE trg(A Int64, S String) Engine=MergeTree ORDER BY A;

-- Load data in Native format
clickhouse-client  -q 'INSERT INTO trg FORMAT Native' <t.native

-- Check how many parts is created
SELECT
    count(),
    min(rows),
    max(rows),
    sum(rows)
FROM system.parts
WHERE (level = 0) AND (table = 'trg');
┌─count()─┬─min(rows)─┬─max(rows)─┬─sum(rows)─┐
│      90 │    890935 │   1113585 │ 100000000 │
└─────────┴───────────┴───────────┴───────────┘

--- 90 parts! was created - not atomic


DROP TABLE IF EXISTS trg;
CREATE TABLE trg(A Int64, S String) Engine=MergeTree ORDER BY A;

-- Load data in TSV format
clickhouse-client  -q 'INSERT INTO trg FORMAT TSV' <t.tsv

-- Check how many parts is created
SELECT
    count(),
    min(rows),
    max(rows),
    sum(rows)
FROM system.parts
WHERE (level = 0) AND (table = 'trg');
┌─count()─┬─min(rows)─┬─max(rows)─┬─sum(rows)─┐
│      85 │    898207 │   1449610 │ 100000000 │
└─────────┴───────────┴───────────┴───────────┘

--- 85 parts! was created - not atomic
Insert with adjusted settings (atomic)
Atomic insert use more memory because it needs 100 millions rows in memory.
DROP TABLE IF EXISTS trg;
CREATE TABLE trg(A Int64, S String) Engine=MergeTree ORDER BY A;

clickhouse-client --input_format_parallel_parsing=0 \
                  --min_insert_block_size_bytes=0 \
                  --min_insert_block_size_rows=1000000000 \
                  -q 'INSERT INTO trg FORMAT Native' <t.native

-- Check that only one part is created
SELECT
    count(),
    min(rows),
    max(rows),
    sum(rows)
FROM system.parts
WHERE (level = 0) AND (table = 'trg');
┌─count()─┬─min(rows)─┬─max(rows)─┬─sum(rows)─┐
│       1 │ 100000000 │ 100000000 │ 100000000 │
└─────────┴───────────┴───────────┴───────────┘

-- 1 part, success.


DROP TABLE IF EXISTS trg;
CREATE TABLE trg(A Int64, S String) Engine=MergeTree ORDER BY A;

-- Load data in TSV format
clickhouse-client --input_format_parallel_parsing=0 \
                  --min_insert_block_size_bytes=0 \
                  --min_insert_block_size_rows=1000000000 \
                  -q 'INSERT INTO trg FORMAT TSV' <t.tsv

-- Check that only one part is created
SELECT
    count(),
    min(rows),
    max(rows),
    sum(rows)
FROM system.parts
WHERE (level = 0) AND (table = 'trg');
┌─count()─┬─min(rows)─┬─max(rows)─┬─sum(rows)─┐
│       1 │ 100000000 │ 100000000 │ 100000000 │
└─────────┴───────────┴───────────┴───────────┘

-- 1 part, success.
16 - ClickHouse® Projections
Projections in ClickHouse act as inner tables within a main table, functioning as a mechanism to optimize queries by using these inner tables when only specific columns are needed. Essentially, a projection is similar to a Materialized View with an AggregatingMergeTree engine , designed to be automatically populated with relevant data.
However, too many projections can lead to excess storage, much like overusing Materialized Views. Projections share the same lifecycle as the main table, meaning they are automatically backfilled and don’t require query rewrites, which is particularly advantageous when integrating with BI tools.
Projection parts are stored within the main table parts, and their merges occur simultaneously as the main table merges, ensuring data consistency without additional maintenance.
compared to a separate table+MV setup:
- A separate table gives you more freedom (like partitioning, granularity, etc), but projections - more consistency (parts managed as a whole)
- Projections do not support many features (like indexes and FINAL). That becomes better with recent versions, but still a drawback
The design approach for projections is the same as for indexes. Create a table and give it to users. If you encounter a slower query, add a projection for that particular query (or set of similar queries). You can create 10+ projections per table, materialize, drop, etc - the very same as indexes. You exchange query speed for disk space/IO and CPU needed to build and rebuild projections on merges.
Links
- Amos Bird - kuaishou.com - Projections in ClickHouse. slides . video
- Documentation
- tinybird blog article
- ClickHouse presentation on Projections https://www.youtube.com/watch?v=QDAJTKZT8y4
- Blog video https://clickhouse.com/videos/how-to-a-clickhouse-query-using-projections
Why is a ClickHouse projection not used?
A query analyzer should have a reason for using a projection and should not have any limitation to do so.
- the query should use ONLY the columns defined in the projection.
- There should be a lot of data to read from the main table (gigabytes)
- for ORDER BY projection WHERE statement referring to a column should be in the query
- FINAL queries do not work with projections.
- tables with DELETEd rows do not work with projections. This is because rows in a projection may be affected by a DELETE operation. But there is a MergeTree setting lightweight_mutation_projection_mode to change the behavior (Since 24.7)
- Projection is used only if it is cheaper to read from it than from the table (expected amount of rows and GBs read is smaller)
- Projection should be materialized. Verify that all parts have the needed projection by comparing system.parts and system.projection_parts (see query below)
- a bug in a Clickhouse version. Look at changelog and search for projection.
- If there are many projections per table, the analyzer can select any of them. If you think that it is better, use settings
preferred_optimize_projection_nameorforce_optimize_projection_name - If expressions are used instead of plain column names, the query should use the exact expression as defined in the projection with the same functions and modifiers. Use column aliases to make the query the very same as in the projection definition:
CREATE TABLE test
(
    a Int64,
    ts DateTime,
    week alias toStartOfWeek(ts),
    PROJECTION weekly_projection
    (
        SELECT week, sum(a) group by week
    )
)
ENGINE = MergeTree ORDER BY a;

insert into test
select number, now()-number*100
from numbers(1e7);

--explain indexes=1
select week, sum(a) from test group by week
settings force_optimize_projection=1;
https://fiddle.clickhouse.com/7f331eb2-9408-4813-9c67-caef4cdd227d
Explain result: ReadFromMergeTree (weekly_projection)
Expression ((Project names + Projection))
  Aggregating
    Expression
      ReadFromMergeTree (weekly_projection)
      Indexes:
        PrimaryKey
          Condition: true
          Parts: 9/9
          Granules: 9/1223
check parts
- has the projection materialized
- does not have lightweight deletes
SELECT
    p.database AS base_database,
    p.table AS base_table,
    p.name AS base_part_name,         -- Name of the part in the base table
    p.has_lightweight_delete,
    pp.active
FROM system.parts AS p  -- Alias for the base table's parts
LEFT JOIN system.projection_parts AS pp -- Alias for the projection's parts
ON    p.database = pp.database AND p.table = pp.table
  AND p.name = pp.parent_name
  AND pp.name = 'projection'
WHERE
    p.database = 'database'
    AND p.table = 'table'
    AND p.active  -- Consider only active parts of the base table
  -- and not pp.active          -- see only missed in the list
ORDER BY p.database, p.table, p.name;
Recalculate on Merge
What happens in the case of non-trivial background merges in ReplacingMergeTree, AggregatingMergeTree and similar, and OPTIMIZE table DEDUPLICATE queries?
- Before version 24.8, projections became out of sync with the main data.
- Since version 24.8, it is controlled by a new table-level setting:
deduplicate_merge_projection_mode =throw/drop/rebuild - Somewhere later (before 25.3)
ignoreoption was introduced. It can be helpful for cases when SummingMergeTree is used with Projections and no DELETE operation in any flavor (Replacing/Collapsing/DELETE/ALTER DELETE) is executed over the table.
However, projection usage is still disabled for FINAL queries. So, you have to use OPTIMIZE FINAL or SELECT …GROUP BY instead of FINAL for fighting duplicates between parts
CREATE TABLE users (uid Int16, name String, version Int16,
  projection xx (
     select name,uid,version order by name
  )
) ENGINE=ReplacingMergeTree order by uid
settings deduplicate_merge_projection_mode='rebuild'
  ;

INSERT INTO users
SELECT
    number AS uid,
    concat('User_', toString(uid)) AS name,
    1 AS version
FROM numbers(100000);

INSERT INTO users
SELECT
    number AS uid,
    concat('User_', toString(uid)) AS name,
    2 AS version
FROM numbers(100000);

SELECT 'duplicate',name,uid,version FROM users
where name ='User_98304'
settings force_optimize_projection=1 ;

SELECT 'dedup by group by/limit 1 by',name,uid,version FROM users
where name ='User_98304'
order by version DESC
limit 1 by uid
settings force_optimize_projection=1
;

optimize table users final ;

SELECT 'dedup after optimize',name,uid,version FROM users
where name ='User_98304'
settings force_optimize_projection=1 ;
https://fiddle.clickhouse.com/e1977a66-09ce-43c4-aabc-508c957d44d7
System tables
- system.projections
- system.projection_parts
- system.projection_parts_columns
SELECT
    database,
    table,
    name,
    formatReadableSize(sum(data_compressed_bytes) AS size) AS compressed,
    formatReadableSize(sum(data_uncompressed_bytes) AS usize) AS uncompressed,
    round(usize / size, 2) AS compr_rate,
    sum(rows) AS rows,
    count() AS part_count
FROM system.projection_parts
WHERE active
GROUP BY
    database,
    table,
    name
ORDER BY size DESC;
How to receive a list of tables with projections?
select database, table from system.tables
where create_table_query ilike '%projection%'
  and database <> 'system'
Examples
Aggregating ClickHouse projections
create table z(Browser String, Country UInt8, F Float64)
Engine=MergeTree
order by Browser;

insert into z
     select toString(number%9999),
     number%33, 1
from numbers(100000000);

--Q1)
select sum(F), Browser
from z
group by Browser format Null;
Elapsed: 0.205 sec. Processed 100.00 million rows

--Q2)
select sum(F), Browser, Country
from z
group by Browser,Country format Null;
Elapsed: 0.381 sec. Processed 100.00 million rows

--Q3)
select sum(F),count(), Browser, Country
from z
group by Browser,Country format Null;
Elapsed: 0.398 sec. Processed 100.00 million rows

alter table z add projection pp
   (select Browser,Country, count(), sum(F)
    group by Browser,Country);
alter table z materialize projection pp;

---- 0 = don't use proj, 1 = use projection
set allow_experimental_projection_optimization=1;

--Q1)
select sum(F), Browser
from z
group by Browser format Null;
Elapsed: 0.003 sec. Processed 22.43 thousand rows

--Q2)
select sum(F), Browser, Country
from z
group by Browser,Country format Null;
Elapsed: 0.004 sec. Processed 22.43 thousand rows

--Q3)
select sum(F),count(), Browser, Country
from z
group by Browser,Country format Null;
Elapsed: 0.005 sec. Processed 22.43 thousand rows
Emulation of an inverted index using orderby projection
You can create an orderby projection and include all columns of a table, but if a table is very wide it will double the amount of stored data. This example demonstrate a trick, we create an orderby projection and include primary key columns and the target column and sort by the target column. This allows using subquery to find primary key values
and after that to query the table using the primary key.
CREATE TABLE test_a
(
    `src` String,
    `dst` String,
    `other_cols` String,
    PROJECTION p1
    (
        SELECT
            src,
            dst
        ORDER BY dst
    )
)
ENGINE = MergeTree
ORDER BY src;

insert into test_a select number, -number, 'other_col '||toString(number) from numbers(1e8);

select * from test_a where src='42';
┌─src─┬─dst─┬─other_cols───┐
│ 42  │ -42 │ other_col 42 │
└─────┴─────┴──────────────┘
1 row in set. Elapsed: 0.005 sec. Processed 16.38 thousand rows, 988.49 KB (3.14 million rows/s., 189.43 MB/s.)


select * from test_a where dst='-42';
┌─src─┬─dst─┬─other_cols───┐
│ 42  │ -42 │ other_col 42 │
└─────┴─────┴──────────────┘
1 row in set. Elapsed: 0.625 sec. Processed 100.00 million rows, 1.79 GB (160.05 million rows/s., 2.86 GB/s.)

-- optimization using projection
select * from test_a where src in (select src from test_a where dst='-42') and dst='-42';
┌─src─┬─dst─┬─other_cols───┐
│ 42  │ -42 │ other_col 42 │
└─────┴─────┴──────────────┘
1 row in set. Elapsed: 0.013 sec. Processed 32.77 thousand rows, 660.75 KB (2.54 million rows/s., 51.26 MB/s.)
Elapsed: 0.625 sec. Processed 100.00 million rows – not optimized
VS
Elapsed: 0.013 sec. Processed 32.77 thousand rows – optimized
17 - Cumulative Anything
Sample data
CREATE TABLE events
(
    `ts` DateTime,
    `user_id` UInt32
)
ENGINE = Memory;

INSERT INTO events SELECT
    toDateTime('2021-04-29 10:10:10') + toIntervalHour(7 * number) AS ts,
    toDayOfWeek(ts) + (number % 2) AS user_id
FROM numbers(15);
Using window functions (starting from ClickHouse® 21.3)
SELECT
    toStartOfDay(ts) AS ts,
    uniqExactMerge(uniqExactState(user_id)) OVER (ORDER BY ts ASC ROWS BETWEEN UNBOUNDED PRECEDING AND CURRENT ROW) AS uniq
FROM events
GROUP BY ts
ORDER BY ts ASC

┌──────────────────ts─┬─uniq─┐
│ 2021-04-29 00:00:00 │    2 │
│ 2021-04-30 00:00:00 │    3 │
│ 2021-05-01 00:00:00 │    4 │
│ 2021-05-02 00:00:00 │    5 │
│ 2021-05-03 00:00:00 │    7 │
└─────────────────────┴──────┘

SELECT
    ts,
    uniqExactMerge(state) OVER (ORDER BY ts ASC ROWS BETWEEN UNBOUNDED PRECEDING AND CURRENT ROW) AS uniq
FROM
(
    SELECT
        toStartOfDay(ts) AS ts,
        uniqExactState(user_id) AS state
    FROM events
    GROUP BY ts
)
ORDER BY ts ASC

┌──────────────────ts─┬─uniq─┐
│ 2021-04-29 00:00:00 │    2 │
│ 2021-04-30 00:00:00 │    3 │
│ 2021-05-01 00:00:00 │    4 │
│ 2021-05-02 00:00:00 │    5 │
│ 2021-05-03 00:00:00 │    7 │
└─────────────────────┴──────┘
Using arrays
WITH
    groupArray(_ts) AS ts_arr,
    groupArray(state) AS state_arr
SELECT
    arrayJoin(ts_arr) AS ts,
    arrayReduce('uniqExactMerge', arrayFilter((x, y) -> (y <= ts), state_arr, ts_arr)) AS uniq
FROM
(
    SELECT
        toStartOfDay(ts) AS _ts,
        uniqExactState(user_id) AS state
    FROM events
    GROUP BY _ts
)
ORDER BY ts ASC

┌──────────────────ts─┬─uniq─┐
│ 2021-04-29 00:00:00 │    2 │
│ 2021-04-30 00:00:00 │    3 │
│ 2021-05-01 00:00:00 │    4 │
│ 2021-05-02 00:00:00 │    5 │
│ 2021-05-03 00:00:00 │    7 │
└─────────────────────┴──────┘

WITH arrayJoin(range(toUInt32(_ts) AS int, least(int + toUInt32((3600 * 24) * 5), toUInt32(toDateTime('2021-05-04 00:00:00'))), 3600 * 24)) AS ts_expanded
SELECT
    toDateTime(ts_expanded) AS ts,
    uniqExactMerge(state) AS uniq
FROM
(
    SELECT
        toStartOfDay(ts) AS _ts,
        uniqExactState(user_id) AS state
    FROM events
    GROUP BY _ts
)
GROUP BY ts
ORDER BY ts ASC

┌──────────────────ts─┬─uniq─┐
│ 2021-04-29 00:00:00 │    2 │
│ 2021-04-30 00:00:00 │    3 │
│ 2021-05-01 00:00:00 │    4 │
│ 2021-05-02 00:00:00 │    5 │
│ 2021-05-03 00:00:00 │    7 │
└─────────────────────┴──────┘
Using runningAccumulate (incorrect result over blocks)
SELECT
    ts,
    runningAccumulate(state) AS uniq
FROM
(
    SELECT
        toStartOfDay(ts) AS ts,
        uniqExactState(user_id) AS state
    FROM events
    GROUP BY ts
    ORDER BY ts ASC
)
ORDER BY ts ASC

┌──────────────────ts─┬─uniq─┐
│ 2021-04-29 00:00:00 │    2 │
│ 2021-04-30 00:00:00 │    3 │
│ 2021-05-01 00:00:00 │    4 │
│ 2021-05-02 00:00:00 │    5 │
│ 2021-05-03 00:00:00 │    7 │
└─────────────────────┴──────┘
18 - Data types on disk and in RAM
| DataType | RAM size (=byteSize) | Disk Size |
|---|---|---|
| String | string byte length + 9 string length: 64 bit integer zero-byte terminator: 1 byte. | string length prefix (varint) + string itself:
|
| AggregateFunction(count, ...) | varint |
See also the presentation Data processing into ClickHouse® , especially slides 17-22.
19 - DELETE via tombstone column
This article provides an overview of the different methods to handle row deletion in ClickHouse, using tombstone columns and ALTER UPDATE or DELETE. The goal is to highlight the performance impacts of different techniques and storage settings, including a scenario using S3 for remote storage.
- Creating a Test Table We will start by creating a simple MergeTree table with a tombstone column (is_active) to track active rows:
CREATE TABLE test_delete
(
    `key` UInt32,
    `ts` UInt32,
    `value_a` String,
    `value_b` String,
    `value_c` String,
    `is_active` UInt8 DEFAULT 1
)
ENGINE = MergeTree
ORDER BY key;
- Inserting Data Insert sample data into the table:
INSERT INTO test_delete (key, ts, value_a, value_b, value_c) SELECT
    number,
    1,
    concat('some_looong_string', toString(number)),
    concat('another_long_str', toString(number)),
    concat('string', toString(number))
FROM numbers(10000000);


INSERT INTO test_delete (key, ts, value_a, value_b, value_c) VALUES (400000, 2, 'totally different string', 'another totally different string', 'last string');
- Querying the Data To verify the inserted data:
SELECT *
FROM test_delete
WHERE key = 400000;

┌────key─┬─ts─┬─value_a──────────────────┬─value_b──────────────────────────┬─value_c─────┬─is_active─┐
│ 400000 │  2 │ totally different string │ another totally different string │ last string │         1 │
└────────┴────┴──────────────────────────┴──────────────────────────────────┴─────────────┴───────────┘
┌────key─┬─ts─┬─value_a──────────────────┬─value_b────────────────┬─value_c──────┬─is_active─┐
│ 400000 │  1 │ some_looong_string400000 │ another_long_str400000 │ string400000 │         1 │
└────────┴────┴──────────────────────────┴────────────────────────┴──────────────┴───────────┘
This should return two rows with different ts values.
- Soft Deletion Using ALTER UPDATE Instead of deleting a row, you can mark it as inactive by setting is_active to 0:
SET mutations_sync = 2;

ALTER TABLE test_delete
    UPDATE is_active = 0 WHERE (key = 400000) AND (ts = 1);
Ok.

0 rows in set. Elapsed: 0.058 sec.
After updating, you can filter out inactive rows:
SELECT *
FROM test_delete
WHERE (key = 400000) AND is_active=0;

┌────key─┬─ts─┬─value_a──────────────────┬─value_b────────────────┬─value_c──────┬─is_active─┐
│ 400000 │  1 │ some_looong_string400000 │ another_long_str400000 │ string400000 │         0 │
└────────┴────┴──────────────────────────┴────────────────────────┴──────────────┴───────────┘
- Hard Deletion Using ALTER DELETE If you need to completely remove a row from the table, you can use ALTER DELETE:
ALTER TABLE test_delete
    DELETE WHERE (key = 400000) AND (ts = 1);

Ok.

0 rows in set. Elapsed: 1.101 sec. -- 20 times slower!!!
However, this operation is significantly slower compared to the ALTER UPDATE approach. For example:
ALTER DELETE: Takes around 1.1 seconds ALTER UPDATE: Only 0.05 seconds
The reason for this difference is that DELETE modifies the physical data structure, while UPDATE merely changes a column value.
SELECT *
FROM test_delete
WHERE key = 400000;

┌────key─┬─ts─┬─value_a──────────────────┬─value_b──────────────────────────┬─value_c─────┬─is_active─┐
│ 400000 │  2 │ totally different string │ another totally different string │ last string │         1 │
└────────┴────┴──────────────────────────┴──────────────────────────────────┴─────────────┴───────────┘

-- For ReplacingMergeTree -> https://clickhouse.com/docs/en/engines/table-engines/mergetree-family/replacingmergetree

OPTIMIZE TABLE test_delete FINAL;

Ok.

0 rows in set. Elapsed: 2.230 sec. -- 40 times slower!!!

SELECT *
FROM test_delete
WHERE key = 400000

┌────key─┬─ts─┬─value_a──────────────────┬─value_b──────────────────────────┬─value_c─────┬─is_active─┐
│ 400000 │  2 │ totally different string │ another totally different string │ last string │         1 │
└────────┴────┴──────────────────────────┴──────────────────────────────────┴─────────────┴───────────┘
Soft Deletion (via ALTER UPDATE): A quicker approach that does not involve physical data deletion but rather updates the tombstone column. Hard Deletion (via ALTER DELETE): Can take significantly longer, especially with large datasets stored in remote storage like S3.
- Optimizing for Faster Deletion with S3 Storage If using S3 for storage, the DELETE operation becomes even slower due to the overhead of handling remote data. Here’s an example with a table using S3-backed storage:
CREATE TABLE test_delete
(
    `key` UInt32,
    `value_a` String,
    `value_b` String,
    `value_c` String,
    `is_deleted` UInt8 DEFAULT 0
)
ENGINE = MergeTree
ORDER BY key
SETTINGS storage_policy = 's3tiered';

INSERT INTO test_delete (key, value_a, value_b, value_c) SELECT
    number,
    concat('some_looong_string', toString(number)),
    concat('another_long_str', toString(number)),
    concat('really long string', toString(arrayMap(i -> cityHash64(i*number), range(50))))
FROM numbers(10000000);

OPTIMIZE TABLE test_delete FINAL;

ALTER TABLE test_delete MOVE PARTITION tuple() TO DISK 's3disk';

SELECT count() FROM test_delete;
┌──count()─┐
│ 10000000 │
└──────────┘
1 row in set. Elapsed: 0.002 sec.
- DELETE Using ALTER UPDATE and Row Policy You can also control visibility at the query level using row policies. For example, to only show rows where is_active = 1:
To delete a row using ALTER UPDATE:
CREATE ROW POLICY pol1 ON test_delete USING is_active=1 TO all;

SELECT count() FROM test_delete;  -- select count() became much slower, it reads data now, not metadata
┌──count()─┐
│ 10000000 │
└──────────┘
1 row in set. Elapsed: 0.314 sec. Processed 10.00 million rows, 10.00 MB (31.84 million rows/s., 31.84 MB/s.)

ALTER TABLE test_delete UPDATE is_active = 0 WHERE (key = 400000) settings mutations_sync = 2;
0 rows in set. Elapsed: 1.256 sec.

SELECT count() FROM test_delete;
┌─count()─┐
│ 9999999 │
└─────────┘
This impacts the performance of queries like SELECT count(), as ClickHouse now needs to scan data instead of reading metadata.
- DELETE Using ALTER DELETE - https://clickhouse.com/docs/en/sql-reference/statements/alter/delete To delete a row using ALTER DELETE:
ALTER TABLE test_delete DELETE WHERE (key = 400001) settings mutations_sync = 2;
0 rows in set. Elapsed: 955.672 sec.

SELECT count() FROM test_delete;
┌─count()─┐
│ 9999998 │
└─────────┘
This operation may take significantly longer compared to soft deletions (around 955 seconds in this example for large datasets):
- DELETE Using DELETE Statement - https://clickhouse.com/docs/en/sql-reference/statements/delete The DELETE statement can also be used to remove data from a table:
DELETE FROM test_delete WHERE (key = 400002);
0 rows in set. Elapsed: 1.281 sec.

SELECT count() FROM test_delete;
┌─count()─┐
│ 9999997 │
└─────────┘
This operation is faster, with an elapsed time of around 1.28 seconds in this case:
The choice between ALTER UPDATE and ALTER DELETE depends on your use case. For soft deletes, updating a tombstone column is significantly faster and easier to manage. However, if you need to physically remove rows, be mindful of the performance costs, especially with remote storage like S3.
20 - EXPLAIN query
EXPLAIN types
EXPLAIN AST
        SYNTAX
        PLAN indexes = 0,
             header = 0,
             description = 1,
             actions = 0,
             optimize = 1
             json = 0
        PIPELINE header = 0,
                 graph = 0,
                 compact = 1
        ESTIMATE
SELECT ...
AST- abstract syntax treeSYNTAX- query text after AST-level optimizationsPLAN- query execution planPIPELINE- query execution pipelineESTIMATE- See Estimates for select query , available since ClickHouse® 21.9indexes=1supported starting from 21.6 (https://github.com/ClickHouse/ClickHouse/pull/22352 )json=1supported starting from 21.6 (https://github.com/ClickHouse/ClickHouse/pull/23082 )
References
- https://clickhouse.com/docs/en/sql-reference/statements/explain/
- Nikolai Kochetov from Yandeх. EXPLAIN query in ClickHouse. slides , video
- https://github.com/ClickHouse/clickhouse-presentations/blob/master/meetup39/query-profiling.pdf
- https://github.com/ClickHouse/ClickHouse/issues/28847
21 - Fill missing values at query time
CREATE TABLE event_table
(
    `key` UInt32,
    `created_at` DateTime,
    `value_a` UInt32,
    `value_b` String
)
ENGINE = MergeTree
ORDER BY (key, created_at)

INSERT INTO event_table SELECT
    1 AS key,
    toDateTime('2020-10-11 10:10:10') + number AS created_at,
    if((number = 0) OR ((number % 5) = 1), number + 1, 0) AS value_a,
    if((number = 0) OR ((number % 3) = 1), toString(number), '') AS value_b
FROM numbers(10)

SELECT
    main.key,
    main.created_at,
    a.value_a,
    b.value_b
FROM event_table AS main
ASOF INNER JOIN
(
    SELECT
        key,
        created_at,
        value_a
    FROM event_table
    WHERE value_a != 0
) AS a ON (main.key = a.key) AND (main.created_at >= a.created_at)
ASOF INNER JOIN
(
    SELECT
        key,
        created_at,
        value_b
    FROM event_table
    WHERE value_b != ''
) AS b ON (main.key = b.key) AND (main.created_at >= b.created_at)

┌─main.key─┬─────main.created_at─┬─a.value_a─┬─b.value_b─┐
│        1 │ 2020-10-11 10:10:10 │         1 │ 0         │
│        1 │ 2020-10-11 10:10:11 │         2 │ 1         │
│        1 │ 2020-10-11 10:10:12 │         2 │ 1         │
│        1 │ 2020-10-11 10:10:13 │         2 │ 1         │
│        1 │ 2020-10-11 10:10:14 │         2 │ 4         │
│        1 │ 2020-10-11 10:10:15 │         2 │ 4         │
│        1 │ 2020-10-11 10:10:16 │         7 │ 4         │
│        1 │ 2020-10-11 10:10:17 │         7 │ 7         │
│        1 │ 2020-10-11 10:10:18 │         7 │ 7         │
│        1 │ 2020-10-11 10:10:19 │         7 │ 7         │
└──────────┴─────────────────────┴───────────┴───────────┘

SELECT
    key,
    created_at,
    value_a,
    value_b
FROM
(
    SELECT
        key,
        groupArray(created_at) AS created_arr,
        arrayFill(x -> (x != 0), groupArray(value_a)) AS a_arr,
        arrayFill(x -> (x != ''), groupArray(value_b)) AS b_arr
    FROM
    (
        SELECT *
        FROM event_table
        ORDER BY
            key ASC,
            created_at ASC
    )
    GROUP BY key
)
ARRAY JOIN
    created_arr AS created_at,
    a_arr AS value_a,
    b_arr AS value_b

┌─key─┬──────────created_at─┬─value_a─┬─value_b─┐
│   1 │ 2020-10-11 10:10:10 │       1 │ 0       │
│   1 │ 2020-10-11 10:10:11 │       2 │ 1       │
│   1 │ 2020-10-11 10:10:12 │       2 │ 1       │
│   1 │ 2020-10-11 10:10:13 │       2 │ 1       │
│   1 │ 2020-10-11 10:10:14 │       2 │ 4       │
│   1 │ 2020-10-11 10:10:15 │       2 │ 4       │
│   1 │ 2020-10-11 10:10:16 │       7 │ 4       │
│   1 │ 2020-10-11 10:10:17 │       7 │ 7       │
│   1 │ 2020-10-11 10:10:18 │       7 │ 7       │
│   1 │ 2020-10-11 10:10:19 │       7 │ 7       │
└─────┴─────────────────────┴─────────┴─────────┘
22 - FINAL clause speed
SELECT * FROM table FINAL
History
- Before ClickHouse® 20.5 - always executed in a single thread and slow.
- Since 20.5 - final can be parallel, see https://github.com/ClickHouse/ClickHouse/pull/10463
- Since 20.10 - you can use
do_not_merge_across_partitions_select_finalsetting. See https://github.com/ClickHouse/ClickHouse/pull/15938 and https://github.com/ClickHouse/ClickHouse/issues/11722 - Since 22.6 - final even more parallel, see https://github.com/ClickHouse/ClickHouse/pull/36396
- Since 22.8 - final doesn’t read excessive data, see https://github.com/ClickHouse/ClickHouse/pull/47801
- Since 23.5 - final use less memory, see https://github.com/ClickHouse/ClickHouse/pull/50429
- Since 23.9 - final doesn’t read PK columns if unneeded ie only one part in partition, see https://github.com/ClickHouse/ClickHouse/pull/53919
- Since 23.12 - final applied only for intersecting ranges of parts, see https://github.com/ClickHouse/ClickHouse/pull/58120
- Since 24.1 - final doesn’t compare rows from the same part with level > 0, see https://github.com/ClickHouse/ClickHouse/pull/58142
- Since 24.1 - final use vertical algorithm (more cache friendly), see https://github.com/ClickHouse/ClickHouse/pull/54366
- Since 25.6 - final supports skip indexes (
use_skip_indexes_if_final=1by default) - Since 25.12 -
apply_prewhere_after_finalandapply_row_policy_after_finalsettings for correct PREWHERE/row policy handling with FINAL - Since 26.2 -
enable_automatic_decision_for_merging_across_partitions_for_final=1by default (auto-enables cross-partition optimization when safe)
Partitioning
Proper partition design could speed up FINAL processing.
For example, if you have a table with Daily partitioning, you can:
- After day end + some time interval during which you can get some updates run
OPTIMIZE TABLE xxx PARTITION 'prev_day' FINAL - or add table SETTINGS min_age_to_force_merge_seconds=86400,min_age_to_force_merge_on_partition_only=1
In that case, using FINAL with do_not_merge_across_partitions_select_final will be cheap or even zero.
Example:
DROP TABLE IF EXISTS repl_tbl;
CREATE TABLE repl_tbl
(
`key` UInt32,
`val_1` UInt32,
`val_2` String,
`val_3` String,
`val_4` String,
`val_5` UUID,
`ts` DateTime
)
ENGINE = ReplacingMergeTree(ts)
PARTITION BY toDate(ts)
ORDER BY key;
INSERT INTO repl_tbl SELECT number as key, rand() as val_1, randomStringUTF8(10) as val_2, randomStringUTF8(5) as val_3, randomStringUTF8(4) as val_4, generateUUIDv4() as val_5, '2020-01-01 00:00:00' as ts FROM numbers(10000000);
OPTIMIZE TABLE repl_tbl PARTITION ID '20200101' FINAL;
INSERT INTO repl_tbl SELECT number as key, rand() as val_1, randomStringUTF8(10) as val_2, randomStringUTF8(5) as val_3, randomStringUTF8(4) as val_4, generateUUIDv4() as val_5, '2020-01-02 00:00:00' as ts FROM numbers(10000000);
OPTIMIZE TABLE repl_tbl PARTITION ID '20200102' FINAL;
INSERT INTO repl_tbl SELECT number as key, rand() as val_1, randomStringUTF8(10) as val_2, randomStringUTF8(5) as val_3, randomStringUTF8(4) as val_4, generateUUIDv4() as val_5, '2020-01-03 00:00:00' as ts FROM numbers(10000000);
OPTIMIZE TABLE repl_tbl PARTITION ID '20200103' FINAL;
INSERT INTO repl_tbl SELECT number as key, rand() as val_1, randomStringUTF8(10) as val_2, randomStringUTF8(5) as val_3, randomStringUTF8(4) as val_4, generateUUIDv4() as val_5, '2020-01-04 00:00:00' as ts FROM numbers(10000000);
OPTIMIZE TABLE repl_tbl PARTITION ID '20200104' FINAL;
SYSTEM STOP MERGES repl_tbl;
INSERT INTO repl_tbl SELECT number as key, rand() as val_1, randomStringUTF8(10) as val_2, randomStringUTF8(5) as val_3, randomStringUTF8(4) as val_4, generateUUIDv4() as val_5, '2020-01-05 00:00:00' as ts FROM numbers(10000000);
SELECT count() FROM repl_tbl WHERE NOT ignore(*)
┌──count()─┐
│ 50000000 │
└──────────┘
1 rows in set. Elapsed: 1.504 sec. Processed 50.00 million rows, 6.40 GB (33.24 million rows/s., 4.26 GB/s.)
SELECT count() FROM repl_tbl FINAL WHERE NOT ignore(*)
┌──count()─┐
│ 10000000 │
└──────────┘
1 rows in set. Elapsed: 3.314 sec. Processed 50.00 million rows, 6.40 GB (15.09 million rows/s., 1.93 GB/s.)
/* more that 2 time slower, and will get worse once you will have more data */
set do_not_merge_across_partitions_select_final=1;
SELECT count() FROM repl_tbl FINAL WHERE NOT ignore(*)
┌──count()─┐
│ 50000000 │
└──────────┘
1 rows in set. Elapsed: 1.850 sec. Processed 50.00 million rows, 6.40 GB (27.03 million rows/s., 3.46 GB/s.)
/* only 0.35 sec slower, and while partitions have about the same size that extra cost will be about constant */
Since 26.2, enable_automatic_decision_for_merging_across_partitions_for_final=1 (default) auto-enables this when partition key columns are included in PRIMARY KEY
Light ORDER BY
All columns specified in ORDER BY will be read during FINAL processing, creating additional disk load. Use fewer columns and lighter column types to create faster queries.
Example: UUID vs UInt64
CREATE TABLE uuid_table (id UUID, value UInt64)    ENGINE = ReplacingMergeTree() ORDER BY id;
CREATE TABLE uint64_table (id UInt64,value UInt64) ENGINE = ReplacingMergeTree() ORDER BY id;

INSERT INTO uuid_table SELECT generateUUIDv4(), number FROM numbers(5E7);
INSERT INTO uint64_table SELECT number, number         FROM numbers(5E7);

SELECT sum(value) FROM uuid_table   FINAL format JSON;
SELECT sum(value) FROM uint64_table FINAL format JSON;
Results :
		"elapsed": 0.58738197,
		"rows_read": 50172032,
		"bytes_read": 1204128768

		"elapsed": 0.189792142,
		"rows_read": 50057344,
		"bytes_read": 480675040
Vertical FINAL Algorithm (24.1+)
When enable_vertical_final=1 (default since 24.1), ClickHouse uses a different deduplication strategy:
- Marks duplicate rows as deleted instead of merging them immediately
- Filters deleted rows in a later processing step
- Reads different columns from different parts in parallel
This improves performance for queries that read only a subset of columns, as non-ORDER BY columns can be read independently from different parts.
PREWHERE and Row Policies with FINAL (25.12+)
By default, PREWHERE and row policies are applied before FINAL deduplication. This can cause incorrect results when:
- PREWHERE references columns that differ across duplicate rows
- Row policies should filter based on the “winning” row values after deduplication
Use these settings when needed:
apply_prewhere_after_final=1- Apply PREWHERE after deduplicationapply_row_policy_after_final=1- Apply row policies after deduplication
Example problem: if you have ReplacingMergeTree with a deleted column and PREWHERE filters on it, without apply_prewhere_after_final=1 you may get wrong results because PREWHERE sees rows before FINAL picks the winner.
FINAL with skip indexes:
- Both
use_skip_indexes_if_finalanduse_skip_indexes_if_final_exact_modeare enabled by default since 25.6 - Skip indexes on PRIMARY KEY columns have lower overhead (no extra rescan needed since 26.1), see https://github.com/ClickHouse/ClickHouse/pull/78350
Settings reference
| Setting | Default | Since | Description |
|---|---|---|---|
do_not_merge_across_partitions_select_final | 0 | 20.10 | Skip cross-partition merging when partitions are pre-optimized |
max_final_threads | 0 (auto) | 20.5 | Thread limit for FINAL processing |
enable_vertical_final | 1 | 24.1 | Read columns in parallel from different parts |
use_skip_indexes_if_final | 1 | 25.6 | Allow skip indexes with FINAL |
use_skip_indexes_if_final_exact_mode | 1 | 25.6 | Rescan newer parts to ensure correctness with skip indexes |
apply_prewhere_after_final | 0 | 25.12 | Apply PREWHERE after deduplication (needed when PREWHERE references non-PK columns) |
enable_automatic_decision_for_merging_across_partitions_for_final | 1 | 26.2 | Auto-enable do_not_merge_across_partitions_select_final when partition key is in PK |
23 - Join with Calendar using Arrays
Sample data
CREATE TABLE test_metrics (counter_id Int64, timestamp DateTime, metric UInt64)
Engine=Log;

INSERT INTO test_metrics SELECT number % 3,
    toDateTime('2021-01-01 00:00:00'), 1
FROM numbers(20);

INSERT INTO test_metrics SELECT number % 3,
    toDateTime('2021-01-03 00:00:00'), 1
FROM numbers(20);

SELECT counter_id, toDate(timestamp) dt, sum(metric)
FROM test_metrics
GROUP BY counter_id, dt
ORDER BY counter_id, dt;

┌─counter_id─┬─────────dt─┬─sum(metric)─┐
│          0 │ 2021-01-01 │           7 │
│          0 │ 2021-01-03 │           7 │
│          1 │ 2021-01-01 │           7 │
│          1 │ 2021-01-03 │           7 │
│          2 │ 2021-01-01 │           6 │
│          2 │ 2021-01-03 │           6 │
└────────────┴────────────┴─────────────┘
Calendar
WITH arrayMap(i -> (toDate('2021-01-01') + i), range(4)) AS Calendar
SELECT arrayJoin(Calendar);

┌─arrayJoin(Calendar)─┐
│          2021-01-01 │
│          2021-01-02 │
│          2021-01-03 │
│          2021-01-04 │
└─────────────────────┘
Join with Calendar using arrayJoin
SELECT counter_id, tuple.2 dt, sum(tuple.1) sum FROM
  (
  WITH arrayMap(i -> (0, toDate('2021-01-01') + i), range(4)) AS Calendar
   SELECT counter_id, arrayJoin(arrayConcat(Calendar, [(sum, dt)])) tuple
   FROM
             (SELECT counter_id, toDate(timestamp) dt, sum(metric) sum
              FROM test_metrics
              GROUP BY counter_id, dt)
  ) GROUP BY counter_id, dt
    ORDER BY counter_id, dt;

┌─counter_id─┬─────────dt─┬─sum─┐
│          0 │ 2021-01-01 │   7 │
│          0 │ 2021-01-02 │   0 │
│          0 │ 2021-01-03 │   7 │
│          0 │ 2021-01-04 │   0 │
│          1 │ 2021-01-01 │   7 │
│          1 │ 2021-01-02 │   0 │
│          1 │ 2021-01-03 │   7 │
│          1 │ 2021-01-04 │   0 │
│          2 │ 2021-01-01 │   6 │
│          2 │ 2021-01-02 │   0 │
│          2 │ 2021-01-03 │   6 │
│          2 │ 2021-01-04 │   0 │
└────────────┴────────────┴─────┘
With fill
SELECT
    counter_id,
    toDate(timestamp) AS dt,
    sum(metric) AS sum
FROM test_metrics
GROUP BY
    counter_id,
    dt
ORDER BY
    counter_id ASC WITH FILL,
    dt ASC WITH FILL FROM toDate('2021-01-01') TO toDate('2021-01-05');

┌─counter_id─┬─────────dt─┬─sum─┐
│          0 │ 2021-01-01 │   7 │
│          0 │ 2021-01-02 │   0 │
│          0 │ 2021-01-03 │   7 │
│          0 │ 2021-01-04 │   0 │
│          1 │ 2021-01-01 │   7 │
│          1 │ 2021-01-02 │   0 │
│          1 │ 2021-01-03 │   7 │
│          1 │ 2021-01-04 │   0 │
│          2 │ 2021-01-01 │   6 │
│          2 │ 2021-01-02 │   0 │
│          2 │ 2021-01-03 │   6 │
│          2 │ 2021-01-04 │   0 │
└────────────┴────────────┴─────┘
24 - JOINs
Resources:
- Overview of JOINs (Russian) - Presentation from Meetup 38 in 2019
- Notes on JOIN options
Join Table Engine
The main purpose of JOIN table engine is to avoid building the right table for joining on each query execution. So it’s usually used when you have a high amount of fast queries which share the same right table for joining.
Updates
It’s possible to update rows with setting join_any_take_last_row enabled.
CREATE TABLE id_val_join
(
    `id` UInt32,
    `val` UInt8
)
ENGINE = Join(ANY, LEFT, id)
SETTINGS join_any_take_last_row = 1

Ok.

INSERT INTO id_val_join VALUES (1,21)(1,22)(3,23);

Ok.

SELECT *
FROM
(
    SELECT toUInt32(number) AS id
    FROM numbers(4)
) AS n
ANY LEFT JOIN id_val_join USING (id)

┌─id─┬─val─┐
│  0 │   0 │
│  1 │  22 │
│  2 │   0 │
│  3 │  23 │
└────┴─────┘

INSERT INTO id_val_join VALUES (1,40)(2,24);

Ok.

SELECT *
FROM
(
    SELECT toUInt32(number) AS id
    FROM numbers(4)
) AS n
ANY LEFT JOIN id_val_join USING (id)

┌─id─┬─val─┐
│  0 │   0 │
│  1 │  40 │
│  2 │  24 │
│  3 │  23 │
└────┴─────┘
24.1 - JOIN optimization tricks
All tests below were done with default hash join. ClickHouse joins are evolving rapidly and behavior varies with other join types.
Data
For our exercise, we will use two tables from a well known TPS-DS benchmark: store_sales and customer. Table sizes are the following:
store_sales = 2 billion rows customer = 12 millions rows
So there are 200 rows in store_sales table per each customer on average. Also 90% of customers made 1-10 purchases.
Schema example:
CREATE TABLE store_sales
(
	`ss_sold_time_sk` DateTime,
	`ss_sold_date_sk` Date,
	`ss_ship_date_sk` Date,
	`ss_item_sk` UInt32,
	`ss_customer_sk` UInt32,
	`ss_cdemo_sk` UInt32,
	`ss_hdemo_sk` UInt32,
	`ss_addr_sk` UInt32,
	`ss_store_sk` UInt32,
	`ss_promo_sk` UInt32,
	`ss_ticket_number` UInt32,
	`ss_quantity` UInt32,
	`ss_wholesale_cost` Float64,
	`ss_list_price` Float64,
	`ss_sales_price` Float64,
	`ss_ext_discount_amt` Float64,
	`ss_ext_sales_price` Float64,
	`ss_ext_wholesale_cost` Float64,
	`ss_ext_list_price` Float64,
	`ss_ext_tax` Float64,
	`ss_coupon_amt` Float64,
	`ss_net_paid` Float64,
	`ss_net_paid_inc_tax` Float64,
	`ss_net_profit` Float64
)
ENGINE = MergeTree
ORDER BY ss_ticket_number

CREATE TABLE customer
(
	`c_customer_sk` UInt32,
	`c_current_addr_sk` UInt32,
	`c_first_shipto_date_sk` Date,
	`c_first_sales_date_sk` Date,
	`c_salutation` String,
	`c_c_first_name` String,
	`c_last_name` String,
	`c_preferred_cust_flag` String,
	`c_birth_date` Date,
	`c_birth_country` String,
	`c_login` String,
	`c_email_address` String,
	`c_last_review_date` Date
)
ENGINE = MergeTree
ORDER BY c_customer_id
Target query
SELECT
	sumIf(ss_sales_price, customer.c_first_name = 'James') AS sum_James,
	sumIf(ss_sales_price, customer.c_first_name = 'Lisa') AS sum_Lisa,
	sum(ss_sales_price) AS sum_total
FROM store_sales
INNER JOIN customer ON store_sales.ss_customer_sk = customer.c_customer_sk
Baseline performance
SELECT
	sumIf(ss_sales_price, customer.c_first_name = 'James') AS sum_James,
	sumIf(ss_sales_price, customer.c_first_name = 'Lisa') AS sum_Lisa,
	sum(ss_sales_price) AS sum_total
FROM store_sales
INNER JOIN customer ON store_sales.ss_customer_sk = customer.c_customer_sk

0 rows in set. Elapsed: 188.384 sec. Processed 2.89 billion rows, 40.60 GB (15.37 million rows/s., 216.92 MB/s.)
Manual pushdown of conditions
If we look at our query, we only care if sale belongs to customer named James or Lisa and dont care for rest of cases. We can use that.
Usually, ClickHouse is able to pushdown conditions, but not in that case, when conditions itself part of function expression, so you can manually help in those cases.
SELECT
      sumIf(ss_sales_price, customer.c_first_name = 'James') as sum_James,
    	sumIf(ss_sales_price, customer.c_first_name = 'Lisa') as sum_Lisa,
    	sum(ss_sales_price) as sum_total
FROM store_sales LEFT JOIN (SELECT * FROM customer WHERE c_first_name = 'James' OR c_first_name = 'Lisa') as customer ON store_sales.ss_customer_sk = customer.c_customer_sk

1 row in set. Elapsed: 35.370 sec. Processed 2.89 billion rows, 40.60 GB (81.76 million rows/s., 1.15 GB/s.)
Reduce right table row size
Reduce attribute columns (push expression before JOIN step)
Our row from the right table consists of 2 fields: customer_sk and c_first_name. First one is needed to JOIN by it, so it’s not much we can do here, but we can transform a bit of the second column.
Again, let’s look in how we use this column in main query:
customer.c_first_name = ‘James’ customer.c_first_name = ‘Lisa’
We calculate 2 simple conditions(which don’t have any dependency on data from the left table) and nothing more. It does mean that we can move this calculation to the right table, it will make 3 improvements!
- Right table will be smaller -> smaller RAM usage -> better cache hits
- We will calculate our conditions over a smaller data set. In the right table we have only 10 million rows and after joining because of the left table we have 2 billion rows -> 200 times improvement!
- Our resulting table after JOIN will not have an expensive String column, only 1 byte UInt8 instead -> less copy of data in memory.
Let’s do it:
There are several ways to rewrite that query, let’s not bother with simple once and go straight to most optimized:
Put our 2 conditions in hand-made bitmask:
In order to do that we will take our conditions and multiply them by
(c_first_name = 'James') + (2 * (c_first_name = 'Lisa')

C_first_name	| (c_first_name = 'James') + (2 * (c_first_name = 'Lisa')
   James        |         				00000001
   Lisa        	|         				00000010
As you can see, if you do it in that way, your conditions will not interfere with each other!
But we need to be careful with the wideness of the resulting numeric type.
Let’s write our calculations in type notation:
UInt8 + UInt8*2 -> UInt8 + UInt16 -> UInt32
But we actually do not use more than first 2 bits, so we need to cast this expression back to UInt8
Last thing to do is use the bitTest function in order to get the result of our condition by its position.
And resulting query is:
SELECT
	sumIf(ss_sales_price, bitTest(customer.cond, 0)) AS sum_James,
	sumIf(ss_sales_price, bitTest(customer.cond, 1)) AS sum_Lisa,
	sum(ss_sales_price) AS sum_total
FROM store_sales
LEFT JOIN
(
	SELECT
    	c_customer_sk,
    	((c_first_name = 'James') + (2 * (c_first_name = 'Lisa')))::UInt8 AS cond 	FROM customer
	WHERE (c_first_name = 'James') OR (c_first_name = 'Lisa')
) AS customer ON store_sales.ss_customer_sk = customer.c_customer_sk

1 row in set. Elapsed: 31.699 sec. Processed 2.89 billion rows, 40.60 GB (91.23 million rows/s., 1.28 GB/s.)
Reduce key column size
But can we make something with our JOIN key column?
It’s type is Nullable(UInt64)
Let’s check if we really need to have a 0…18446744073709551615 range for our customer id, it sure looks like that we have much less people on earth than this number. The same about Nullable trait, we don’t care about Nulls in customer_id
SELECT max(c_customer_sk) FROM customer
For sure, we don’t need that wide type. Lets remove Nullable trait and cast column to UInt32, twice smaller in byte size compared to UInt64.
SELECT
	sumIf(ss_sales_price, bitTest(customer.cond, 0)) AS sum_James,
	sumIf(ss_sales_price, bitTest(customer.cond, 1)) AS sum_Lisa,
	sum(ss_sales_price) AS sum_total
FROM store_sales
LEFT JOIN
(
	SELECT
    	CAST(c_customer_sk, 'UInt32') AS c_customer_sk,
    	(c_first_name = 'James') + (2 * (c_first_name = 'Lisa')) AS cond
	FROM customer
	WHERE (c_first_name = 'James') OR (c_first_name = 'Lisa')
) AS customer ON store_sales.ss_customer_sk_nn = customer.c_customer_sk

1 row in set. Elapsed: 27.093 sec. Processed 2.89 billion rows, 26.20 GB (106.74 million rows/s., 967.16 MB/s.)
Another 10% perf improvement from using UInt32 key instead of Nullable(Int64) Looks pretty neat, we almost got 10 times improvement over our initial query. Can we do better?
Probably, but it does mean that we need to get rid of JOIN.
Use IN clause instead of JOIN
Despite that all DBMS support ~ similar feature set, feature performance on different database are different:
Small example, for PostgreSQL, is recommended to replace big IN clauses with JOINs, because IN clauses have bad performance. But for ClickHouse it’s the opposite!, IN works faster than JOIN, because it only checks key existence in HashSet and doesn’t need to extract any data from the right table in IN.
Let’s test that:
SELECT
	sumIf(ss_sales_price, ss_customer_sk IN (
    	SELECT c_customer_sk
    	FROM customer
    	WHERE c_first_name = 'James'
	)) AS sum_James,
	sumIf(ss_sales_price, ss_customer_sk IN (
    	SELECT c_customer_sk
    	FROM customer
    	WHERE c_first_name = 'Lisa'
	)) AS sum_Lisa,
	sum(ss_sales_price) AS sum_total
FROM store_sales

1 row in set. Elapsed: 16.546 sec. Processed 2.90 billion rows, 40.89 GB (175.52 million rows/s., 2.47 GB/s.)
Almost 2 times faster than our previous record with JOIN, what if we will improve the same hint with c_customer_sk key like in JOIN?
SELECT
	sumIf(ss_sales_price, ss_customer_sk_nn IN (
    	SELECT c_customer_sk::UInt32
    	FROM customer
    	WHERE c_first_name = 'James'
	)) AS sum_James,
	sumIf(ss_sales_price, ss_customer_sk_nn IN (
    	SELECT c_customer_sk::UInt32
    	FROM customer
    	WHERE c_first_name = 'Lisa'
	)) AS sum_Lisa,
	sum(ss_sales_price) AS sum_total
FROM store_sales

1 row in set. Elapsed: 12.355 sec. Processed 2.90 billion rows, 26.49 GB (235.06 million rows/s., 2.14 GB/s.)
Another 25% performance!
But, there is one big limitation with IN approach, what if we have more than just 2 conditions?
SELECT
	sumIf(ss_sales_price, ss_customer_sk_nn IN (
    	SELECT c_customer_sk::UInt32
    	FROM customer
    	WHERE c_first_name = 'James'
	)) AS sum_James,
	sumIf(ss_sales_price, ss_customer_sk_nn IN (
    	SELECT c_customer_sk::UInt32
    	FROM customer
    	WHERE c_first_name = 'Lisa'
	)) AS sum_Lisa,
	sumIf(ss_sales_price, ss_customer_sk_nn IN (
    	SELECT c_customer_sk::UInt32
    	FROM customer
    	WHERE c_last_name = 'Smith'
	)) AS sum_Smith,
	sumIf(ss_sales_price, ss_customer_sk_nn IN (
    	SELECT c_customer_sk::UInt32
    	FROM customer
    	WHERE c_last_name = 'Williams'
	)) AS sum_Williams,
	sum(ss_sales_price) AS sum_total
FROM store_sales

1 row in set. Elapsed: 23.690 sec. Processed 2.93 billion rows, 27.06 GB (123.60 million rows/s., 1.14 GB/s.)
Adhoc alternative to Dictionary with FLAT layout
But first is a short introduction. What the hell is a Dictionary with a FLAT layout?
Basically, it’s just a set of Array’s for each attribute where the value position in the attribute array is just a dictionary key For sure it put heavy limitation about what dictionary key could be, but it gives really good advantages:
['Alice','James', 'Robert','John', ...].length = 12mil, Memory usage ~ N*sum(sizeOf(String(N)) + 1)
It’s really small memory usage (good cache hit rate) & really fast key lookups (no complex hash calculation)
So, if it’s that great what are the caveats? First one is that your keys should be ideally autoincremental (with small number of gaps) And for second, lets look in that simple query and write down all calculations:
SELECT sumIf(ss_sales_price, dictGet(...) = 'James')
- Dictionary call (2 billion times)
- String equality check (2 billion times)
Although it’s really efficient in terms of dictGet call and memory usage by Dictionary, it still materializes the String column (memcpy) and we pay a penalty of execution condition on top of such a string column for each row.
But what if we could first calculate our required condition and create such a “Dictionary” ad hoc in query time?
And we can actually do that! But let’s repeat our analysis again:
SELECT sumIf(ss_sales_price, here_lives_unicorns(dictGet(...) = 'James'))
['Alice','James', 'Lisa','James', ...].map(x -> multiIf(x = 'James', 1, x = 'Lisa', 2, 0)) => [0,1,2,1,...].length = 12mil, Memory usage ~ N*sizeOf(UInt8) <- It’s event smaller than FLAT dictionary
And actions:
- String equality check (12 million times)
- Create Array (12 million elements)
- Array call (2 billion times)
- UInt8 equality check (2 billion times)
But what is here_lives_unicorns function, does it exist in ClickHouse?
No, but we can hack it with some array manipulation:
SELECT sumIf(ss_sales_price, arr[customer_id] = 2)

WITH (
    	SELECT groupArray(assumeNotNull((c_first_name = 'James') + (2 * (c_first_name = 'Lisa')))::UInt8)
    	FROM
    	(
        	SELECT *
        	FROM customer
        	ORDER BY c_customer_sk ASC
    	)
	) AS cond
SELECT
	sumIf(ss_sales_price, bitTest(cond[ss_customer_sk], 0)) AS sum_James,
	sumIf(ss_sales_price, bitTest(cond[ss_customer_sk], 1)) AS sum_Lisa,
	sum(ss_sales_price) AS sum_total
FROM store_sales

1 row in set. Elapsed: 13.006 sec. Processed 2.89 billion rows, 40.60 GB (222.36 million rows/s., 3.12 GB/s.)

WITH (
    	SELECT groupArray(assumeNotNull((c_first_name = 'James') + (2 * (c_first_name = 'Lisa')))::UInt8)
    	FROM
    	(
        	SELECT *
        	FROM customer
        	ORDER BY c_customer_sk ASC
    	)
	) AS cond,
	bitTest(cond[ss_customer_sk_nn], 0) AS cond_james,
	bitTest(cond[ss_customer_sk_nn], 1) AS cond_lisa
SELECT
	sumIf(ss_sales_price, cond_james) AS sum_James,
	sumIf(ss_sales_price, cond_lisa) AS sum_Lisa,
	sum(ss_sales_price) AS sum_total
FROM store_sales


1 row in set. Elapsed: 10.054 sec. Processed 2.89 billion rows, 26.20 GB (287.64 million rows/s., 2.61 GB/s.)
20% faster than the IN approach, what if we will have not 2 but 4 such conditions:
WITH (
    	SELECT groupArray(assumeNotNull((((c_first_name = 'James') + (2 * (c_first_name = 'Lisa'))) + (4 * (c_last_name = 'Smith'))) + (8 * (c_last_name = 'Williams')))::UInt8)
    	FROM
    	(
        	SELECT *
        	FROM customer
        	ORDER BY c_customer_sk ASC
    	)
	) AS cond
SELECT
	sumIf(ss_sales_price, bitTest(cond[ss_customer_sk_nn], 0)) AS sum_James,
	sumIf(ss_sales_price, bitTest(cond[ss_customer_sk_nn], 1)) AS sum_Lisa,
	sumIf(ss_sales_price, bitTest(cond[ss_customer_sk_nn], 2)) AS sum_Smith,
	sumIf(ss_sales_price, bitTest(cond[ss_customer_sk_nn], 3)) AS sum_Williams,
	sum(ss_sales_price) AS sum_total
FROM store_sales

1 row in set. Elapsed: 11.454 sec. Processed 2.89 billion rows, 26.39 GB (252.49 million rows/s., 2.30 GB/s.)
As we can see, that Array approach doesn’t even notice that we increased the amount of conditions by 2 times.
25 - JSONExtract to parse many attributes at a time
Don’t use several JSONExtract for parsing big JSON. It’s very ineffective, slow, and consumes CPU. Try to use one JSONExtract to parse String to Tupes and next get the needed elements:
WITH JSONExtract(json, 'Tuple(name String, id String, resources Nested(description String, format String, tracking_summary Tuple(total UInt32, recent UInt32)), extras Nested(key String, value String))') AS parsed_json
SELECT
    tupleElement(parsed_json, 'name') AS name,
    tupleElement(parsed_json, 'id') AS id,
    tupleElement(tupleElement(parsed_json, 'resources'), 'description') AS `resources.description`,
    tupleElement(tupleElement(parsed_json, 'resources'), 'format') AS `resources.format`,
    tupleElement(tupleElement(tupleElement(parsed_json, 'resources'), 'tracking_summary'), 'total') AS `resources.tracking_summary.total`,
    tupleElement(tupleElement(tupleElement(parsed_json, 'resources'), 'tracking_summary'), 'recent') AS `resources.tracking_summary.recent`
FROM url('https://raw.githubusercontent.com/jsonlines/guide/master/datagov100.json', 'JSONAsString', 'json String')
However, such parsing requires static schema - all keys should be presented in every row, or you will get an empty structure. More dynamic parsing requires several JSONExtract invocations, but still - try not to scan the same data several times:
WITH
    '{"timestamp":"2024-06-12T14:30:00.001Z","functionality":"DOCUMENT","flowId":"210abdee-6de5-474a-83da-748def0facc1","step":"BEGIN","env":"dev","successful":true,"data":{"action":"initiate_view","stats":{"total":1,"success":1,"failed":0},"client_ip":"192.168.1.100","client_port":"8080"}}' AS json,
    JSONExtractKeysAndValues(json, 'String') AS m,
    mapFromArrays(m.1, m.2) AS p
SELECT
    extractKeyValuePairs(p['data'])['action'] AS data,
    (p['successful']) = 'true' AS successful
FORMAT Vertical

/*
Row 1:
──────
data:       initiate_view
successful: 1
*/
A good approach to get a proper schema from a json message is to let clickhouse-local schema inference do the job:
$ ls example_message.json
example_message.json

$ clickhouse-local --query="DESCRIBE file('example_message.json', 'JSONEachRow')" --format="Vertical";

Row 1:
──────
name:               resourceLogs
type:               Array(Tuple(
    resource Nullable(String),
    scopeLogs Array(Tuple(
        logRecords Array(Tuple(
            attributes Array(Tuple(
                key Nullable(String),
                value Tuple(
                    stringValue Nullable(String)))),
            body Tuple(
                stringValue Nullable(String)),
            observedTimeUnixNano Nullable(String),
            spanId Nullable(String),
            traceId Nullable(String))),
        scope Nullable(String)))))
For very subnested dynamic JSON files, if you don’t need all the keys, you could parse sublevels specifically. Still this will require several JSONExtract calls but each call will have less data to parse so complexity will be reduced for each pass: O(log n)
CREATE TABLE better_parsing (json String) ENGINE = Memory;
INSERT INTO better_parsing FORMAT JSONAsString {"timestamp":"2024-06-12T14:30:00.001Z","functionality":"DOCUMENT","flowId":"210abdee-6de5-474a-83da-748def0facc1","step":"BEGIN","env":"dev","successful":true,"data":{"action":"initiate_view","stats":{"total":1,"success":1,"failed":0},"client_ip":"192.168.1.100","client_port":"8080"}}

WITH parsed_content AS
    (
      SELECT
        JSONExtractKeysAndValues(json, 'String') AS 1st_level_arr,
        mapFromArrays(1st_level_arr.1, 1st_level_arr.2) AS 1st_level_map,
        JSONExtractKeysAndValues(1st_level_map['data'], 'String') AS 2nd_level_arr,
        mapFromArrays(2nd_level_arr.1, 2nd_level_arr.2) AS 2nd_level_map,
        JSONExtractKeysAndValues(2nd_level_map['stats'], 'String') AS 3rd_level_arr,
        mapFromArrays(3rd_level_arr.1, 3rd_level_arr.2) AS 3rd_level_map
      FROM json_tests.better_parsing
    )
SELECT
  1st_level_map['timestamp'] AS timestamp,
  2nd_level_map['action'] AS action,
  3rd_level_map['total'] AS total
  3rd_level_map['nokey'] AS no_key_empty
FROM parsed_content

/*
   ┌─timestamp────────────────┬─action────────┬─total─┬─no_key_empty─┐
1. │ 2024-06-12T14:30:00.001Z │ initiate_view │ 1     │              │
   └──────────────────────────┴───────────────┴───────┴──────────────┘

1 row in set. Elapsed: 0.003 sec.
*/
26 - KILL QUERY
Unfortunately not all queries can be killed.
KILL QUERY only sets a flag that must be checked by the query.
A query pipeline is checking this flag before a switching to next block. If the pipeline has stuck somewhere in the middle it cannot be killed.
If a query does not stop, the only way to get rid of it is to restart ClickHouse®.
See also:
- https://github.com/ClickHouse/ClickHouse/issues/3964
- https://github.com/ClickHouse/ClickHouse/issues/1576
How to replace a running query
Q. We are trying to abort running queries when they are being replaced with a new one. We are setting the same query id for this. In some cases this error happens:
Query with id = e213cc8c-3077-4a6c-bc78-e8463adad35d is already running and can’t be stopped
The query is still being killed but the new one is not being executed. Do you know anything about this and if there is a fix or workaround for it?
I guess you use replace_running_query + replace_running_query_max_wait_ms.
Unfortunately it’s not always possible to kill the query at random moment of time.
Kill don’t send any signals, it just set a flag. Which gets (synchronously) checked at certain moments of query execution, mostly after finishing processing one block and starting another.
On certain stages (executing scalar sub-query) the query can not be killed at all. This is a known issue and requires an architectural change to fix it.
I see. Is there a workaround?
This is our use case:
A user requests an analytics report which has a query that takes several settings, the user makes changes to the report (e.g. to filters, metrics, dimensions…). Since the user changed what he is looking for the query results from the initial query are never used and we would like to cancel it when starting the new query (edited)
You can just use 2 commands:
KILL QUERY WHERE query_id = ' ... ' ASYNC

SELECT ... new query ....
in that case you don’t need to care when the original query will be stopped.
27 - Lag / Lead
Sample data
CREATE TABLE llexample (
    g Int32,
    a Date )
ENGINE = Memory;

INSERT INTO llexample SELECT
    number % 3,
    toDate('2020-01-01') + number
FROM numbers(10);

SELECT * FROM llexample ORDER BY g,a;

┌─g─┬──────────a─┐
│ 0 │ 2020-01-01 │
│ 0 │ 2020-01-04 │
│ 0 │ 2020-01-07 │
│ 0 │ 2020-01-10 │
│ 1 │ 2020-01-02 │
│ 1 │ 2020-01-05 │
│ 1 │ 2020-01-08 │
│ 2 │ 2020-01-03 │
│ 2 │ 2020-01-06 │
│ 2 │ 2020-01-09 │
└───┴────────────┘
Using arrays
select g, (arrayJoin(tuple_ll) as ll).1 a, ll.2 prev, ll.3 next
from (
select g, arrayZip( arraySort(groupArray(a)) as aa,
                    arrayPopBack(arrayPushFront(aa, toDate(0))),
                    arrayPopFront(arrayPushBack(aa, toDate(0))) ) tuple_ll
from llexample
group by g)
order by g, a;

┌─g─┬──────────a─┬───────prev─┬───────next─┐
│ 0 │ 2020-01-01 │ 1970-01-01 │ 2020-01-04 │
│ 0 │ 2020-01-04 │ 2020-01-01 │ 2020-01-07 │
│ 0 │ 2020-01-07 │ 2020-01-04 │ 2020-01-10 │
│ 0 │ 2020-01-10 │ 2020-01-07 │ 1970-01-01 │
│ 1 │ 2020-01-02 │ 1970-01-01 │ 2020-01-05 │
│ 1 │ 2020-01-05 │ 2020-01-02 │ 2020-01-08 │
│ 1 │ 2020-01-08 │ 2020-01-05 │ 1970-01-01 │
│ 2 │ 2020-01-03 │ 1970-01-01 │ 2020-01-06 │
│ 2 │ 2020-01-06 │ 2020-01-03 │ 2020-01-09 │
│ 2 │ 2020-01-09 │ 2020-01-06 │ 1970-01-01 │
└───┴────────────┴────────────┴────────────┘
Using window functions (starting from ClickHouse® 21.3)
SET allow_experimental_window_functions = 1;

SELECT
    g,
    a,
    any(a) OVER (PARTITION BY g ORDER BY a ASC ROWS
                 BETWEEN 1 PRECEDING AND 1 PRECEDING) AS prev,
    any(a) OVER (PARTITION BY g ORDER BY a ASC ROWS
                 BETWEEN 1 FOLLOWING AND 1 FOLLOWING) AS next
FROM llexample
ORDER BY
    g ASC,
    a ASC;

┌─g─┬──────────a─┬───────prev─┬───────next─┐
│ 0 │ 2020-01-01 │ 1970-01-01 │ 2020-01-04 │
│ 0 │ 2020-01-04 │ 2020-01-01 │ 2020-01-07 │
│ 0 │ 2020-01-07 │ 2020-01-04 │ 2020-01-10 │
│ 0 │ 2020-01-10 │ 2020-01-07 │ 1970-01-01 │
│ 1 │ 2020-01-02 │ 1970-01-01 │ 2020-01-05 │
│ 1 │ 2020-01-05 │ 2020-01-02 │ 2020-01-08 │
│ 1 │ 2020-01-08 │ 2020-01-05 │ 1970-01-01 │
│ 2 │ 2020-01-03 │ 1970-01-01 │ 2020-01-06 │
│ 2 │ 2020-01-06 │ 2020-01-03 │ 2020-01-09 │
│ 2 │ 2020-01-09 │ 2020-01-06 │ 1970-01-01 │
└───┴────────────┴────────────┴────────────┘
Using lagInFrame/leadInFrame (starting from ClickHouse 21.4)
SELECT
    g,
    a,
    lagInFrame(a) OVER (PARTITION BY g ORDER BY a ASC ROWS
                 BETWEEN UNBOUNDED PRECEDING AND UNBOUNDED FOLLOWING) AS prev,
    leadInFrame(a) OVER (PARTITION BY g ORDER BY a ASC ROWS
                 BETWEEN UNBOUNDED PRECEDING AND UNBOUNDED FOLLOWING) AS next
FROM llexample
ORDER BY
    g ASC,
    a ASC;

┌─g─┬──────────a─┬───────prev─┬───────next─┐
│ 0 │ 2020-01-01 │ 1970-01-01 │ 2020-01-04 │
│ 0 │ 2020-01-04 │ 2020-01-01 │ 2020-01-07 │
│ 0 │ 2020-01-07 │ 2020-01-04 │ 2020-01-10 │
│ 0 │ 2020-01-10 │ 2020-01-07 │ 1970-01-01 │
│ 1 │ 2020-01-02 │ 1970-01-01 │ 2020-01-05 │
│ 1 │ 2020-01-05 │ 2020-01-02 │ 2020-01-08 │
│ 1 │ 2020-01-08 │ 2020-01-05 │ 1970-01-01 │
│ 2 │ 2020-01-03 │ 1970-01-01 │ 2020-01-06 │
│ 2 │ 2020-01-06 │ 2020-01-03 │ 2020-01-09 │
│ 2 │ 2020-01-09 │ 2020-01-06 │ 1970-01-01 │
└───┴────────────┴────────────┴────────────┘
Using neighbor (no grouping, incorrect result over blocks)
SELECT
    g,
    a,
    neighbor(a, -1) AS prev,
    neighbor(a, 1) AS next
FROM
(
    SELECT *
    FROM llexample
    ORDER BY
        g ASC,
        a ASC
);

┌─g─┬──────────a─┬───────prev─┬───────next─┐
│ 0 │ 2020-01-01 │ 1970-01-01 │ 2020-01-04 │
│ 0 │ 2020-01-04 │ 2020-01-01 │ 2020-01-07 │
│ 0 │ 2020-01-07 │ 2020-01-04 │ 2020-01-10 │
│ 0 │ 2020-01-10 │ 2020-01-07 │ 2020-01-02 │
│ 1 │ 2020-01-02 │ 2020-01-10 │ 2020-01-05 │
│ 1 │ 2020-01-05 │ 2020-01-02 │ 2020-01-08 │
│ 1 │ 2020-01-08 │ 2020-01-05 │ 2020-01-03 │
│ 2 │ 2020-01-03 │ 2020-01-08 │ 2020-01-06 │
│ 2 │ 2020-01-06 │ 2020-01-03 │ 2020-01-09 │
│ 2 │ 2020-01-09 │ 2020-01-06 │ 1970-01-01 │
└───┴────────────┴────────────┴────────────┘
28 - Machine learning in ClickHouse
Resources
- Machine Learning in ClickHouse - Presentation from 2019 (Meetup 31)
- ML discussion: CatBoost / MindsDB / Fast.ai - Brief article from 2021
- Machine Learning Forecase (Russian) - Presentation from 2019 (Meetup 38)
29 - Mutations
How to know if ALTER TABLE … DELETE/UPDATE mutation ON CLUSTER was finished successfully on all the nodes?
A. mutation status in system.mutations is local to each replica, so use
SELECT hostname(), * FROM clusterAllReplicas('your_cluster_name', system.mutations);
-- you can also add WHERE conditions to that query if needed.
Look on is_done and latest_fail_reason columns
Are mutations being run in parallel or they are sequential in ClickHouse® (in scope of one table)
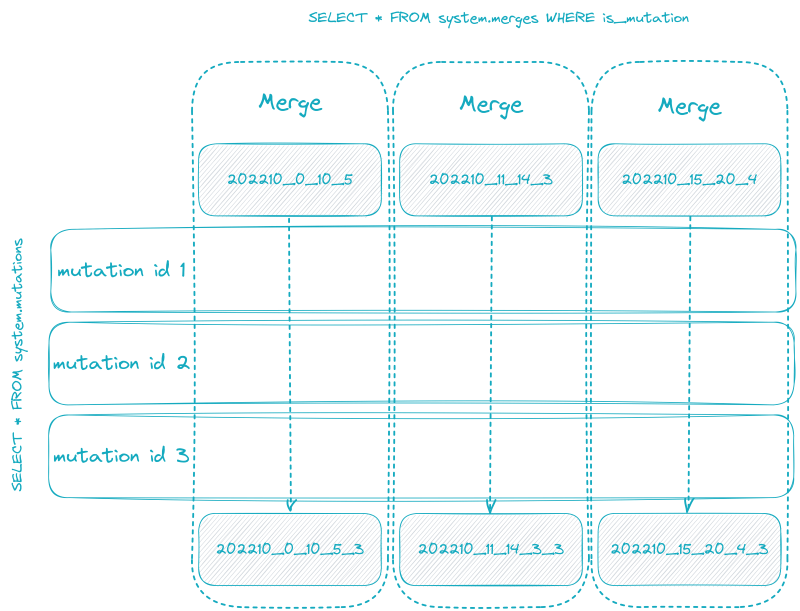
ClickHouse runs mutations sequentially, but it can combine several mutations in a single and apply all of them in one merge. Sometimes, it can lead to problems, when a combined expression which ClickHouse needs to execute becomes really big. (If ClickHouse combined thousands of mutations in one)
Because ClickHouse stores data in independent parts, ClickHouse is able to run mutation(s) merges for each part independently and in parallel.
It also can lead to high resource utilization, especially memory usage if you use x IN (SELECT ... FROM big_table) statements in mutation, because each merge will run and keep in memory its own HashSet. You can avoid this problem, if you will use Dictionary approach
for such mutations.
Parallelism of mutations controlled by settings:
SELECT *
FROM system.merge_tree_settings
WHERE name LIKE '%mutation%'

┌─name───────────────────────────────────────────────┬─value─┬─changed─┬─description──────────────────────────────────────────────────────────────────────────────────────────────────────────────────────────────────────────────────────────────────┬─type───┐
│ max_replicated_mutations_in_queue                  │ 8     │       0 │ How many tasks of mutating parts are allowed simultaneously in ReplicatedMergeTree queue.                                                                                    │ UInt64 │
│ number_of_free_entries_in_pool_to_execute_mutation │ 20    │       0 │ When there is less than specified number of free entries in pool, do not execute part mutations. This is to leave free threads for regular merges and avoid "Too many parts" │ UInt64 │
└────────────────────────────────────────────────────┴───────┴─────────┴──────────────────────────────────────────────────────────────────────────────────────────────────────────────────────────────────────────────────────────────────────────────┴────────┘
30 - OPTIMIZE vs OPTIMIZE FINAL
OPTIMIZE TABLE xyz – this initiates an unscheduled merge.
Example
You have 40 parts in 3 partitions. This unscheduled merge selects some partition (i.e. February) and selects 3 small parts to merge, then merge them into a single part. You get 38 parts in the result.
OPTIMIZE TABLE xyz FINAL – initiates a cycle of unscheduled merges.
ClickHouse® merges parts in this table until will remains 1 part in each partition (if a system has enough free disk space). As a result, you get 3 parts, 1 part per partition. In this case, ClickHouse rewrites parts even if they are already merged into a single part. It creates a huge CPU / Disk load if the table (XYZ) is huge. ClickHouse reads / uncompress / merge / compress / writes all data in the table.
If this table has size 1TB it could take around 3 hours to complete.
So we don’t recommend running OPTIMIZE TABLE xyz FINAL against tables with more than 10million rows.
31 - Parameterized views
ClickHouse® versions 23.1+ (23.1.6.42, 23.2.5.46, 23.3.1.2823) have inbuilt support for parametrized views :
CREATE VIEW my_new_view AS
SELECT *
FROM deals
WHERE category_id IN (
    SELECT category_id
    FROM deal_categories
    WHERE category = {category:String}
)

SELECT * FROM my_new_view(category = 'hot deals');
One more example
CREATE OR REPLACE VIEW v AS SELECT 1::UInt32 x WHERE x IN ({xx:Array(UInt32)});

select * from v(xx=[1,2,3]);
┌─x─┐
│ 1 │
└───┘
ClickHouse versions pre 23.1
Custom settings allows to emulate parameterized views.
You need to enable custom settings and define any prefixes for settings.
$ cat /etc/clickhouse-server/config.d/custom_settings_prefixes.xml
<?xml version="1.0" ?>
<yandex>
    <custom_settings_prefixes>my,my2</custom_settings_prefixes>
</yandex>
You can also set the default value for user settings in the default section of the user configuration.
cat /etc/clickhouse-server/users.d/custom_settings_default.xml
<?xml version="1.0"?>
<yandex>
    <profiles>
        <default>
            <my2_category>'hot deals'</my2_category>
        </default>
    </profiles>
</yandex>
See also: https://kb.altinity.com/altinity-kb-setup-and-maintenance/custom_settings/
A server restart is required for the default value to be applied
$ systemctl restart clickhouse-server
Now you can set settings as any other settings, and query them using getSetting() function.
SET my2_category='hot deals';

SELECT getSetting('my2_category');
┌─getSetting('my2_category')─┐
│ hot deals                  │
└────────────────────────────┘

-- you can query ClickHouse settings as well
SELECT getSetting('max_threads')
┌─getSetting('max_threads')─┐
│                         8 │
└───────────────────────────┘
Now we can create a view
CREATE VIEW my_new_view AS
SELECT *
FROM deals
WHERE category_id IN
(
    SELECT category_id
    FROM deal_categories
    WHERE category = getSetting('my2_category')
);
And query it
SELECT *
FROM my_new_view
SETTINGS my2_category = 'hot deals';
If the custom setting is not set when the view is being created, you need to explicitly define the list of columns for the view:
CREATE VIEW my_new_view (c1 Int, c2 String, ...)
AS
SELECT *
FROM deals
WHERE category_id IN
(
    SELECT category_id
    FROM deal_categories
    WHERE category = getSetting('my2_category')
);
32 - Use both projection and raw data in single query
CREATE TABLE default.metric
(
    `key_a` UInt8,
    `key_b` UInt32,
    `date` Date,
    `value` UInt32,
    PROJECTION monthly
    (
        SELECT
            key_a,
            key_b,
            min(date),
            sum(value)
        GROUP BY
            key_a,
            key_b
    )
)
ENGINE = MergeTree
PARTITION BY toYYYYMM(date)
ORDER BY (key_a, key_b, date)
SETTINGS index_granularity = 8192;


INSERT INTO metric SELECT
    key_a,
    key_b,
    date,
    rand() % 100000 AS value
FROM
(
    SELECT
        arrayJoin(range(8)) AS key_a,
        number % 500000 AS key_b,
        today() - intDiv(number, 500000) AS date
    FROM numbers_mt(1080000000)
);

OPTIMIZE TABLE metric FINAL;

SET max_threads = 8;

WITH
    toDate('2015-02-27') AS start_date,
    toDate('2022-02-15') AS end_date,
    key_a IN (1, 3, 5, 7) AS key_a_cond
SELECT
    key_b,
    sum(value) AS sum
FROM metric
WHERE (date > start_date) AND (date < end_date) AND key_a_cond
GROUP BY key_b
ORDER BY sum DESC
LIMIT 25

25 rows in set. Elapsed: 6.561 sec. Processed 4.32 billion rows, 47.54 GB (658.70 million rows/s., 7.25 GB/s.)

WITH
    toDate('2015-02-27') AS start_date,
    toDate('2022-02-15') AS end_date,
    key_a IN (1, 3, 5, 7) AS key_a_cond
SELECT
    key_b,
    sum(value) AS sum
FROM
(
    SELECT
        key_b,
        value
    FROM metric
    WHERE indexHint(_partition_id IN CAST([toYYYYMM(start_date), toYYYYMM(end_date)], 'Array(String)')) AND (date > start_date) AND (date < end_date) AND key_a_cond
    UNION ALL
    SELECT
        key_b,
        sum(value) AS value
    FROM metric
    WHERE indexHint(_partition_id IN CAST(range(toYYYYMM(start_date) + 1, toYYYYMM(end_date)), 'Array(String)')) AND key_a_cond
    GROUP BY key_b
)
GROUP BY key_b
ORDER BY sum DESC
LIMIT 25

25 rows in set. Elapsed: 1.038 sec. Processed 181.86 million rows, 4.56 GB (175.18 million rows/s., 4.40 GB/s.)


WITH
    (toDate('2016-02-27'), toDate('2017-02-15')) AS period_1,
    (toDate('2018-05-27'), toDate('2022-08-15')) AS period_2,
    (date > (period_1.1)) AND (date < (period_1.2)) AS period_1_cond,
    (date > (period_2.1)) AND (date < (period_2.2)) AS period_2_cond,
    key_a IN (1, 3, 5, 7) AS key_a_cond
SELECT
    key_b,
    sumIf(value, period_1_cond) AS sum_per_1,
    sumIf(value, period_2_cond) AS sum_per_2
FROM metric
WHERE (period_1_cond OR period_2_cond) AND key_a_cond
GROUP BY key_b
ORDER BY sum_per_2 / sum_per_1 DESC
LIMIT 25

25 rows in set. Elapsed: 5.717 sec. Processed 3.47 billion rows, 38.17 GB (606.93 million rows/s., 6.68 GB/s.)

WITH
    (toDate('2016-02-27'), toDate('2017-02-15')) AS period_1,
    (toDate('2018-05-27'), toDate('2022-08-15')) AS period_2,
    (date > (period_1.1)) AND (date < (period_1.2)) AS period_1_cond,
    (date > (period_2.1)) AND (date < (period_2.2)) AS period_2_cond,
    CAST([toYYYYMM(period_1.1), toYYYYMM(period_1.2), toYYYYMM(period_2.1), toYYYYMM(period_2.2)], 'Array(String)') AS daily_parts,
    key_a IN (1, 3, 5, 7) AS key_a_cond
SELECT
    key_b,
    sumIf(value, period_1_cond) AS sum_per_1,
    sumIf(value, period_2_cond) AS sum_per_2
FROM
(
    SELECT
        key_b,
        date,
        value
    FROM metric
    WHERE indexHint(_partition_id IN (daily_parts)) AND (period_1_cond OR period_2_cond) AND key_a_cond
    UNION ALL
    SELECT
        key_b,
        min(date) AS date,
        sum(value) AS value
    FROM metric
    WHERE indexHint(_partition_id IN CAST(arrayConcat(range(toYYYYMM(period_1.1) + 1, toYYYYMM(period_1.2)), range(toYYYYMM(period_2.1) + 1, toYYYYMM(period_2.1))), 'Array(String)')) AND indexHint(_partition_id NOT IN (daily_parts)) AND key_a_cond
    GROUP BY
        key_b
)
GROUP BY key_b
ORDER BY sum_per_2 / sum_per_1 DESC
LIMIT 25


25 rows in set. Elapsed: 0.444 sec. Processed 140.34 million rows, 2.11 GB (316.23 million rows/s., 4.77 GB/s.)


WITH
    toDate('2022-01-03') AS start_date,
    toDate('2022-02-15') AS end_date,
    key_a IN (1, 3, 5, 7) AS key_a_cond
SELECT
    key_b,
    sum(value) AS sum
FROM metric
WHERE (date > start_date) AND (date < end_date) AND key_a_cond
GROUP BY key_b
ORDER BY sum DESC
LIMIT 25

25 rows in set. Elapsed: 0.208 sec. Processed 100.06 million rows, 1.10 GB (481.06 million rows/s., 5.29 GB/s.)


WITH
    toDate('2022-01-03') AS start_date,
    toDate('2022-02-15') AS end_date,
    key_a IN (1, 3, 5, 7) AS key_a_cond
SELECT
    key_b,
    sum(value) AS sum
FROM
(
    SELECT
        key_b,
        value
    FROM metric
    WHERE indexHint(_partition_id IN CAST([toYYYYMM(start_date), toYYYYMM(end_date)], 'Array(String)')) AND (date > start_date) AND (date < end_date) AND key_a_cond
    UNION ALL
    SELECT
        key_b,
        sum(value) AS value
    FROM metric
    WHERE indexHint(_partition_id IN CAST(range(toYYYYMM(start_date) + 1, toYYYYMM(end_date)), 'Array(String)')) AND key_a_cond
    GROUP BY key_b
)
GROUP BY key_b
ORDER BY sum DESC
LIMIT 25

25 rows in set. Elapsed: 0.216 sec. Processed 100.06 million rows, 1.10 GB (462.68 million rows/s., 5.09 GB/s.)


WITH
    toDate('2021-12-03') AS start_date,
    toDate('2022-02-15') AS end_date,
    key_a IN (1, 3, 5, 7) AS key_a_cond
SELECT
    key_b,
    sum(value) AS sum
FROM metric
WHERE (date > start_date) AND (date < end_date) AND key_a_cond
GROUP BY key_b
ORDER BY sum DESC
LIMIT 25

25 rows in set. Elapsed: 0.308 sec. Processed 162.09 million rows, 1.78 GB (526.89 million rows/s., 5.80 GB/s.)

WITH
    toDate('2021-12-03') AS start_date,
    toDate('2022-02-15') AS end_date,
    key_a IN (1, 3, 5, 7) AS key_a_cond
SELECT
    key_b,
    sum(value) AS sum
FROM
(
    SELECT
        key_b,
        value
    FROM metric
    WHERE indexHint(_partition_id IN CAST([toYYYYMM(start_date), toYYYYMM(end_date)], 'Array(String)')) AND (date > start_date) AND (date < end_date) AND key_a_cond
    UNION ALL
    SELECT
        key_b,
        sum(value) AS value
    FROM metric
    WHERE indexHint(_partition_id IN CAST(range(toYYYYMM(start_date) + 1, toYYYYMM(end_date)), 'Array(String)')) AND key_a_cond
    GROUP BY key_b
)
GROUP BY key_b
ORDER BY sum DESC
LIMIT 25

25 rows in set. Elapsed: 0.268 sec. Processed 102.08 million rows, 1.16 GB (381.46 million rows/s., 4.33 GB/s.)
33 - PIVOT / UNPIVOT
PIVOT
CREATE TABLE sales(suppkey UInt8, category String, quantity UInt32) ENGINE=Memory();

INSERT INTO sales VALUES (2, 'AA' ,7500),(1, 'AB' , 4000),(1, 'AA' , 6900),(1, 'AB', 8900), (1, 'AC', 8300), (1, 'AA', 7000), (1, 'AC', 9000), (2,'AA', 9800), (2,'AB', 9600), (1,'AC', 8900),(1, 'AD', 400), (2,'AD', 900), (2,'AD', 1200), (1,'AD', 2600), (2, 'AC', 9600),(1, 'AC', 6200);
Using Map data type (starting from ClickHouse® 21.1)
WITH CAST(sumMap([category], [quantity]), 'Map(String, UInt32)') AS map
SELECT
    suppkey,
    map['AA'] AS AA,
    map['AB'] AS AB,
    map['AC'] AS AC,
    map['AD'] AS AD
FROM sales
GROUP BY suppkey
ORDER BY suppkey ASC

┌─suppkey─┬────AA─┬────AB─┬────AC─┬───AD─┐
│       1 │ 13900 │ 12900 │ 32400 │ 3000 │
│       2 │ 17300 │  9600 │  9600 │ 2100 │
└─────────┴───────┴───────┴───────┴──────┘

WITH CAST(sumMap(map(category, quantity)), 'Map(LowCardinality(String), UInt32)') AS map
SELECT
    suppkey,
    map['AA'] AS AA,
    map['AB'] AS AB,
    map['AC'] AS AC,
    map['AD'] AS AD
FROM sales
GROUP BY suppkey
ORDER BY suppkey ASC

┌─suppkey─┬────AA─┬────AB─┬────AC─┬───AD─┐
│       1 │ 13900 │ 12900 │ 32400 │ 3000 │
│       2 │ 17300 │  9600 │  9600 │ 2100 │
└─────────┴───────┴───────┴───────┴──────┘
Using -If combinator
SELECT
    suppkey,
    sumIf(quantity, category = 'AA') AS AA,
    sumIf(quantity, category = 'AB') AS AB,
    sumIf(quantity, category = 'AC') AS AC,
    sumIf(quantity, category = 'AD') AS AD
FROM sales
GROUP BY suppkey
ORDER BY suppkey ASC

┌─suppkey─┬────AA─┬────AB─┬────AC─┬───AD─┐
│       1 │ 13900 │ 12900 │ 32400 │ 3000 │
│       2 │ 17300 │  9600 │  9600 │ 2100 │
└─────────┴───────┴───────┴───────┴──────┘
Using -Resample combinator
WITH sumResample(0, 4, 1)(quantity, transform(category, ['AA', 'AB', 'AC', 'AD'], [0, 1, 2, 3], 4)) AS sum
SELECT
    suppkey,
    sum[1] AS AA,
    sum[2] AS AB,
    sum[3] AS AC,
    sum[4] AS AD
FROM sales
GROUP BY suppkey
ORDER BY suppkey ASC

┌─suppkey─┬────AA─┬────AB─┬────AC─┬───AD─┐
│       1 │ 13900 │ 12900 │ 32400 │ 3000 │
│       2 │ 17300 │  9600 │  9600 │ 2100 │
└─────────┴───────┴───────┴───────┴──────┘
UNPIVOT
CREATE TABLE sales_w(suppkey UInt8, brand String, AA UInt32, AB UInt32, AC UInt32,
AD UInt32) ENGINE=Memory();

 INSERT INTO sales_w VALUES (1, 'BRAND_A', 1500, 4200, 1600, 9800), (2, 'BRAND_B', 6200, 1300, 5800, 3100), (3, 'BRAND_C', 5000, 8900, 6900, 3400);
SELECT
    suppkey,
    brand,
    category,
    quantity
FROM sales_w
ARRAY JOIN
    [AA, AB, AC, AD] AS quantity,
    splitByString(', ', 'AA, AB, AC, AD') AS category
ORDER BY suppkey ASC

┌─suppkey─┬─brand───┬─category─┬─quantity─┐
│       1 │ BRAND_A │ AA       │     1500 │
│       1 │ BRAND_A │ AB       │     4200 │
│       1 │ BRAND_A │ AC       │     1600 │
│       1 │ BRAND_A │ AD       │     9800 │
│       2 │ BRAND_B │ AA       │     6200 │
│       2 │ BRAND_B │ AB       │     1300 │
│       2 │ BRAND_B │ AC       │     5800 │
│       2 │ BRAND_B │ AD       │     3100 │
│       3 │ BRAND_C │ AA       │     5000 │
│       3 │ BRAND_C │ AB       │     8900 │
│       3 │ BRAND_C │ AC       │     6900 │
│       3 │ BRAND_C │ AD       │     3400 │
└─────────┴─────────┴──────────┴──────────┘

SELECT
    suppkey,
    brand,
    tpl.1 AS category,
    tpl.2 AS quantity
FROM sales_w
ARRAY JOIN tupleToNameValuePairs(CAST((AA, AB, AC, AD), 'Tuple(AA UInt32, AB UInt32, AC UInt32, AD UInt32)')) AS tpl
ORDER BY suppkey ASC

┌─suppkey─┬─brand───┬─category─┬─quantity─┐
│       1 │ BRAND_A │ AA       │     1500 │
│       1 │ BRAND_A │ AB       │     4200 │
│       1 │ BRAND_A │ AC       │     1600 │
│       1 │ BRAND_A │ AD       │     9800 │
│       2 │ BRAND_B │ AA       │     6200 │
│       2 │ BRAND_B │ AB       │     1300 │
│       2 │ BRAND_B │ AC       │     5800 │
│       2 │ BRAND_B │ AD       │     3100 │
│       3 │ BRAND_C │ AA       │     5000 │
│       3 │ BRAND_C │ AB       │     8900 │
│       3 │ BRAND_C │ AC       │     6900 │
│       3 │ BRAND_C │ AD       │     3400 │
└─────────┴─────────┴──────────┴──────────┘
34 - Possible deadlock avoided. Client should retry
In ClickHouse® version 19.14 a serious issue was found: a race condition that can lead to server deadlock. The reason for that was quite fundamental, and a temporary workaround for that was added (“possible deadlock avoided”).
Those locks are one of the fundamental things that the core team was actively working on in 2020.
In 20.3 some of the locks leading to that situation were removed as a part of huge refactoring.
In 20.4 more locks were removed, the check was made configurable (see lock_acquire_timeout ) so you can say how long to wait before returning that exception
In 20.5 heuristics of that check (“possible deadlock avoided”) was improved.
In 20.6 all table-level locks which were possible to remove were removed, so alters are totally lock-free.
20.10 enables database=Atomic by default which allows running even DROP commands without locks.
Typically issue was happening when doing some concurrent select on system.parts / system.columns / system.table with simultaneous table manipulations (doing some kind of ALTERS / TRUNCATES / DROP)I
If that exception happens often in your use-case:
- use recent clickhouse versions
- ensure you use Atomic engine for the database (not Ordinary) (can be checked in system.databases)
Sometime you can try to workaround issue by finding the queries which uses that table concurently (especially to system.tables / system.parts and other system tables) and try killing them (or avoiding them).
35 - Roaring bitmaps for calculating retention
CREATE TABLE test_roaring_bitmap
ENGINE = MergeTree
ORDER BY h AS
SELECT
    intDiv(number, 5) AS h,
    groupArray(toUInt16(number - (2 * intDiv(number, 5)))) AS vals,
    groupBitmapState(toUInt16(number - (2 * intDiv(number, 5)))) AS vals_bitmap
FROM numbers(40)
GROUP BY h

SELECT
    h,
    vals,
    hex(vals_bitmap)
FROM test_roaring_bitmap

┌─h─┬─vals─────────────┬─hex(vals_bitmap)─────────┐
│ 0 │ [0,1,2,3,4]      │ 000500000100020003000400 │
│ 1 │ [3,4,5,6,7]      │ 000503000400050006000700 │
│ 2 │ [6,7,8,9,10]     │ 000506000700080009000A00 │
│ 3 │ [9,10,11,12,13]  │ 000509000A000B000C000D00 │
│ 4 │ [12,13,14,15,16] │ 00050C000D000E000F001000 │
│ 5 │ [15,16,17,18,19] │ 00050F001000110012001300 │
│ 6 │ [18,19,20,21,22] │ 000512001300140015001600 │
│ 7 │ [21,22,23,24,25] │ 000515001600170018001900 │
└───┴──────────────────┴──────────────────────────┘

SELECT
    groupBitmapAnd(vals_bitmap) AS uniq,
    bitmapToArray(groupBitmapAndState(vals_bitmap)) AS vals
FROM test_roaring_bitmap
WHERE h IN (0, 1)

┌─uniq─┬─vals──┐
│    2 │ [3,4] │
└──────┴───────┘
See also A primer on roaring bitmaps
36 - SAMPLE by
The execution pipeline is embedded in the partition reading code.
So that works this way:
- ClickHouse® does partition pruning based on
WHEREconditions. - For every partition, it picks a columns ranges (aka ‘marks’ / ‘granulas’) based on primary key conditions.
- Here the sampling logic is applied: a) in case of
SAMPLE k(kin0..1range) it adds conditionsWHERE sample_key < k * max_int_of_sample_key_typeb) in case ofSAMPLE k OFFSET mit adds conditionsWHERE sample_key BETWEEN m * max_int_of_sample_key_type AND (m + k) * max_int_of_sample_key_typec) in case ofSAMPLE N(N>1) if first estimates how many rows are inside the range we need to read and based on that convert it to 3a case (calculate k based on number of rows in ranges and desired number of rows) - on the data returned by those other conditions are applied (so here the number of rows can be decreased here)
SAMPLE by
SAMPLE key Must be:
- Included in the primary key.
- Uniformly distributed in the domain of its data type:
- Bad: Timestamp;
- Good: intHash32(UserID);
- Cheap to calculate:
- Bad: cityHash64(URL);
- Good: intHash32(UserID);
- Not after high granular fields in primary key:
- Bad: ORDER BY (Timestamp, sample_key);
- Good: ORDER BY (CounterID, Date, sample_key).
Sampling is:
- Deterministic
- Works in a consistent way for different tables.
- Allows reading less amount of data from disk.
- SAMPLE key, bonus
- SAMPLE 1/10
- Select data for 1/10 of all possible sample keys; SAMPLE 1000000
- Select from about (not less than) 1 000 000 rows on each shard;
- You can use _sample_factor virtual column to determine the relative sample factor; SAMPLE 1/10 OFFSET 1/10
- Select second 1/10 of all possible sample keys; SET max_parallel_replicas = 3
- Select from multiple replicas of each shard in parallel;
SAMPLE emulation via WHERE condition
Sometimes, it’s easier to emulate sampling via conditions in WHERE clause instead of using SAMPLE key.
SELECT count() FROM table WHERE ... AND cityHash64(some_high_card_key) % 10 = 0; -- Deterministic
SELECT count() FROM table WHERE ... AND rand() % 10 = 0; -- Non-deterministic
ClickHouse will read more data from disk compared to an example with a good SAMPLE key, but it’s more universal and can be used if you can’t change table ORDER BY key. (To learn more about ClickHouse internals, Administrator Training for ClickHouse is available.)
37 - Sampling Example
The most important idea about sampling that the primary index must have LowCardinality. (For more information, see the Altinity Knowledge Base article on LowCardinality or a ClickHouse® user's lessons learned from LowCardinality ).
The following example demonstrates how sampling can be setup correctly, and an example if it being set up incorrectly as a comparison.
Sampling requires sample by expression . This ensures a range of sampled column types fit within a specified range, which ensures the requirement of low cardinality. In this example, I cannot use transaction_id because I can not ensure that the min value of transaction_id = 0 and max value = MAX_UINT64. Instead, I used cityHash64(transaction_id)to expand the range within the minimum and maximum values.
For example if all values of transaction_id are from 0 to 10000 sampling will be inefficient. But cityHash64(transaction_id) expands the range from 0 to 18446744073709551615:
SELECT cityHash64(10000)
┌────cityHash64(10000)─┐
│ 14845905981091347439 │
└──────────────────────┘
If I used transaction_id without knowing that they matched the allowable ranges, the results of sampled queries would be skewed. For example, when using sample 0.5, ClickHouse requests where sample_col >= 0 and sample_col <= MAX_UINT64/2.
Also you can include multiple columns into a hash function of the sampling expression to improve randomness of the distribution cityHash64(transaction_id, banner_id).
Sampling Friendly Table
CREATE TABLE table_one
( timestamp UInt64,
  transaction_id UInt64,
  banner_id UInt16,
  value UInt32
)
ENGINE = MergeTree()
PARTITION BY toYYYYMMDD(toDateTime(timestamp))
ORDER BY (banner_id,
          toStartOfHour(toDateTime(timestamp)),
          cityHash64(transaction_id))
SAMPLE BY cityHash64(transaction_id)
SETTINGS index_granularity = 8192

insert into table_one
select 1602809234+intDiv(number,100000),
       number,
       number%991,
       toUInt32(rand())
from numbers(10000000000);
I reduced the granularity of the timestamp column to one hour with toStartOfHour(toDateTime(timestamp)) , otherwise sampling will not work.
Verifying Sampling Works
The following shows that sampling works with the table and parameters described above. Notice the Elapsed time when invoking sampling:
-- Q1. No where filters.
-- The query is 10 times faster with SAMPLE 0.01
select banner_id, sum(value), count(value), max(value)
from table_one
group by banner_id format Null;

0 rows in set. Elapsed: 11.490 sec.
     Processed 10.00 billion rows, 60.00 GB (870.30 million rows/s., 5.22 GB/s.)

select banner_id, sum(value), count(value), max(value)
from table_one SAMPLE 0.01
group by banner_id format Null;

0 rows in set. Elapsed: 1.316 sec.
     Processed 452.67 million rows, 6.34 GB (343.85 million rows/s., 4.81 GB/s.)

-- Q2. Filter by the first column in index (banner_id = 42)
-- The query is 20 times faster with SAMPLE 0.01
-- reads 20 times less rows: 10.30 million rows VS Processed 696.32 thousand rows
select banner_id, sum(value), count(value), max(value)
from table_one
WHERE banner_id = 42
group by banner_id format Null;

0 rows in set. Elapsed: 0.020 sec.
     Processed 10.30 million rows, 61.78 MB (514.37 million rows/s., 3.09 GB/s.)

select banner_id, sum(value), count(value), max(value)
from table_one SAMPLE 0.01
WHERE banner_id = 42
group by banner_id format Null;

0 rows in set. Elapsed: 0.008 sec.
     Processed 696.32 thousand rows, 9.75 MB (92.49 million rows/s., 1.29 GB/s.)

-- Q3. No filters
-- The query is 10 times faster with SAMPLE 0.01
-- reads 20 times less rows.
select banner_id,
       toStartOfHour(toDateTime(timestamp)) hr,
       sum(value), count(value), max(value)
from table_one
group by banner_id, hr format Null;
0 rows in set. Elapsed: 36.660 sec.
     Processed 10.00 billion rows, 140.00 GB (272.77 million rows/s., 3.82 GB/s.)

select banner_id,
       toStartOfHour(toDateTime(timestamp)) hr,
       sum(value), count(value), max(value)
from table_one SAMPLE 0.01
group by banner_id, hr format Null;
0 rows in set. Elapsed: 3.741 sec.
     Processed 452.67 million rows, 9.96 GB (121.00 million rows/s., 2.66 GB/s.)

-- Q4. Filter by not indexed column
-- The query is 6 times faster with SAMPLE 0.01
-- reads 20 times less rows.
select count()
from table_one
where value = 666 format Null;
1 rows in set. Elapsed: 6.056 sec.
     Processed 10.00 billion rows, 40.00 GB (1.65 billion rows/s., 6.61 GB/s.)

select count()
from table_one  SAMPLE 0.01
where value = 666 format Null;
1 rows in set. Elapsed: 1.214 sec.
     Processed 452.67 million rows, 5.43 GB (372.88 million rows/s., 4.47 GB/s.)
Non-Sampling Friendly Table
CREATE TABLE table_one
( timestamp UInt64,
  transaction_id UInt64,
  banner_id UInt16,
  value UInt32
)
ENGINE = MergeTree()
PARTITION BY toYYYYMMDD(toDateTime(timestamp))
ORDER BY (banner_id,
          timestamp,
          cityHash64(transaction_id))
SAMPLE BY cityHash64(transaction_id)
SETTINGS index_granularity = 8192

insert into table_one
select 1602809234+intDiv(number,100000),
       number,
       number%991,
       toUInt32(rand())
from numbers(10000000000);
This is the same as our other table, BUT granularity of timestamp column is not reduced.
Verifying Sampling Does Not Work
The following tests shows that sampling is not working because of the lack of timestamp granularity. The Elapsed time is longer when sampling is used.
-- Q1. No where filters.
-- The query is 2 times SLOWER!!! with SAMPLE 0.01
-- Because it needs to read excessive column with sampling data!
select banner_id, sum(value), count(value), max(value)
from table_one
group by banner_id format Null;
0 rows in set. Elapsed: 11.196 sec.
     Processed 10.00 billion rows, 60.00 GB (893.15 million rows/s., 5.36 GB/s.)

select banner_id, sum(value), count(value), max(value)
from table_one SAMPLE 0.01
group by banner_id format Null;
0 rows in set. Elapsed: 24.378 sec.
     Processed 10.00 billion rows, 140.00 GB (410.21 million rows/s., 5.74 GB/s.)

-- Q2. Filter by the first column in index (banner_id = 42)
-- The query is SLOWER with SAMPLE 0.01
select banner_id, sum(value), count(value), max(value)
from table_one
WHERE banner_id = 42
group by banner_id format Null;
0 rows in set. Elapsed: 0.022 sec.
     Processed 10.27 million rows, 61.64 MB (459.28 million rows/s., 2.76 GB/s.)

select banner_id, sum(value), count(value), max(value)
from table_one SAMPLE 0.01
WHERE banner_id = 42
group by banner_id format Null;
0 rows in set. Elapsed: 0.037 sec.
     Processed 10.27 million rows, 143.82 MB (275.16 million rows/s., 3.85 GB/s.)

-- Q3. No filters
-- The query is SLOWER with SAMPLE 0.01
select banner_id,
       toStartOfHour(toDateTime(timestamp)) hr,
       sum(value), count(value), max(value)
from table_one
group by banner_id, hr format Null;
0 rows in set. Elapsed: 21.663 sec.
     Processed 10.00 billion rows, 140.00 GB (461.62 million rows/s., 6.46 GB/s.)

select banner_id,
       toStartOfHour(toDateTime(timestamp)) hr, sum(value),
       count(value), max(value)
from table_one SAMPLE 0.01
group by banner_id, hr format Null;
0 rows in set. Elapsed: 26.697 sec.
     Processed 10.00 billion rows, 220.00 GB (374.57 million rows/s., 8.24 GB/s.)

-- Q4. Filter by not indexed column
-- The query is SLOWER with SAMPLE 0.01
select count()
from table_one
where value = 666 format Null;
0 rows in set. Elapsed: 7.679 sec.
     Processed 10.00 billion rows, 40.00 GB (1.30 billion rows/s., 5.21 GB/s.)

select count()
from table_one  SAMPLE 0.01
where value = 666 format Null;
0 rows in set. Elapsed: 21.668 sec.
     Processed 10.00 billion rows, 120.00 GB (461.51 million rows/s., 5.54 GB/s.)
38 - Simple aggregate functions & combinators
Q. What is SimpleAggregateFunction? Are there advantages to use it instead of AggregateFunction in AggregatingMergeTree?
The ClickHouse® SimpleAggregateFunction can be used for those aggregations when the function state is exactly the same as the resulting function value. Typical example is max function: it only requires storing the single value which is already maximum, and no extra steps needed to get the final value. In contrast avg need to store two numbers - sum & count, which should be divided to get the final value of aggregation (done by the -Merge step at the very end).
| SimpleAggregateFunction | AggregateFunction | |
|---|---|---|
| inserting | accepts the value of underlying type OR a value of corresponding SimpleAggregateFunction type | ONLY accepts the state of same aggregate function calculated using -State combinator |
| storing | Internally store just a value of underlying type | function-specific state |
| storage usage | typically is much better due to better compression/codecs | in very rare cases it can be more optimal than raw values adaptive granularity doesn't work for large states |
| reading raw value per row | you can access it directly | you need to use finalizeAggregation function |
| using aggregated value | just
| you need to use |
| memory usage | typically less memory needed (in some corner cases even 10 times) | typically uses more memory, as every state can be quite complex |
| performance | typically better, due to lower overhead | worse |
See also:
- Altinity Knowledge Base article on AggregatingMergeTree
- https://github.com/ClickHouse/ClickHouse/pull/4629
- https://github.com/ClickHouse/ClickHouse/issues/3852
Q. How maxSimpleState combinator result differs from plain max?
They produce the same result, but types differ (the first have SimpleAggregateFunction datatype). Both can be pushed to SimpleAggregateFunction or to the underlying type. So they are interchangeable.
Info
-SimpleState is useful for implicit Materialized View creation, like
CREATE MATERIALIZED VIEW mv ENGINE = AggregatingMergeTree ORDER BY date AS SELECT date, sumSimpleState(1) AS cnt, sumSimpleState(revenue) AS rev FROM table GROUP BY dateQ. Can I use -If combinator with SimpleAggregateFunction?
Something like SimpleAggregateFunction(maxIf, UInt64, UInt8) is NOT possible. But is 100% ok to push maxIf (or maxSimpleStateIf) into SimpleAggregateFunction(max, UInt64)
There is one problem with that approach:
-SimpleStateIf Would produce 0 as result in case of no-match, and it can mess up some aggregate functions state. It wouldn’t affect functions like max/argMax/sum, but could affect functions like min/argMin/any/anyLast
SELECT
    minIfMerge(state_1),
    min(state_2)
FROM
(
    SELECT
        minIfState(number, number > 5) AS state_1,
        minSimpleStateIf(number, number > 5) AS state_2
    FROM numbers(5)
    UNION ALL
    SELECT
        minIfState(toUInt64(2), 2),
        minIf(2, 2)
)

┌─minIfMerge(state_1)─┬─min(state_2)─┐
│                   2 │            0 │
└─────────────────────┴──────────────┘
You can easily workaround that:
- Using Nullable datatype.
- Set result to some big number in case of no-match, which would be bigger than any possible value, so it would be safe to use. But it would work only for
min/argMin
SELECT
    min(state_1),
    min(state_2)
FROM
(
    SELECT
        minSimpleState(if(number > 5, number, 1000)) AS state_1,
        minSimpleStateIf(toNullable(number), number > 5) AS state_2
    FROM numbers(5)
    UNION ALL
    SELECT
        minIf(2, 2),
        minIf(2, 2)
)

┌─min(state_1)─┬─min(state_2)─┐
│            2 │            2 │
└──────────────┴──────────────┘
Extra example
WITH
    minIfState(number, number > 5) AS state_1,
    minSimpleStateIf(number, number > 5) AS state_2
SELECT
    byteSize(state_1),
    toTypeName(state_1),
    byteSize(state_2),
    toTypeName(state_2)
FROM numbers(10)
FORMAT Vertical

-- For UInt64
Row 1:
──────
byteSize(state_1):   24
toTypeName(state_1): AggregateFunction(minIf, UInt64, UInt8)
byteSize(state_2):   8
toTypeName(state_2): SimpleAggregateFunction(min, UInt64)

-- For UInt32
──────
byteSize(state_1):   16
byteSize(state_2):   4

-- For UInt16
──────
byteSize(state_1):   12
byteSize(state_2):   2

-- For UInt8
──────
byteSize(state_1):   10
byteSize(state_2):   1
See also https://gist.github.com/filimonov/a4f6754497f02fcef78e9f23a4d170ee
39 - Skip indexes
ClickHouse® provides a type of index that in specific circumstances can significantly improve query speed. These structures are labeled “skip” indexes because they enable ClickHouse to skip reading significant chunks of data that are guaranteed to have no matching values.
39.1 - Example: minmax
Use cases
Strong correlation between column from table ORDER BY / PARTITION BY key and other column which is regularly being used in WHERE condition
Good example is incremental ID which increasing with time.
CREATE TABLE skip_idx_corr
(
    `key` UInt32,
    `id` UInt32,
    `ts` DateTime
)
ENGINE = MergeTree
PARTITION BY toYYYYMM(ts)
ORDER BY (key, id);

INSERT INTO skip_idx_corr SELECT
    rand(),
    number,
    now() + intDiv(number, 10)
FROM numbers(100000000);

SELECT count()
FROM skip_idx_corr
WHERE id = 6000000

1 rows in set. Elapsed: 0.167 sec. Processed 100.00 million rows, 400.00 MB
(599.96 million rows/s., 2.40 GB/s.)


ALTER TABLE skip_idx_corr ADD INDEX id_idx id TYPE minmax GRANULARITY 10;
ALTER TABLE skip_idx_corr MATERIALIZE INDEX id_idx;


SELECT count()
FROM skip_idx_corr
WHERE id = 6000000

1 rows in set. Elapsed: 0.017 sec. Processed 6.29 million rows, 25.17 MB
(359.78 million rows/s., 1.44 GB/s.)
Multiple Date/DateTime columns can be used in WHERE conditions
Usually it could happen if you have separate Date and DateTime columns and different column being used in PARTITION BY expression and in WHERE condition. Another possible scenario when you have multiple DateTime columns which have pretty the same date or even time.
CREATE TABLE skip_idx_multiple
(
    `key` UInt32,
    `date` Date,
    `time` DateTime,
    `created_at` DateTime,
    `inserted_at` DateTime
)
ENGINE = MergeTree
PARTITION BY toYYYYMM(date)
ORDER BY (key, time);

INSERT INTO skip_idx_multiple SELECT
    number,
    toDate(x),
    now() + intDiv(number, 10) AS x,
    x - (rand() % 100),
    x + (rand() % 100)
FROM numbers(100000000);


SELECT count()
FROM skip_idx_multiple
WHERE date > (now() + toIntervalDay(105));

1 rows in set. Elapsed: 0.048 sec. Processed 14.02 million rows, 28.04 MB
(290.96 million rows/s., 581.92 MB/s.)

SELECT count()
FROM skip_idx_multiple
WHERE time > (now() + toIntervalDay(105));

1 rows in set. Elapsed: 0.188 sec. Processed 100.00 million rows, 400.00 MB
(530.58 million rows/s., 2.12 GB/s.)

SELECT count()
FROM skip_idx_multiple
WHERE created_at > (now() + toIntervalDay(105));

1 rows in set. Elapsed: 0.400 sec. Processed 100.00 million rows, 400.00 MB
(250.28 million rows/s., 1.00 GB/s.)


ALTER TABLE skip_idx_multiple ADD INDEX time_idx time TYPE minmax GRANULARITY 1000;
ALTER TABLE skip_idx_multiple MATERIALIZE INDEX time_idx;

SELECT count()
FROM skip_idx_multiple
WHERE time > (now() + toIntervalDay(105));

1 rows in set. Elapsed: 0.036 sec. Processed 14.02 million rows, 56.08 MB
(391.99 million rows/s., 1.57 GB/s.)


ALTER TABLE skip_idx_multiple ADD INDEX created_at_idx created_at TYPE minmax GRANULARITY 1000;
ALTER TABLE skip_idx_multiple MATERIALIZE INDEX created_at_idx;

SELECT count()
FROM skip_idx_multiple
WHERE created_at > (now() + toIntervalDay(105));

1 rows in set. Elapsed: 0.076 sec. Processed 14.02 million rows, 56.08 MB
(184.90 million rows/s., 739.62 MB/s.)
Condition in query trying to filter outlier value
CREATE TABLE skip_idx_outlier
(
    `key` UInt32,
    `ts` DateTime,
    `value` UInt32
)
ENGINE = MergeTree
PARTITION BY toYYYYMM(ts)
ORDER BY (key, ts);

INSERT INTO skip_idx_outlier SELECT
    number,
    now(),
    rand() % 10
FROM numbers(10000000);

INSERT INTO skip_idx_outlier SELECT
    number,
    now(),
    20
FROM numbers(10);

SELECT count()
FROM skip_idx_outlier
WHERE value > 15;

1 rows in set. Elapsed: 0.059 sec. Processed 10.00 million rows, 40.00 MB
(170.64 million rows/s., 682.57 MB/s.)

ALTER TABLE skip_idx_outlier ADD INDEX value_idx value TYPE minmax GRANULARITY 10;
ALTER TABLE skip_idx_outlier MATERIALIZE INDEX value_idx;

SELECT count()
FROM skip_idx_outlier
WHERE value > 15;

1 rows in set. Elapsed: 0.004 sec.
39.2 - Skip index bloom_filter Example
tested with ClickHouse® 20.8.17.25
Let’s create test data
create table bftest (k Int64, x Array(Int64))
Engine=MergeTree order by k;

insert into bftest select number,
    arrayMap(i->rand64()%565656, range(10)) from numbers(10000000);
insert into bftest select number,
    arrayMap(i->rand64()%565656, range(10)) from numbers(100000000);
Base point (no index)
select count() from bftest where has(x, 42);
┌─count()─┐
│     186 │
└─────────┘
1 rows in set. Elapsed: 0.495 sec.
    Processed 110.00 million rows, 9.68 GB (222.03 million rows/s., 19.54 GB/s.)

select count() from bftest where has(x, -42);
┌─count()─┐
│       0 │
└─────────┘
1 rows in set. Elapsed: 0.505 sec.
    Processed 110.00 million rows, 9.68 GB (217.69 million rows/s., 19.16 GB/s.)
As you can see ClickHouse read 110.00 million rows and the query elapsed Elapsed: 0.505 sec.
Let’s add an index
alter table bftest add index ix1(x) TYPE bloom_filter GRANULARITY 3;

-- GRANULARITY 3 means how many table granules will be in the one index granule
-- In our case 1 granule of skip index allows to check and skip 3*8192 rows.
-- Every dataset is unique sometimes GRANULARITY 1 is better, sometimes
-- GRANULARITY 10.
-- Need to test on the real data.

optimize table bftest final;
-- I need to optimize my table because an index is created for only
-- new parts (inserted or merged)
-- optimize table final re-writes all parts, but with an index.
-- probably in your production you don't need to optimize
-- because your data is rotated frequently.
-- optimize is a heavy operation, better never run optimize table final in a
-- production.
test bloom_filter GRANULARITY 3
select count() from bftest where has(x, 42);
┌─count()─┐
│     186 │
└─────────┘
1 rows in set. Elapsed: 0.063 sec.
    Processed 5.41 million rows, 475.79 MB (86.42 million rows/s., 7.60 GB/s.)

select count() from bftest where has(x, -42);
┌─count()─┐
│       0 │
└─────────┘
1 rows in set. Elapsed: 0.042 sec.
   Processed 1.13 million rows, 99.48 MB (26.79 million rows/s., 2.36 GB/s.)
As you can see I got 10 times boost.
Let’s try to reduce GRANULARITY to drop by 1 table granule
alter  table bftest drop index ix1;
alter table bftest add index ix1(x) TYPE bloom_filter GRANULARITY 1;
optimize table bftest final;

select count() from bftest where has(x, 42);
┌─count()─┐
│     186 │
└─────────┘
1 rows in set. Elapsed: 0.051 sec.
    Processed 3.64 million rows, 320.08 MB (71.63 million rows/s., 6.30 GB/s.)

select count() from bftest where has(x, -42);
┌─count()─┐
│       0 │
└─────────┘
1 rows in set. Elapsed: 0.050 sec.
    Processed 2.06 million rows, 181.67 MB (41.53 million rows/s., 3.65 GB/s.)
No improvement :(
Let’s try to change the false/true probability of the bloom_filter bloom_filter(0.05)
alter  table bftest drop index ix1;
alter table bftest add index ix1(x) TYPE bloom_filter(0.05) GRANULARITY 3;
optimize table bftest final;

select count() from bftest where has(x, 42);
┌─count()─┐
│     186 │
└─────────┘
1 rows in set. Elapsed: 0.079 sec.
    Processed 8.95 million rows, 787.22 MB (112.80 million rows/s., 9.93 GB/s.)

select count() from bftest where has(x, -42);
┌─count()─┐
│       0 │
└─────────┘
1 rows in set. Elapsed: 0.058 sec.
    Processed 3.86 million rows, 339.54 MB (66.83 million rows/s., 5.88 GB/s.)
No improvement.
bloom_filter(0.01)
alter  table bftest drop index ix1;
alter table bftest add index ix1(x) TYPE bloom_filter(0.01) GRANULARITY 3;
optimize table bftest final;

select count() from bftest where has(x, 42);
┌─count()─┐
│     186 │
└─────────┘
1 rows in set. Elapsed: 0.069 sec.
    Processed 5.26 million rows, 462.82 MB (76.32 million rows/s., 6.72 GB/s.)

select count() from bftest where has(x, -42);
┌─count()─┐
│       0 │
└─────────┘
1 rows in set. Elapsed: 0.047 sec.
    Processed 737.28 thousand rows, 64.88 MB (15.72 million rows/s., 1.38 GB/s.)
Also no improvement :(
Outcome: I would use TYPE bloom_filter GRANULARITY 3.
39.3 - Skip indexes examples
bloom_filter
create table bftest (k Int64, x Int64) Engine=MergeTree order by k;

insert into bftest select number, rand64()%565656 from numbers(10000000);
insert into bftest select number, rand64()%565656 from numbers(100000000);

select count() from bftest where x = 42;
┌─count()─┐
│     201 │
└─────────┘
1 rows in set. Elapsed: 0.243 sec. Processed 110.00 million rows


alter table bftest add index ix1(x) TYPE bloom_filter GRANULARITY 1;

alter table bftest materialize index ix1;


select count() from bftest where x = 42;
┌─count()─┐
│     201 │
└─────────┘
1 rows in set. Elapsed: 0.056 sec. Processed 3.68 million rows
minmax
create table bftest (k Int64, x Int64) Engine=MergeTree order by k;

-- data is in x column is correlated with the primary key
insert into bftest select number, number * 2 from numbers(100000000);

alter table bftest add index ix1(x) TYPE minmax GRANULARITY 1;
alter table bftest materialize index ix1;

select count() from bftest where x = 42;
1 rows in set. Elapsed: 0.004 sec. Processed 8.19 thousand rows
projection
create table bftest (k Int64, x Int64, S String) Engine=MergeTree order by k;
insert into bftest select number, rand64()%565656, '' from numbers(10000000);
insert into bftest select number, rand64()%565656, '' from numbers(100000000);
alter table bftest add projection p1 (select k,x order by x);
alter table bftest materialize projection p1 settings mutations_sync=1;
set allow_experimental_projection_optimization=1 ;

-- projection
select count() from bftest where x = 42;
1 rows in set. Elapsed: 0.002 sec. Processed 24.58 thousand rows

-- no projection
select * from bftest where x = 42 format Null;
0 rows in set. Elapsed: 0.432 sec. Processed 110.00 million rows

-- projection
select * from bftest where k in (select k from bftest where x = 42) format Null;
0 rows in set. Elapsed: 0.316 sec. Processed 1.50 million rows
40 - Time zones
Important things to know:
- DateTime inside ClickHouse® is actually UNIX timestamp always, i.e. number of seconds since 1970-01-01 00:00:00 GMT.
- Conversion from that UNIX timestamp to a human-readable form and reverse can happen on the client (for native clients) and on the server (for HTTP clients, and for some type of queries, like
toString(ts)) - Depending on the place where that conversion happened rules of different timezones may be applied.
- You can check server timezone using
SELECT timezone() - clickhouse-client
also by default tries to use server timezone (see also
--use_client_time_zoneflag) - If you want you can store the timezone name inside the data type, in that case, timestamp <-> human-readable time rules of that timezone will be applied.
SELECT
    timezone(),
    toDateTime(now()) AS t,
    toTypeName(t),
    toDateTime(now(), 'UTC') AS t_utc,
    toTypeName(t_utc),
    toUnixTimestamp(t),
    toUnixTimestamp(t_utc)

Row 1:
──────
timezone():                                Europe/Warsaw
t:                                         2021-07-16 12:50:28
toTypeName(toDateTime(now())):             DateTime
t_utc:                                     2021-07-16 10:50:28
toTypeName(toDateTime(now(), 'UTC')):      DateTime('UTC')
toUnixTimestamp(toDateTime(now())):        1626432628
toUnixTimestamp(toDateTime(now(), 'UTC')): 1626432628
Since version 20.4 ClickHouse uses embedded tzdata (see https://github.com/ClickHouse/ClickHouse/pull/10425 )
You get used tzdata version
SELECT *
FROM system.build_options
WHERE name = 'TZDATA_VERSION'

Query id: 0a9883f0-dadf-4fb1-8b42-8fe93f561430

┌─name───────────┬─value─┐
│ TZDATA_VERSION │ 2020e │
└────────────────┴───────┘
and list of available time zones
SELECT *
FROM system.time_zones
WHERE time_zone LIKE '%Anta%'

Query id: 855453d7-eccd-44cb-9631-f63bb02a273c

┌─time_zone─────────────────┐
│ Antarctica/Casey          │
│ Antarctica/Davis          │
│ Antarctica/DumontDUrville │
│ Antarctica/Macquarie      │
│ Antarctica/Mawson         │
│ Antarctica/McMurdo        │
│ Antarctica/Palmer         │
│ Antarctica/Rothera        │
│ Antarctica/South_Pole     │
│ Antarctica/Syowa          │
│ Antarctica/Troll          │
│ Antarctica/Vostok         │
│ Indian/Antananarivo       │
└───────────────────────────┘

13 rows in set. Elapsed: 0.002 sec.
ClickHouse uses system timezone info from tzdata package if it exists, and uses own builtin tzdata if it is missing in the system.
cd /usr/share/zoneinfo/Canada
ln -s ../America/Halifax A

TZ=Canada/A clickhouse-local -q 'select timezone()'
Canada/A
When the conversion using different rules happen
SELECT timezone()

┌─timezone()─┐
│ UTC        │
└────────────┘

create table t_with_dt_utc ( ts DateTime64(3,'Europe/Moscow') ) engine=Log;

create table x (ts String) engine=Null;

create materialized view x_mv to t_with_dt_utc as select parseDateTime64BestEffort(ts) as ts from x;

$ echo '2021-07-15T05:04:23.733' | clickhouse-client -q 'insert into t_with_dt_utc format CSV'
-- here client checks the type of the columns, see that it's 'Europe/Moscow' and use conversion according to moscow rules

$ echo '2021-07-15T05:04:23.733' | clickhouse-client -q 'insert into x format CSV'
-- here client check tha type of the columns (it is string), and pass string value to the server.
-- parseDateTime64BestEffort(ts) uses server default timezone (UTC in my case), and convert the value using UTC rules.
-- and the result is 2 different timestamps (when i selecting from that is shows both in 'desired' timezone, forced by column type, i.e. Moscow):

SELECT * FROM t_with_dt_utc
┌──────────────────────ts─┐
│ 2021-07-15 05:04:23.733 │
│ 2021-07-15 08:04:23.733 │
└─────────────────────────┘
Best practice here: use UTC timezone everywhere, OR use the same default timezone for ClickHouse server as used by your data
41 - Time-series alignment with interpolation
This article demonstrates how to perform time-series data alignment with interpolation using window functions in ClickHouse. The goal is to align two different time-series (A and B) on the same timestamp axis and fill the missing values using linear interpolation.
Step-by-Step Implementation We begin by creating a table with test data that simulates two time-series (A and B) with randomly distributed timestamps and values. Then, we apply interpolation to fill missing values for each time-series based on the surrounding data points.
1. Drop Existing Table (if it exists)
DROP TABLE test_ts_interpolation;
This ensures that any previous versions of the table are removed.
2. Generate Test Data
In this step, we generate random time-series data with timestamps and values for series A and B. The values are calculated differently for each series:
CREATE TABLE test_ts_interpolation
ENGINE = Log AS
SELECT
    ((number * 100) + 50) - (rand() % 100) AS timestamp, -- random timestamp generation
    transform(rand() % 2, [0, 1], ['A', 'B'], '') AS ts, -- randomly assign series 'A' or 'B'
    if(ts = 'A', timestamp * 10, timestamp * 100) AS value -- different value generation for each series
FROM numbers(1000000);
Here, the timestamp is generated randomly and assigned to either series A or B using the transform() function. The value is calculated based on the series type (A or B), with different multipliers for each.
3. Preview the Generated Data
After generating the data, you can inspect it by running a simple SELECT query:
SELECT * FROM test_ts_interpolation;
This will show the randomly generated timestamps, series (A or B), and their corresponding values.
4. Perform Interpolation with Window Functions
To align the time-series and interpolate missing values, we use window functions in the following query:
SELECT
    timestamp,
    if(
        ts = 'A',
        toFloat64(value), -- If the current series is 'A', keep the original value
        prev_a.2 + (timestamp - prev_a.1 ) * (next_a.2 - prev_a.2) / ( next_a.1 - prev_a.1) -- Interpolate for 'A'
    ) as a_value,
    if(
        ts = 'B',
        toFloat64(value), -- If the current series is 'B', keep the original value
        prev_b.2 + (timestamp - prev_b.1 ) * (next_b.2 - prev_b.2) / ( next_b.1 - prev_b.1) -- Interpolate for 'B'
    ) as b_value
FROM
(
    SELECT
        timestamp,
        ts,
        value,
        -- Find the previous and next values for series 'A'
        anyLastIf((timestamp,value), ts='A') OVER (ORDER BY timestamp ROWS BETWEEN UNBOUNDED PRECEDING AND 1 PRECEDING) AS prev_a,
        anyLastIf((timestamp,value), ts='A') OVER (ORDER BY timestamp DESC ROWS BETWEEN UNBOUNDED PRECEDING AND 1 PRECEDING) AS next_a,
        -- Find the previous and next values for series 'B'
        anyLastIf((timestamp,value), ts='B') OVER (ORDER BY timestamp ROWS BETWEEN UNBOUNDED PRECEDING AND 1 PRECEDING) AS prev_b,
        anyLastIf((timestamp,value), ts='B') OVER (ORDER BY timestamp DESC ROWS BETWEEN UNBOUNDED PRECEDING AND 1 PRECEDING) AS next_b
    FROM
    test_ts_interpolation
)
Explanation:
Timestamp Alignment: We align the timestamps of both series (A and B) and handle missing data points.
Interpolation Logic: For each A-series timestamp, if the current series is not A, we calculate the interpolated value using the linear interpolation formula:
interpolated_value = prev_a.2 + ((timestamp - prev_a.1) / (next_a.1 - prev_a.1)) * (next_a.2 - prev_a.2)
Similarly, for the B series, interpolation is calculated between the previous (prev_b) and next (next_b) known values.
Window Functions: anyLastIf() is used to fetch the previous or next values for series A and B based on the timestamps. We use window functions to efficiently calculate these values over the ordered sequence of timestamps.
By using window functions and interpolation, we can align time-series data with irregular timestamps and fill in missing values based on nearby data points. This technique is useful in scenarios where data is recorded at different times or irregular intervals across multiple series.
42 - Top N & Remain
When working with large datasets, you may often need to compute the sum of values for the top N groups and aggregate the remainder separately. This article demonstrates several methods to achieve that in ClickHouse.
Dataset Setup We’ll start by creating a table top_with_rest and inserting data for demonstration purposes:
CREATE TABLE top_with_rest
(
    `k` String,
    `number` UInt64
)
ENGINE = Memory;

INSERT INTO top_with_rest SELECT
    toString(intDiv(number, 10)),
    number
FROM numbers_mt(10000);
This creates a table with 10,000 numbers, grouped by dividing the numbers into tens.
Method 1: Using UNION ALL
This approach retrieves the top 10 groups by sum and aggregates the remaining groups as a separate row.
SELECT *
FROM
(
    SELECT
        k,
        sum(number) AS res
    FROM top_with_rest
    GROUP BY k
    ORDER BY res DESC
    LIMIT 10
    UNION ALL
    SELECT
        NULL,
        sum(number) AS res
    FROM top_with_rest
    WHERE k NOT IN (
        SELECT k
        FROM top_with_rest
        GROUP BY k
        ORDER BY sum(number) DESC
        LIMIT 10
    )
)
ORDER BY res ASC

┌─k───┬───res─┐
│ 990 │ 99045 │
│ 991 │ 99145 │
│ 992 │ 99245 │
│ 993 │ 99345 │
│ 994 │ 99445 │
│ 995 │ 99545 │
│ 996 │ 99645 │
│ 997 │ 99745 │
│ 998 │ 99845 │
│ 999 │ 99945 │
└─────┴───────┘
┌─k────┬──────res─┐
│ null │ 49000050 │
└──────┴──────────┘
Method 2: Using Arrays
In this method, we push the top 10 groups into an array and add a special row for the remainder
WITH toUInt64(sumIf(sum, isNull(k)) - sumIf(sum, isNotNull(k))) AS total
SELECT
    (arrayJoin(arrayPushBack(groupArrayIf(10)((k, sum), isNotNull(k)), (NULL, total))) AS tpl).1 AS key,
    tpl.2 AS res
FROM
(
    SELECT
        toNullable(k) AS k,
        sum(number) AS sum
    FROM top_with_rest
    GROUP BY k
        WITH CUBE
    ORDER BY sum DESC
    LIMIT 11
)
ORDER BY res ASC

┌─key──┬──────res─┐
│ 990  │    99045 │
│ 991  │    99145 │
│ 992  │    99245 │
│ 993  │    99345 │
│ 994  │    99445 │
│ 995  │    99545 │
│ 996  │    99645 │
│ 997  │    99745 │
│ 998  │    99845 │
│ 999  │    99945 │
│ null │ 49000050 │
└──────┴──────────┘
Method 3: Using Window Functions
Window functions, available from ClickHouse version 21.1, provide an efficient way to calculate the sum for the top N rows and the remainder.
SET allow_experimental_window_functions = 1;

SELECT
    k AS key,
    If(isNotNull(key), sum, toUInt64(sum - wind)) AS res
FROM
(
    SELECT
        *,
        sumIf(sum, isNotNull(k)) OVER () AS wind
    FROM
    (
        SELECT
            toNullable(k) AS k,
            sum(number) AS sum
        FROM top_with_rest
        GROUP BY k
            WITH CUBE
        ORDER BY sum DESC
        LIMIT 11
    )
)
ORDER BY res ASC

┌─key──┬──────res─┐
│ 990  │    99045 │
│ 991  │    99145 │
│ 992  │    99245 │
│ 993  │    99345 │
│ 994  │    99445 │
│ 995  │    99545 │
│ 996  │    99645 │
│ 997  │    99745 │
│ 998  │    99845 │
│ 999  │    99945 │
│ null │ 49000050 │
└──────┴──────────┘
Window functions allow efficient summation of the total and top groups in one query.
Method 4: Using Row Number and Grouping
This approach calculates the row number (rn) for each group and replaces the remaining groups with NULL.
SELECT
    k,
    sum(sum) AS res
FROM
(
    SELECT
        if(rn > 10, NULL, k) AS k,
        sum
    FROM
    (
        SELECT
            k,
            sum,
            row_number() OVER () AS rn
        FROM
        (
            SELECT
                k,
                sum(number) AS sum
            FROM top_with_rest
            GROUP BY k
            ORDER BY sum DESC
        )
    )
)
GROUP BY k
ORDER BY res

┌─k────┬──────res─┐
│ 990  │    99045 │
│ 991  │    99145 │
│ 992  │    99245 │
│ 993  │    99345 │
│ 994  │    99445 │
│ 995  │    99545 │
│ 996  │    99645 │
│ 997  │    99745 │
│ 998  │    99845 │
│ 999  │    99945 │
│ null │ 49000050 │
└──────┴──────────┘
This method uses ROW_NUMBER() to segregate the top N from the rest.
Method 5: Using WITH TOTALS
This method includes totals for all groups, and you calculate the remainder on the application side.
SELECT
    k,
    sum(number) AS res
FROM top_with_rest
GROUP BY k
    WITH TOTALS
ORDER BY res DESC
LIMIT 10

┌─k───┬───res─┐
│ 999 │ 99945 │
│ 998 │ 99845 │
│ 997 │ 99745 │
│ 996 │ 99645 │
│ 995 │ 99545 │
│ 994 │ 99445 │
│ 993 │ 99345 │
│ 992 │ 99245 │
│ 991 │ 99145 │
│ 990 │ 99045 │
└─────┴───────┘

Totals:
┌─k─┬──────res─┐
│   │ 49995000 │
└───┴──────────┘
You would subtract the sum of the top rows from the totals in your application.
These methods offer different approaches for handling the Top N rows and aggregating the remainder in ClickHouse. Depending on your requirements—whether you prefer using UNION ALL, arrays, window functions, or totals—each method provides flexibility for efficient querying.
43 - Troubleshooting
Query Execution Logging
When troubleshooting query execution in ClickHouse®, one of the most useful tools is logging the query execution details. This can be controlled using the session-level setting send_logs_level. Here are the different log levels you can use:
Possible values: 'trace', 'debug', 'information', 'warning', 'error', 'fatal', 'none'
This can be used with clickhouse-client in both interactive and non-interactive mode.
The logs provide detailed information about query execution, making it easier to identify issues or bottlenecks. You can use the following command to run a query with logging enabled:
$ clickhouse-client -mn --send_logs_level='trace' --query "SELECT sum(number) FROM numbers(1000)"

-- output --
[LAPTOP] 2021.04.29 00:05:31.425842 [ 25316 ] {14b0646d-8a6e-4b2f-9b13-52a218cf43ba} <Debug> executeQuery: (from 127.0.0.1:42590, using production parser) SELECT sum(number) FROM numbers(1000)
[LAPTOP] 2021.04.29 00:05:31.426281 [ 25316 ] {14b0646d-8a6e-4b2f-9b13-52a218cf43ba} <Trace> ContextAccess (default): Access granted: CREATE TEMPORARY TABLE ON *.*
[LAPTOP] 2021.04.29 00:05:31.426648 [ 25316 ] {14b0646d-8a6e-4b2f-9b13-52a218cf43ba} <Trace> InterpreterSelectQuery: FetchColumns -> Complete
[LAPTOP] 2021.04.29 00:05:31.427132 [ 25448 ] {14b0646d-8a6e-4b2f-9b13-52a218cf43ba} <Trace> AggregatingTransform: Aggregating
[LAPTOP] 2021.04.29 00:05:31.427187 [ 25448 ] {14b0646d-8a6e-4b2f-9b13-52a218cf43ba} <Trace> Aggregator: Aggregation method: without_key
[LAPTOP] 2021.04.29 00:05:31.427220 [ 25448 ] {14b0646d-8a6e-4b2f-9b13-52a218cf43ba} <Debug> AggregatingTransform: Aggregated. 1000 to 1 rows (from 7.81 KiB) in 0.0004469 sec. (2237637.0552696353 rows/sec., 17.07 MiB/sec.)
[LAPTOP] 2021.04.29 00:05:31.427233 [ 25448 ] {14b0646d-8a6e-4b2f-9b13-52a218cf43ba} <Trace> Aggregator: Merging aggregated data
[LAPTOP] 2021.04.29 00:05:31.427875 [ 25316 ] {14b0646d-8a6e-4b2f-9b13-52a218cf43ba} <Information> executeQuery: Read 1000 rows, 7.81 KiB in 0.0019463 sec., 513795 rows/sec., 3.92 MiB/sec.
[LAPTOP] 2021.04.29 00:05:31.427898 [ 25316 ] {14b0646d-8a6e-4b2f-9b13-52a218cf43ba} <Debug> MemoryTracker: Peak memory usage (for query): 0.00 B.
499500
You can also redirect the logs to a file for further analysis:
$ clickhouse-client -mn --send_logs_level='trace' --query "SELECT sum(number) FROM numbers(1000)" 2> ./query.log
Analyzing Logs in System Tables
If you need to analyze the logs after executing a query, you can query the system tables to retrieve the execution details.
Query Log: You can fetch query logs from the system.query_log table:
LAPTOP.localdomain :) SET send_logs_level='trace';

SET send_logs_level = 'trace'

Query id: cbbffc02-283e-48ef-93e2-8b3baced6689

Ok.

0 rows in set. Elapsed: 0.003 sec.

LAPTOP.localdomain :) SELECT sum(number) FROM numbers(1000);

SELECT sum(number)
FROM numbers(1000)

Query id: d3db767b-34e9-4252-9f90-348cf958f822

[LAPTOP] 2021.04.29 00:06:51.673836 [ 25316 ] {d3db767b-34e9-4252-9f90-348cf958f822} <Debug> executeQuery: (from 127.0.0.1:43116, using production parser) SELECT sum(number) FROM numbers(1000);
[LAPTOP] 2021.04.29 00:06:51.674167 [ 25316 ] {d3db767b-34e9-4252-9f90-348cf958f822} <Trace> ContextAccess (default): Access granted: CREATE TEMPORARY TABLE ON *.*
[LAPTOP] 2021.04.29 00:06:51.674419 [ 25316 ] {d3db767b-34e9-4252-9f90-348cf958f822} <Trace> InterpreterSelectQuery: FetchColumns -> Complete
[LAPTOP] 2021.04.29 00:06:51.674748 [ 25449 ] {d3db767b-34e9-4252-9f90-348cf958f822} <Trace> AggregatingTransform: Aggregating
[LAPTOP] 2021.04.29 00:06:51.674781 [ 25449 ] {d3db767b-34e9-4252-9f90-348cf958f822} <Trace> Aggregator: Aggregation method: without_key
[LAPTOP] 2021.04.29 00:06:51.674855 [ 25449 ] {d3db767b-34e9-4252-9f90-348cf958f822} <Debug> AggregatingTransform: Aggregated. 1000 to 1 rows (from 7.81 KiB) in 0.0003299 sec. (3031221.582297666 rows/sec., 23.13 MiB/sec.)
[LAPTOP] 2021.04.29 00:06:51.674883 [ 25449 ] {d3db767b-34e9-4252-9f90-348cf958f822} <Trace> Aggregator: Merging aggregated data
┌─sum(number)─┐
│      499500 │
└─────────────┘
[LAPTOP] 2021.04.29 00:06:51.675481 [ 25316 ] {d3db767b-34e9-4252-9f90-348cf958f822} <Information> executeQuery: Read 1000 rows, 7.81 KiB in 0.0015799 sec., 632951 rows/sec., 4.83 MiB/sec.
[LAPTOP] 2021.04.29 00:06:51.675508 [ 25316 ] {d3db767b-34e9-4252-9f90-348cf958f822} <Debug> MemoryTracker: Peak memory usage (for query): 0.00 B.

1 rows in set. Elapsed: 0.007 sec. Processed 1.00 thousand rows, 8.00 KB (136.43 thousand rows/s., 1.09 MB/s.)
Analyzing Logs in System Tables
# Query Log: You can fetch query logs from the system.query_log table:

SELECT sum(number)
FROM numbers(1000);

Query id: 34c61093-3303-47d0-860b-0d644fa7264b

┌─sum(number)─┐
│      499500 │
└─────────────┘

1 row in set. Elapsed: 0.002 sec. Processed 1.00 thousand rows, 8.00 KB (461.45 thousand rows/s., 3.69 MB/s.)

SELECT *
FROM system.query_log
WHERE (event_date = today()) AND (query_id = '34c61093-3303-47d0-860b-0d644fa7264b');

# Query Thread Log: If thread-level logging is enabled (log_query_threads = 1), retrieve logs using:
# To capture detailed thread-level logs, enable log_query_threads: (SET log_query_threads = 1;)

SELECT *
FROM system.query_thread_log
WHERE (event_date = today()) AND (query_id = '34c61093-3303-47d0-860b-0d644fa7264b');

# OpenTelemetry Span Log: For detailed tracing with OpenTelemetry, if enabled (opentelemetry_start_trace_probability = 1), use:
# To enable OpenTelemetry tracing for queries, set: (SET opentelemetry_start_trace_probability = 1, opentelemetry_trace_processors = 1)

SELECT *
FROM system.opentelemetry_span_log
WHERE (trace_id, finish_date) IN (
    SELECT
        trace_id,
        finish_date
    FROM system.opentelemetry_span_log
    WHERE ((attribute['clickhouse.query_id']) = '34c61093-3303-47d0-860b-0d644fa7264b') AND (finish_date = today())
);
Visualizing Query Performance with Flamegraphs
ClickHouse supports exporting query performance data in a format compatible with speedscope.app. This can help you visualize performance bottlenecks within queries. Example query to generate a flamegraph: https://www.speedscope.app/
WITH
    '95578e1c-1e93-463c-916c-a1a8cdd08198' AS query,
    min(min) AS start_value,
    max(max) AS end_value,
    groupUniqArrayArrayArray(trace_arr) AS uniq_frames,
    arrayMap((x, a, b) -> ('sampled', b, 'none', start_value, end_value, arrayMap(s -> reverse(arrayMap(y -> toUInt32(indexOf(uniq_frames, y) - 1), s)), x), a), groupArray(trace_arr), groupArray(weights), groupArray(trace_type)) AS samples
SELECT
    concat('clickhouse-server@', version()) AS exporter,
    'https://www.speedscope.app/file-format-schema.json' AS `$schema`,
    concat('ClickHouse query id: ', query) AS name,
    CAST(samples, 'Array(Tuple(type String, name String, unit String, startValue UInt64, endValue UInt64, samples Array(Array(UInt32)), weights Array(UInt32)))') AS profiles,
    CAST(tuple(arrayMap(x -> (demangle(addressToSymbol(x)), addressToLine(x)), uniq_frames)), 'Tuple(frames Array(Tuple(name String, line String)))') AS shared
FROM
(
    SELECT
        min(min_ns) AS min,
        trace_type,
        max(max_ns) AS max,
        groupArray(trace) AS trace_arr,
        groupArray(cnt) AS weights
    FROM
    (
        SELECT
            min(timestamp_ns) AS min_ns,
            max(timestamp_ns) AS max_ns,
            trace,
            trace_type,
            count() AS cnt
        FROM system.trace_log
        WHERE query_id = query
        GROUP BY
            trace_type,
            trace
    )
    GROUP BY trace_type
)
SETTINGS allow_introspection_functions = 1, output_format_json_named_tuples_as_objects = 1
FORMAT JSONEachRow
And query to generate traces per thread
WITH
    '8e7e0616-cfaf-43af-a139-d938ced7655a' AS query,
    min(min) AS start_value,
    max(max) AS end_value,
    groupUniqArrayArrayArray(trace_arr) AS uniq_frames,
    arrayMap((x, a, b, c, d) -> ('sampled', concat(b, ' - thread ', c.1, ' - traces ', c.2), 'nanoseconds', d.1 - start_value, d.2 - start_value, arrayMap(s -> reverse(arrayMap(y -> toUInt32(indexOf(uniq_frames, y) - 1), s)), x), a), groupArray(trace_arr), groupArray(weights), groupArray(trace_type), groupArray((thread_id, total)), groupArray((min, max))) AS samples
SELECT
    concat('clickhouse-server@', version()) AS exporter,
    'https://www.speedscope.app/file-format-schema.json' AS `$schema`,
    concat('ClickHouse query id: ', query) AS name,
    CAST(samples, 'Array(Tuple(type String, name String, unit String, startValue UInt64, endValue UInt64, samples Array(Array(UInt32)), weights Array(UInt32)))') AS profiles,
    CAST(tuple(arrayMap(x -> (demangle(addressToSymbol(x)), addressToLine(x)), uniq_frames)), 'Tuple(frames Array(Tuple(name String, line String)))') AS shared
FROM
(
    SELECT
        min(min_ns) AS min,
        trace_type,
        thread_id,
        max(max_ns) AS max,
        groupArray(trace) AS trace_arr,
        groupArray(cnt) AS weights,
        sum(cnt) as total
    FROM
    (
        SELECT
            min(timestamp_ns) AS min_ns,
            max(timestamp_ns) AS max_ns,
            trace,
            trace_type,
            thread_id,
            sum(if(trace_type IN ('Memory', 'MemoryPeak', 'MemorySample'), size, 1)) AS cnt
        FROM system.trace_log
        WHERE query_id = query
        GROUP BY
            trace_type,
            trace,
            thread_id
    )
    GROUP BY
        trace_type,
        thread_id
    ORDER BY
        trace_type ASC,
        total DESC
)
SETTINGS allow_introspection_functions = 1, output_format_json_named_tuples_as_objects = 1, output_format_json_quote_64bit_integers=1
FORMAT JSONEachRow
By enabling detailed logging and tracing, you can effectively diagnose issues and optimize query performance in ClickHouse.
44 - TTL
44.1 - MODIFY (ADD) TTL in ClickHouse®
For a general overview of TTL, see the article Putting Things Where They Belong Using New TTL Moves .
ALTER TABLE tbl MODIFY (ADD) TTL:
It’s 2 step process:
ALTER TABLE tbl MODIFY (ADD) TTL ...
Update table metadata: schema .sql & metadata in ZK. It’s usually cheap and fast command. And any new INSERT after schema change will calculate TTL according to new rule.
ALTER TABLE tbl MATERIALIZE TTL
Recalculate TTL for already exist parts.
It can be heavy operation, because ClickHouse® will read column data & recalculate TTL & apply TTL expression.
You can disable this step completely by using materialize_ttl_after_modify user session setting (by default it’s 1, so materialization is enabled).
SET materialize_ttl_after_modify=0;
ALTER TABLE tbl MODIFY TTL
If you will disable materialization of TTL, it does mean that all old parts will be transformed according OLD TTL rules. MATERIALIZE TTL:
- Recalculate TTL (Kinda cheap, it read only column participate in TTL)
- Apply TTL (Rewrite of table data for all columns)
You also can only disable apply TTL substep via materialize_ttl_recalculate_only merge_tree setting (by default it’s 0, so clickhouse will apply TTL expression)
ALTER TABLE tbl MODIFY SETTING materialize_ttl_recalculate_only=1;
It does mean, that TTL rule will not be applied during ALTER TABLE tbl MODIFY (ADD) TTL ... query and data is now going to be rewritten.
After this you can apply TTL (MATERIALIZE) per partition manually (which will apply the TTL and rewrite data)
ALTER TABLE tbl MATERIALIZE TTL [IN PARTITION partition | IN PARTITION ID 'partition_id'];
The idea of materialize_ttl_after_modify = 0 and materialize_ttl_recalculate_only = 1 is to use ALTER TABLE tbl MATERIALIZE TTL IN PARTITION xxx; ALTER TABLE tbl MATERIALIZE TTL IN PARTITION yyy; and materialize TTL gently or drop/move partitions manually until the old data without/old TTL is processed.
MATERIALIZE TTL done via Mutation:
- ClickHouse create new parts via hardlinks and write new ttl.txt file
- ClickHouse remove old(inactive) parts after remove time (default is 8 minutes)
To stop materialization of TTL:
SELECT * FROM system.mutations WHERE is_done=0 AND table = 'tbl';
KILL MUTATION WHERE command LIKE '%MATERIALIZE TTL%' AND table = 'tbl'
MODIFY TTL MOVE
today: 2022-06-02
Table tbl
Daily partitioning by toYYYYMMDD(timestamp) -> 20220602
Increase of TTL
TTL timestamp + INTERVAL 30 DAY MOVE TO DISK s3 -> TTL timestamp + INTERVAL 60 DAY MOVE TO DISK s3
- Idea: ClickHouse need to move data from s3 to local disk BACK
- Actual: There is no rule that data earlier than 60 DAY should be on local disk
Table parts:
20220401    ttl: 20220501       disk: s3
20220416    ttl: 20220516       disk: s3
20220501    ttl: 20220531       disk: s3
20220502    ttl: 20220601       disk: local
20220516    ttl: 20220616       disk: local
20220601    ttl: 20220631       disk: local
ALTER TABLE tbl MODIFY TTL timestamp + INTERVAL 60 DAY MOVE TO DISK s3;
Table parts:
20220401    ttl: 20220601       disk: s3
20220416    ttl: 20220616       disk: s3
20220501    ttl: 20220631       disk: s3        (ClickHouse will not move this part to local disk, because there is no TTL rule for that)
20220502    ttl: 20220701       disk: local
20220516    ttl: 20220716       disk: local
20220601    ttl: 20220731       disk: local
Decrease of TTL
TTL timestamp + INTERVAL 30 DAY MOVE TO DISK s3 -> TTL timestamp + INTERVAL 14 DAY MOVE TO DISK s3
Table parts:
20220401    ttl: 20220401       disk: s3
20220416    ttl: 20220516       disk: s3
20220501    ttl: 20220531       disk: s3
20220502    ttl: 20220601       disk: local
20220516    ttl: 20220616       disk: local
20220601    ttl: 20220631       disk: local
ALTER TABLE tbl MODIFY TTL timestamp + INTERVAL 14 DAY MOVE TO DISK s3;
Table parts:
20220401    ttl: 20220415       disk: s3
20220416    ttl: 20220501       disk: s3
20220501    ttl: 20220515       disk: s3
20220502    ttl: 20220517       disk: local     (ClickHouse will move this part to disk s3 in background according to TTL rule)
20220516    ttl: 20220601       disk: local     (ClickHouse will move this part to disk s3 in background according to TTL rule)
20220601    ttl: 20220616       disk: local
Possible TTL Rules
TTL:
DELETE          (With enabled `ttl_only_drop_parts`, it's cheap operation, ClickHouse will drop the whole part)
MOVE
GROUP BY
WHERE
RECOMPRESS
Related settings:
Server settings:
background_move_processing_pool_thread_sleep_seconds                        |   10      |
background_move_processing_pool_thread_sleep_seconds_random_part            |   1.0     |
background_move_processing_pool_thread_sleep_seconds_if_nothing_to_do       |   0.1     |
background_move_processing_pool_task_sleep_seconds_when_no_work_min         |   10      |
background_move_processing_pool_task_sleep_seconds_when_no_work_max         |   600     |
background_move_processing_pool_task_sleep_seconds_when_no_work_multiplier  |   1.1     |
background_move_processing_pool_task_sleep_seconds_when_no_work_random_part |   1.0     |
MergeTree settings:
merge_with_ttl_timeout                      │   14400   │       0 │ Minimal time in seconds, when merge with delete TTL can be repeated.
merge_with_recompression_ttl_timeout        │   14400   │       0 │ Minimal time in seconds, when merge with recompression TTL can be repeated.
max_replicated_merges_with_ttl_in_queue     │   1       │       0 │ How many tasks of merging parts with TTL are allowed simultaneously in ReplicatedMergeTree queue.
max_number_of_merges_with_ttl_in_pool       │   2       │       0 │ When there is more than specified number of merges with TTL entries in pool, do not assign new merge with TTL. This is to leave free threads for regular merges and avoid "Too many parts"
ttl_only_drop_parts                         │   0       │       0 │ Only drop altogether the expired parts and not partially prune them.
Session settings:
materialize_ttl_after_modify │ 1 │ 0 │ Apply TTL for old data, after ALTER MODIFY TTL query
44.2 - What are my TTL settings?
Using SHOW CREATE TABLE
If you just want to see the current TTL settings on a table, you can look at the schema definition.
SHOW CREATE TABLE events2_local
FORMAT Vertical

Query id: eba671e5-6b8c-4a81-a4d8-3e21e39fb76b

Row 1:
──────
statement: CREATE TABLE default.events2_local
(
    `EventDate` DateTime,
    `EventID` UInt32,
    `Value` String
)
ENGINE = ReplicatedMergeTree('/clickhouse/{cluster}/tables/{shard}/default/events2_local', '{replica}')
PARTITION BY toYYYYMM(EventDate)
ORDER BY (EventID, EventDate)
TTL EventDate + toIntervalMonth(1)
SETTINGS index_granularity = 8192
This works even when there’s no data in the table. It does not tell you when the TTLs expire or anything specific to data in one or more of the table parts.
Using system.parts
If you want to see the actually TTL values for specific data, run a query on system.parts. There are columns listing all currently applicable TTL limits for each part. (It does not work if the table is empty because there aren’t any parts yet.)
SELECT *
FROM system.parts
WHERE (database = 'default') AND (table = 'events2_local')
FORMAT Vertical

Query id: 59106476-210f-4397-b843-9920745b6200

Row 1:
──────
partition:                             202203
name:                                  202203_0_0_0
...
database:                              default
table:                                 events2_local
...
delete_ttl_info_min:                   2022-04-27 21:26:30
delete_ttl_info_max:                   2022-04-27 21:26:30
move_ttl_info.expression:              []
move_ttl_info.min:                     []
move_ttl_info.max:                     []
default_compression_codec:             LZ4
recompression_ttl_info.expression:     []
recompression_ttl_info.min:            []
recompression_ttl_info.max:            []
group_by_ttl_info.expression:          []
group_by_ttl_info.min:                 []
group_by_ttl_info.max:                 []
rows_where_ttl_info.expression:        []
rows_where_ttl_info.min:               []
rows_where_ttl_info.max:               []
44.3 - TTL GROUP BY Examples
Example with MergeTree table
CREATE TABLE test_ttl_group_by
(
    `key` UInt32,
    `ts` DateTime,
    `value` UInt32,
    `min_value` UInt32 DEFAULT value,
    `max_value` UInt32 DEFAULT value
)
ENGINE = MergeTree
PARTITION BY toYYYYMM(ts)
ORDER BY (key, toStartOfDay(ts))
TTL ts + interval 30 day
    GROUP BY key, toStartOfDay(ts)
    SET value = sum(value),
    min_value = min(min_value),
    max_value = max(max_value),
    ts = min(toStartOfDay(ts));
During TTL merges ClickHouse® re-calculates values of columns in the SET section.
GROUP BY section should be a prefix of a table’s PRIMARY KEY (the same as ORDER BY, if no separate PRIMARY KEY defined).
-- stop merges to demonstrate data before / after
-- a rolling up
SYSTEM STOP TTL MERGES test_ttl_group_by;
SYSTEM STOP MERGES test_ttl_group_by;

INSERT INTO test_ttl_group_by (key, ts, value)
SELECT
    number % 5,
    now() + number,
    1
FROM numbers(100);

INSERT INTO test_ttl_group_by (key, ts, value)
SELECT
    number % 5,
    now() - interval 60 day + number,
    2
FROM numbers(100);

SELECT
    toYYYYMM(ts) AS m,
    count(),
    sum(value),
    min(min_value),
    max(max_value)
FROM test_ttl_group_by
GROUP BY m;
┌──────m─┬─count()─┬─sum(value)─┬─min(min_value)─┬─max(max_value)─┐
│ 202102 │     100 │        200 │              2 │              2 │
│ 202104 │     100 │        100 │              1 │              1 │
└────────┴─────────┴────────────┴────────────────┴────────────────┘

SYSTEM START TTL MERGES test_ttl_group_by;
SYSTEM START MERGES test_ttl_group_by;
OPTIMIZE TABLE test_ttl_group_by FINAL;

SELECT
    toYYYYMM(ts) AS m,
    count(),
    sum(value),
    min(min_value),
    max(max_value)
FROM test_ttl_group_by
GROUP BY m;
┌──────m─┬─count()─┬─sum(value)─┬─min(min_value)─┬─max(max_value)─┐
│ 202102 │       5 │        200 │              2 │              2 │
│ 202104 │     100 │        100 │              1 │              1 │
└────────┴─────────┴────────────┴────────────────┴────────────────┘
As you can see 100 rows were rolled up into 5 rows (key has 5 values) for rows older than 30 days.
Example with SummingMergeTree table
CREATE TABLE test_ttl_group_by
(
    `key1` UInt32,
    `key2` UInt32,
    `ts` DateTime,
    `value` UInt32,
    `min_value` SimpleAggregateFunction(min, UInt32)
                                       DEFAULT value,
    `max_value` SimpleAggregateFunction(max, UInt32)
                                       DEFAULT value
)
ENGINE = SummingMergeTree
PARTITION BY toYYYYMM(ts)
PRIMARY KEY (key1, key2, toStartOfDay(ts))
ORDER BY (key1, key2, toStartOfDay(ts), ts)
TTL ts + interval 30 day
    GROUP BY key1, key2, toStartOfDay(ts)
    SET value = sum(value),
    min_value = min(min_value),
    max_value = max(max_value),
    ts = min(toStartOfDay(ts));

-- stop merges to demonstrate data before / after
-- a rolling up
SYSTEM STOP TTL MERGES test_ttl_group_by;
SYSTEM STOP MERGES test_ttl_group_by;

INSERT INTO test_ttl_group_by (key1, key2, ts, value)
SELECT
    1,
    1,
    toStartOfMinute(now() + number*60),
    1
FROM numbers(100);

INSERT INTO test_ttl_group_by (key1, key2, ts, value)
SELECT
    1,
    1,
    toStartOfMinute(now() + number*60),
    1
FROM numbers(100);

INSERT INTO test_ttl_group_by (key1, key2, ts, value)
SELECT
    1,
    1,
    toStartOfMinute(now() + number*60 - toIntervalDay(60)),
    2
FROM numbers(100);

INSERT INTO test_ttl_group_by (key1, key2, ts, value)
SELECT
    1,
    1,
    toStartOfMinute(now() + number*60 - toIntervalDay(60)),
    2
FROM numbers(100);

SELECT
    toYYYYMM(ts) AS m,
    count(),
    sum(value),
    min(min_value),
    max(max_value)
FROM test_ttl_group_by
GROUP BY m;

┌──────m─┬─count()─┬─sum(value)─┬─min(min_value)─┬─max(max_value)─┐
│ 202102 │     200 │        400 │              2 │              2 │
│ 202104 │     200 │        200 │              1 │              1 │
└────────┴─────────┴────────────┴────────────────┴────────────────┘

SYSTEM START TTL MERGES test_ttl_group_by;
SYSTEM START MERGES test_ttl_group_by;
OPTIMIZE TABLE test_ttl_group_by FINAL;

SELECT
    toYYYYMM(ts) AS m,
    count(),
    sum(value),
    min(min_value),
    max(max_value)
FROM test_ttl_group_by
GROUP BY m;

┌──────m─┬─count()─┬─sum(value)─┬─min(min_value)─┬─max(max_value)─┐
│ 202102 │       1 │        400 │              2 │              2 │
│ 202104 │     100 │        200 │              1 │              1 │
└────────┴─────────┴────────────┴────────────────┴────────────────┘
During merges ClickHouse re-calculates ts columns as min(toStartOfDay(ts)). It’s possible only for the last column of SummingMergeTree ORDER BY section ORDER BY (key1, key2, toStartOfDay(ts), ts) otherwise it will break the order of rows in the table.
Example with AggregatingMergeTree table
CREATE TABLE test_ttl_group_by_agg
(
    `key1` UInt32,
    `key2` UInt32,
    `ts` DateTime,
    `counter` AggregateFunction(count, UInt32)
)
ENGINE = AggregatingMergeTree
PARTITION BY toYYYYMM(ts)
PRIMARY KEY (key1, key2, toStartOfDay(ts))
ORDER BY (key1, key2, toStartOfDay(ts), ts)
TTL ts + interval 30 day
    GROUP BY key1, key2, toStartOfDay(ts)
    SET counter = countMergeState(counter),
    ts = min(toStartOfDay(ts));

CREATE TABLE test_ttl_group_by_raw
(
    `key1` UInt32,
    `key2` UInt32,
    `ts` DateTime
) ENGINE = Null;

CREATE MATERIALIZED VIEW test_ttl_group_by_mv
    TO test_ttl_group_by_agg
AS
SELECT
    `key1`,
    `key2`,
    `ts`,
    countState() as counter
FROM test_ttl_group_by_raw
GROUP BY key1, key2, ts;

-- stop merges to demonstrate data before / after
-- a rolling up
SYSTEM STOP TTL MERGES test_ttl_group_by_agg;
SYSTEM STOP MERGES test_ttl_group_by_agg;

INSERT INTO test_ttl_group_by_raw (key1, key2, ts)
SELECT
    1,
    1,
    toStartOfMinute(now() + number*60)
FROM numbers(100);

INSERT INTO test_ttl_group_by_raw (key1, key2, ts)
SELECT
    1,
    1,
    toStartOfMinute(now() + number*60)
FROM numbers(100);

INSERT INTO test_ttl_group_by_raw (key1, key2, ts)
SELECT
    1,
    1,
    toStartOfMinute(now() + number*60 - toIntervalDay(60))
FROM numbers(100);

INSERT INTO test_ttl_group_by_raw (key1, key2, ts)
SELECT
    1,
    1,
    toStartOfMinute(now() + number*60 - toIntervalDay(60))
FROM numbers(100);

SELECT
    toYYYYMM(ts) AS m,
    count(),
    countMerge(counter)
FROM test_ttl_group_by_agg
GROUP BY m;

┌──────m─┬─count()─┬─countMerge(counter)─┐
│ 202307 │     200 │                 200 │
│ 202309 │     200 │                 200 │
└────────┴─────────┴─────────────────────┘

SYSTEM START TTL MERGES test_ttl_group_by_agg;
SYSTEM START MERGES test_ttl_group_by_agg;
OPTIMIZE TABLE test_ttl_group_by_agg FINAL;

SELECT
    toYYYYMM(ts) AS m,
    count(),
    countMerge(counter)
FROM test_ttl_group_by_agg
GROUP BY m;

┌──────m─┬─count()─┬─countMerge(counter)─┐
│ 202307 │       1 │                 200 │
│ 202309 │     100 │                 200 │
└────────┴─────────┴─────────────────────┘
Multilevel TTL Group by
CREATE TABLE test_ttl_group_by
(
    `key` UInt32,
    `ts` DateTime,
    `value` UInt32,
    `min_value` UInt32 DEFAULT value,
    `max_value` UInt32 DEFAULT value
)
ENGINE = MergeTree
PARTITION BY toYYYYMM(ts)
ORDER BY (key, toStartOfWeek(ts), toStartOfDay(ts), toStartOfHour(ts))
TTL
ts + interval 1 hour
GROUP BY key, toStartOfWeek(ts), toStartOfDay(ts), toStartOfHour(ts)
    SET value = sum(value),
    min_value = min(min_value),
    max_value = max(max_value),
    ts = min(toStartOfHour(ts)),
ts + interval 1 day
GROUP BY key, toStartOfWeek(ts), toStartOfDay(ts)
    SET value = sum(value),
    min_value = min(min_value),
    max_value = max(max_value),
    ts = min(toStartOfDay(ts)),
ts + interval 30 day
GROUP BY key, toStartOfWeek(ts)
    SET value = sum(value),
    min_value = min(min_value),
    max_value = max(max_value),
    ts = min(toStartOfWeek(ts));

SYSTEM STOP TTL MERGES test_ttl_group_by;
SYSTEM STOP MERGES test_ttl_group_by;

INSERT INTO test_ttl_group_by (key, ts, value)
SELECT
    number % 5,
    now() + number,
    1
FROM numbers(100);

INSERT INTO test_ttl_group_by (key, ts, value)
SELECT
    number % 5,
    now() - interval 2 hour + number,
    2
FROM numbers(100);

INSERT INTO test_ttl_group_by (key, ts, value)
SELECT
    number % 5,
    now() - interval 2 day + number,
    3
FROM numbers(100);

INSERT INTO test_ttl_group_by (key, ts, value)
SELECT
    number % 5,
    now() - interval 2 month + number,
    4
FROM numbers(100);

SELECT
    toYYYYMMDD(ts) AS d,
    count(),
    sum(value),
    min(min_value),
    max(max_value)
FROM test_ttl_group_by
GROUP BY d
ORDER BY d;

┌────────d─┬─count()─┬─sum(value)─┬─min(min_value)─┬─max(max_value)─┐
│ 20210616 │     100 │        400 │              4 │              4 │
│ 20210814 │     100 │        300 │              3 │              3 │
│ 20210816 │     200 │        300 │              1 │              2 │
└──────────┴─────────┴────────────┴────────────────┴────────────────┘

SYSTEM START TTL MERGES test_ttl_group_by;
SYSTEM START MERGES test_ttl_group_by;
OPTIMIZE TABLE test_ttl_group_by FINAL;

SELECT
    toYYYYMMDD(ts) AS d,
    count(),
    sum(value),
    min(min_value),
    max(max_value)
FROM test_ttl_group_by
GROUP BY d
ORDER BY d;

┌────────d─┬─count()─┬─sum(value)─┬─min(min_value)─┬─max(max_value)─┐
│ 20210613 │       5 │        400 │              4 │              4 │
│ 20210814 │       5 │        300 │              3 │              3 │
│ 20210816 │     105 │        300 │              1 │              2 │
└──────────┴─────────┴────────────┴────────────────┴────────────────┘
TTL GROUP BY + DELETE
CREATE TABLE test_ttl_group_by
(
    `key` UInt32,
    `ts` DateTime,
    `value` UInt32,
    `min_value` UInt32 DEFAULT value,
    `max_value` UInt32 DEFAULT value
)
ENGINE = MergeTree
PARTITION BY toYYYYMM(ts)
ORDER BY (key, toStartOfDay(ts))
TTL
ts + interval 180 day,
ts + interval 30 day
    GROUP BY key, toStartOfDay(ts)
    SET value = sum(value),
    min_value = min(min_value),
    max_value = max(max_value),
    ts = min(toStartOfDay(ts));

-- stop merges to demonstrate data before / after
-- a rolling up
SYSTEM STOP TTL MERGES test_ttl_group_by;
SYSTEM STOP MERGES test_ttl_group_by;

INSERT INTO test_ttl_group_by (key, ts, value)
SELECT
    number % 5,
    now() + number,
    1
FROM numbers(100);

INSERT INTO test_ttl_group_by (key, ts, value)
SELECT
    number % 5,
    now() - interval 60 day + number,
    2
FROM numbers(100);

INSERT INTO test_ttl_group_by (key, ts, value)
SELECT
    number % 5,
    now() - interval 200 day + number,
    3
FROM numbers(100);

SELECT
    toYYYYMM(ts) AS m,
    count(),
    sum(value),
    min(min_value),
    max(max_value)
FROM test_ttl_group_by
GROUP BY m;

┌──────m─┬─count()─┬─sum(value)─┬─min(min_value)─┬─max(max_value)─┐
│ 202101 │     100 │        300 │              3 │              3 │
│ 202106 │     100 │        200 │              2 │              2 │
│ 202108 │     100 │        100 │              1 │              1 │
└────────┴─────────┴────────────┴────────────────┴────────────────┘

SYSTEM START TTL MERGES test_ttl_group_by;
SYSTEM START MERGES test_ttl_group_by;
OPTIMIZE TABLE test_ttl_group_by FINAL;

┌──────m─┬─count()─┬─sum(value)─┬─min(min_value)─┬─max(max_value)─┐
│ 202106 │       5 │        200 │              2 │              2 │
│ 202108 │     100 │        100 │              1 │              1 │
└────────┴─────────┴────────────┴────────────────┴────────────────┘
Also see the Altinity Knowledge Base pages on the MergeTree table engine family .
44.4 - TTL Recompress example
See also the Altinity Knowledge Base article on testing different compression codecs .
Example how to create a table and define recompression rules
CREATE TABLE hits
(
    `banner_id` UInt64,
    `event_time` DateTime CODEC(Delta, Default),
    `c_name` String,
    `c_cost` Float64
)
ENGINE = MergeTree
PARTITION BY toYYYYMM(event_time)
ORDER BY (banner_id, event_time)
TTL event_time + toIntervalMonth(1) RECOMPRESS CODEC(ZSTD(1)),
    event_time + toIntervalMonth(6) RECOMPRESS CODEC(ZSTD(6);
Default compression is LZ4. See the ClickHouse® documentation for more information.
These TTL rules recompress data after 1 and 6 months.
CODEC(Delta, Default) – Default means to use default compression (LZ4 -> ZSTD1 -> ZSTD6) in this case.
Example how to define recompression rules for an existing table
CREATE TABLE hits
(
    `banner_id` UInt64,
    `event_time` DateTime CODEC(Delta, LZ4),
    `c_name` String,
    `c_cost` Float64
)
ENGINE = MergeTree
PARTITION BY toYYYYMM(event_time)
ORDER BY (banner_id, event_time);

ALTER TABLE hits
  modify column event_time DateTime CODEC(Delta, Default),
  modify TTL event_time + toIntervalMonth(1) RECOMPRESS CODEC(ZSTD(1)),
       event_time + toIntervalMonth(6) RECOMPRESS CODEC(ZSTD(6));
All columns have implicit default compression from server config, except event_time, that’s why need to change to compression to Default for this column otherwise it won’t be recompressed.
45 - UPDATE via Dictionary
CREATE TABLE test_update
(
    `key` UInt32,
    `value` String
)
ENGINE = MergeTree
ORDER BY key;

INSERT INTO test_update SELECT
    number,
    concat('value ', toString(number))
FROM numbers(20);

SELECT *
FROM test_update;

┌─key─┬─value────┐
│   0 │ value 0  │
│   1 │ value 1  │
│   2 │ value 2  │
│   3 │ value 3  │
│   4 │ value 4  │
│   5 │ value 5  │
│   6 │ value 6  │
│   7 │ value 7  │
│   8 │ value 8  │
│   9 │ value 9  │
│  10 │ value 10 │
│  11 │ value 11 │
│  12 │ value 12 │
│  13 │ value 13 │
│  14 │ value 14 │
│  15 │ value 15 │
│  16 │ value 16 │
│  17 │ value 17 │
│  18 │ value 18 │
│  19 │ value 19 │
└─────┴──────────┘

CREATE TABLE test_update_source
(
    `key` UInt32,
    `value` String
)
ENGINE = MergeTree
ORDER BY key;

INSERT INTO test_update_source VALUES (1,'other value'), (10, 'new value');

CREATE DICTIONARY update_dict
(
    `key` UInt32,
    `value` String
)
PRIMARY KEY key
SOURCE(CLICKHOUSE(TABLE 'test_update_source'))
LIFETIME(MIN 0 MAX 10)
LAYOUT(FLAT);

SELECT dictGet('default.update_dict', 'value', toUInt64(1));

┌─dictGet('default.update_dict', 'value', toUInt64(1))─┐
│ other value                                          │
└──────────────────────────────────────────────────────┘

ALTER TABLE test_update
    UPDATE value = dictGet('default.update_dict', 'value', toUInt64(key)) WHERE dictHas('default.update_dict', toUInt64(key));

SELECT *
FROM test_update

┌─key─┬─value───────┐
│   0 │ value 0     │
│   1 │ other value │
│   2 │ value 2     │
│   3 │ value 3     │
│   4 │ value 4     │
│   5 │ value 5     │
│   6 │ value 6     │
│   7 │ value 7     │
│   8 │ value 8     │
│   9 │ value 9     │
│  10 │ new value   │
│  11 │ value 11    │
│  12 │ value 12    │
│  13 │ value 13    │
│  14 │ value 14    │
│  15 │ value 15    │
│  16 │ value 16    │
│  17 │ value 17    │
│  18 │ value 18    │
│  19 │ value 19    │
└─────┴─────────────┘
Info
In case of Replicated installation, Dictionary should be created on all nodes and source tables should use the ReplicatedMergeTree engine and be replicated across all nodes.Info
Starting from 20.4, ClickHouse® forbid by default any potential non-deterministic mutations. This behavior controlled by settingallow_nondeterministic_mutations. You can append it to query like this ALTER TABLE xxx UPDATE ... WHERE ... SETTINGS allow_nondeterministic_mutations = 1;
For ON CLUSTER queries, you would need to put this setting in default profile and restart ClickHouse servers.46 - Values mapping
SELECT count()
FROM numbers_mt(1000000000)
WHERE NOT ignore(transform(number % 3, [0, 1, 2, 3], ['aa', 'ab', 'ad', 'af'], 'a0'))

1 rows in set. Elapsed: 4.668 sec. Processed 1.00 billion rows, 8.00 GB (214.21 million rows/s., 1.71 GB/s.)

SELECT count()
FROM numbers_mt(1000000000)
WHERE NOT ignore(multiIf((number % 3) = 0, 'aa', (number % 3) = 1, 'ab', (number % 3) = 2, 'ad', (number % 3) = 3, 'af', 'a0'))

1 rows in set. Elapsed: 7.333 sec. Processed 1.00 billion rows, 8.00 GB (136.37 million rows/s., 1.09 GB/s.)

SELECT count()
FROM numbers_mt(1000000000)
WHERE NOT ignore(CAST(number % 3 AS Enum('aa' = 0, 'ab' = 1, 'ad' = 2, 'af' = 3)'))

1 rows in set. Elapsed: 1.152 sec. Processed 1.00 billion rows, 8.00 GB (867.79 million rows/s., 6.94 GB/s.)
47 - Window functions
Resources:
- Tutorial: ClickHouse® Window Functions
- Video: Fun with ClickHouse Window Functions
- Blog: Battle of the Views: ClickHouse Window View vs. Live View
How Do I Simulate Window Functions Using Arrays on older versions of ClickHouse?
- Group with groupArray.
- Calculate the needed metrics.
- Ungroup back using arrayJoin.
NTILE
SELECT intDiv((num - 1) - (cnt % 3), 3) AS ntile
FROM
(
    SELECT
        row_number() OVER (ORDER BY number ASC) AS num,
        count() OVER () AS cnt
    FROM numbers(11)
)

┌─ntile─┐
│     0 │
│     0 │
│     0 │
│     0 │
│     0 │
│     1 │
│     1 │
│     1 │
│     2 │
│     2 │
│     2 │
└───────┘