Learn about ClickHouse® engines, from MergeTree, Atomic Database to RocksDB.
Generally: the main engine in ClickHouse® is called MergeTree
. It allows to store and process data on one server and feel all the advantages of ClickHouse. Basic usage of MergeTree does not require any special configuration, and you can start using it ‘out of the box’.
But one server and one copy of data are not fault-tolerant - something can happen with the server itself, with datacenter availability, etc. So you need to have the replica(s) - i.e. server(s) with the same data and which can ‘substitute’ the original server at any moment.
To have an extra copy (replica) of your data you need to use ReplicatedMergeTree
engine. It can be used instead of MergeTree engine, and you can always upgrade from MergeTree to ReplicatedMergeTree (and downgrade back) if you need. To use that you need to have
ZooKeeper installed
and running. For tests, you can use one standalone Zookeeper instance, but for production usage, you should have zookeeper ensemble at least of 3 servers.
When you use ReplicatedMergeTree then the inserted data is copied automatically to all the replicas, but all the SELECTs are executed on the single server you have connected to. So you can have 5 replicas of your data, but if you will always connect to one replica - it will not ‘share’ / ‘balance’ that traffic automatically between all the replicas, one server will be loaded and the rest will generally do nothing. If you need that balancing of load between multiple replicas - you can use the internal ’loadbalancer’ mechanism which is provided by Distributed engine of ClickHouse. As an alternative in that scenario you can work without Distributed table
, but with some external load balancer that will balance the requests between several replicas according to your specific rules or preferences, or just cluster-aware client which will pick one of the servers for the query time.
The Distributed engine does not store any data, but it can ‘point’ to the same ReplicatedMergeTree/MergeTree table on multiple servers. To use Distributed engine you need to configure <cluster> settings in your ClickHouse server config file.
So let’s say you have 3 replicas of table my_replicated_data with ReplicatedMergeTree engine. You can create a table with Distributed engine called my_distributed_replicated_data which will ‘point’ to all of that 3 servers, and when you will select from that my_distributed_replicated_data table the select will be forwarded and executed on one of the replicas. So in that scenario, each replica will get 1/3 of requests (but each request still will be fully executed on one chosen replica).
All that is great, and will work well while one copy of your data is fitting on a single physical server, and can be processed by the resources of one server. When you have too much data to be stored/processed on one server - you need to use sharding (it’s just a way to split the data into smaller parts). Sharding is the mechanism also provided by Distributed engine.
With sharding data is divided into parts (shards) according to some sharding key. You can just use random distribution, so let’s say - throw a coin to decide on each of the servers the data should be stored, or you can use some ‘smarter’ sharding scheme, to make the data connected to the same subject (let’s say to the same customer) stored on one server, and to another subject on another. So in that case all the shards should be requested at the same time and later the ‘common’ result should be calculated.
In ClickHouse each shard works independently and process its part of data, inside each shard replication can work. And later to query all the shards at the same time and combine the final result - Distributed engine is used. So Distributed work as load balancer inside each shard, and can combine the data coming from different shards together to make the ‘common’ result.
You can use Distributed table for inserts, in that case, it will pass the data to one of the shards according to the sharding key. Or you can insert to the underlying table on one of the shards bypassing the Distributed table.
Short summary
start with MergeTree
to have several copies of data use ReplicatedMergeTree
if your data is too big to fit/ to process on one server - use sharding
to balance the load between replicas and to combine the result of selects from different shards - use Distributed table
.
P.S. Actually you can create replication without Zookeeper and ReplicatedMergeTree, just by using the Distributed table above MergeTree and internal_replication=false cluster setting, but in that case, there will be no guarantee that all the replicas will have 100% the same data, so I rather would not recommend that scenario.
In version 20.5, ClickHouse® first introduced database engine=Atomic.
Since version 20.10 it is a default database engine (before engine=Ordinary was used).
Those 2 database engine differs in a way how they store data on a filesystem, and engine Atomic allows to resolve some of the issues existed in engine=Ordinary.
engine=Atomic supports
non-blocking drop table / rename table
tables delete (&detach) async (wait for selects finish but invisible for new selects)
atomic drop table (all files / folders removed)
atomic table swap (table swap by “EXCHANGE TABLES t1 AND t2;”)
rename dictionary / rename database
unique automatic UUID paths in FS and ZK for Replicated
FAQ
Q. Data is not removed immediately
A. UseDROP TABLE t SYNC;
Or use parameter (user level) database_atomic_wait_for_drop_and_detach_synchronously:
It’s very important that the table will have the same UUID cluster-wide.
When the table is created using ON CLUSTER - all tables will get the same UUID automatically.
When it needs to be done manually (for example - you need to add one more replica), pick CREATE TABLE statement with UUID from one of the existing replicas.
setshow_table_uuid_in_table_create_qquery_if_not_nil=1;SHOWCREATETABLExxx;/* or SELECT create_table_query FROM system.tables WHERE ... */
Q. Should I use Atomic or Ordinary for new setups?
All things inside ClickHouse itself should work smoothly with Atomic.
But some external tools - backup tools, things involving other kinds of direct manipulations with ClickHouse files & folders may have issues with Atomic.
Ordinary layout on the filesystem is simpler. And the issues which address Atomic (lock-free renames, drops, atomic exchange of table) are not so critical in most cases.
Ordinary
Atomic
filesystem layout
very simple
more complicated
external tool support (like clickhouse-backup)
good / mature
good / mature
some DDL queries (DROP / RENAME) may
hang for a long time (waiting for some other things)
yes 👎
no 👍
Possibility to swap 2 tables
rename a to a_old, b to a,
a_old to b;
Operation is not atomic, and can break in the middle (while chances are low).
EXCHANGE TABLES t1 AND t2
Atomic, have no intermediate states.
uuid in zookeeper path
Not possible to use.
The typical pattern is to add version suffix to zookeeper path when you
need to create the new version of the same table.
You can use uuid in zookeeper paths. That requires some extra care when you expand the cluster, and makes zookeeper
paths harder to map to real table.
But allows to to do any kind of manipulations on tables (rename, recreate
with same name etc).
Materialized view without TO syntax
(!we recommend using TO syntax always!)
.inner.mv_name
The name is predictable, easy to match with MV.
.inner_id.{uuid}
The name is unpredictable, hard to match with MV (maybe problematic for
MV chains, and similar scenarios)
Implemented automatic conversion of database engine from Ordinary to Atomic (ClickHouse® Server 22.8+). Create empty convert_ordinary_to_atomic file in flags directory and all Ordinary databases will be converted automatically on next server start.
The conversion is not automatic between upgrades, you need to set the flag as explained below:
Warnings:
* Server has databases (for example `test`) with Ordinary engine, which was deprecated. To convert this database to the new Atomic engine, create a flag /var/lib/clickhouse/flags/convert_ordinary_to_atomic and make sure that ClickHouse has write permission for it.
Example: sudo touch '/var/lib/clickhouse/flags/convert_ordinary_to_atomic' && sudo chmod 666 '/var/lib/clickhouse/flags/convert_ordinary_to_atomic'
Don’t forget to remove detached parts from all Ordinary databases, or you can get the error:
│ 2025.01.28 11:34:57.510330 [ 7 ] {} <Error> Application: Code: 219. DB::Exception: Cannot drop: filesystem error: in remove: Directory not empty ["/var/lib/clickhouse/data/db/"]. Probably data │
│ base contain some detached tables or metadata leftovers from Ordinary engine. If you want to remove all data anyway, try to attach database back and drop it again with enabled force_remove_data_recursively_ │
1.1.2 - How to Convert Atomic to Ordinary
How to Convert Atomic to Ordinary
The following instructions are an example on how to convert a database with the Engine type Atomic to a database with the Engine type Ordinary.
Warning
That can be used only for simple schemas. Schemas with MATERIALIZED views will require extra manipulations.
DROPDATABASEIFEXISTSatomic_db;DROPDATABASEIFEXISTSordinary_db;CREATEDATABASEatomic_dbengine=Atomic;CREATEDATABASEordinary_dbengine=Ordinary;CREATETABLEatomic_db.xENGINE=MergeTreeORDERBYtuple()ASsystem.numbers;CREATEMATERIALIZEDVIEWatomic_db.x_mvENGINE=MergeTreeORDERBYtuple()ASSELECT*FROMatomic_db.x;CREATEMATERIALIZEDVIEWatomic_db.y_mvENGINE=MergeTreeORDERBYtuple()ASSELECT*FROMatomic_db.x;CREATETABLEatomic_db.zENGINE=MergeTreeORDERBYtuple()ASsystem.numbers;CREATEMATERIALIZEDVIEWatomic_db.z_mvTOatomic_db.zASSELECT*FROMatomic_db.x;INSERTINTOatomic_db.xSELECT*FROMnumbers(100);--- USE atomic_db;
---
--- Query id: 28af886d-a339-4e9c-979c-8bdcfb32fd95
---
--- ┌─name───────────────────────────────────────────┐
--- │ .inner_id.b7906fec-f4b2-455b-bf9b-2b18ca64842c │
--- │ .inner_id.bd32d79b-272d-4710-b5ad-bca78d09782f │
--- │ x │
--- │ x_mv │
--- │ y_mv │
--- │ z │
--- │ z_mv │
--- └────────────────────────────────────────────────┘
SELECTmv_storage.database,mv_storage.name,mv.database,mv.nameFROMsystem.tablesASmv_storageLEFTJOINsystem.tablesASmvONsubstring(mv_storage.name,11)=toString(mv.uuid)WHEREmv_storage.nameLIKE'.inner_id.%'ANDmv_storage.database='atomic_db';-- ┌─database──┬─name───────────────────────────────────────────┬─mv.database─┬─mv.name─┐
-- │ atomic_db │ .inner_id.81e1a67d-3d02-4b2a-be17-84d8626d2328 │ atomic_db │ y_mv │
-- │ atomic_db │ .inner_id.e428225c-982a-4859-919b-ba5026db101d │ atomic_db │ x_mv │
-- └───────────┴────────────────────────────────────────────────┴─────────────┴─────────┘
/* STEP 1: prepare rename statements, also to rename implicit mv storage table to explicit one */SELECTif(t.nameLIKE'.inner_id.%','RENAME TABLE `'||t.database||'`.`'||t.name||'` TO `ordinary_db`.`'||mv.name||'_storage`;','RENAME TABLE `'||t.database||'`.`'||t.name||'` TO `ordinary_db`.`'||t.name||'`;')FROMsystem.tablesastLEFTJOINsystem.tablesmvON(substring(t.name,11)=toString(mv.uuid)ANDt.database=mv.database)WHEREt.database='atomic_db'ANDt.engine<>'MaterializedView'FORMATTSVRaw;-- RENAME TABLE `atomic_db`.`.inner_id.b7906fec-f4b2-455b-bf9b-2b18ca64842c` TO `ordinary_db`.`y_mv_storage`;
-- RENAME TABLE `atomic_db`.`.inner_id.bd32d79b-272d-4710-b5ad-bca78d09782f` TO `ordinary_db`.`x_mv_storage`;
-- RENAME TABLE `atomic_db`.`x` TO `ordinary_db`.`x`;
-- RENAME TABLE `atomic_db`.`z` TO `ordinary_db`.`z`;
/* STEP 2: prepare statements to reattach MV */-- Can be done manually: pick existing MV definition (SHOW CREATE TABLE), and change it in the following way:
-- 1) add TO keyword 2) remove column names and engine settings after mv name
SELECTif(t.nameLIKE'.inner_id.%',replaceRegexpOne(mv.create_table_query,'^CREATE MATERIALIZED VIEW ([^ ]+) (.*? AS ','CREATE MATERIALIZED VIEW \\1 TO \\1_storage AS '),mv.create_table_query)FROMsystem.tablesasmvLEFTJOINsystem.tablestON(substring(t.name,11)=toString(mv.uuid)ANDt.database=mv.database)WHEREmv.database='atomic_db'ANDmv.engine='MaterializedView'FORMATTSVRaw;-- CREATE MATERIALIZED VIEW atomic_db.x_mv TO atomic_db.x_mv_storage AS SELECT * FROM atomic_db.x
-- CREATE MATERIALIZED VIEW atomic_db.y_mv TO atomic_db.y_mv_storage AS SELECT * FROM atomic_db.x
/* STEP 3: stop inserts, fire renames statements prepared at the step 1 (hint: use clickhouse-client -mn) */RENAME.../* STEP 4: ensure that only MaterializedView left in source db, and drop it. */SELECT*FROMsystem.tablesWHEREdatabase='atomic_db'andengine<>'MaterializedView';DROPDATABASEatomic_db;/* STEP 4. rename table to old name: */DETACHDATABASEordinary_db;-- rename files / folders:
mv/var/lib/clickhouse/metadata/ordinary_db.sql/var/lib/clickhouse/metadata/atomic_db.sqlvi/var/lib/clickhouse/metadata/atomic_db.sqlmv/var/lib/clickhouse/metadata/ordinary_db/var/lib/clickhouse/metadata/atomic_dbmv/var/lib/clickhouse/data/ordinary_db/var/lib/clickhouse/data/atomic_db-- attach database atomic_db;
ATTACHDATABASEatomic_db;/* STEP 5. restore MV using statements created on STEP 2 */
1.2 - EmbeddedRocksDB & dictionary
EmbeddedRocksDB & dictionary
RocksDB is faster than
MergeTree
on Key/Value queries because MergeTree primary key index is sparse. Probably it’s possible to speedup MergeTree by reducing index_granularity.
NVMe disk is used for the tests.
The main feature of RocksDB is instant updates. You can update a row instantly (microseconds):
partitionid is quite simple (it just comes from your partitioning key).
What are block_numbers?
DROP TABLE IF EXISTS part_names;
create table part_names (date Date, n UInt8, m UInt8) engine=MergeTree PARTITION BY toYYYYMM(date) ORDER BY n;
insert into part_names VALUES (now(), 0, 0);
select name, partition_id, min_block_number, max_block_number, level, data_version from system.parts where table = 'part_names' and active;
┌─name─────────┬─partition_id─┬─min_block_number─┬─max_block_number─┬─level─┬─data_version─┐
│ 202203_1_1_0 │ 202203 │ 1 │ 1 │ 0 │ 1 │
└──────────────┴──────────────┴──────────────────┴──────────────────┴───────┴──────────────┘
insert into part_names VALUES (now(), 0, 0);
select name, partition_id, min_block_number, max_block_number, level, data_version from system.parts where table = 'part_names' and active;
┌─name─────────┬─partition_id─┬─min_block_number─┬─max_block_number─┬─level─┬─data_version─┐
│ 202203_1_1_0 │ 202203 │ 1 │ 1 │ 0 │ 1 │
│ 202203_2_2_0 │ 202203 │ 2 │ 2 │ 0 │ 2 │
│ 202203_3_3_0 │ 202203 │ 3 │ 3 │ 0 │ 3 │
└──────────────┴──────────────┴──────────────────┴──────────────────┴───────┴──────────────┘
As you can see every insert creates a new incremental block_number which is written in part names both as <min_block_number> and <min_block_number>
(and the level is 0 meaning that the part was never merged).
Those block numbering works in the scope of partition (for Replicated table) or globally across all partition (for plain MergeTree table).
ClickHouse® always merge only continuous blocks . And new part names always refer to the minimum and maximum block numbers.
As you can see here - three parts (with block number 1,2,3) were merged and they formed the new part with name 1_3 as min/max block size.
Level get incremented.
Now even while previous (merged) parts still exists in filesystem for a while (as inactive) ClickHouse is smart enough to understand
that new part ‘covers’ same range of blocks as 3 parts of the prev ‘generation’
There might be a fifth section in the part name, data version.
1.3.3 - How to pick an ORDER BY / PRIMARY KEY / PARTITION BY for the MergeTree family table
Optimizing ClickHouse® MergeTree tables
Good order by usually has 3 to 5 columns, from lowest cardinal on the left (and the most important for filtering) to highest cardinal (and less important for filtering).
Practical approach to create a good ORDER BY for a table:
Pick the columns you use in filtering always
The most important for filtering and the lowest cardinal should be the left-most. Typically, it’s something like tenant_id
Next column is more cardinal, less important. It can be a rounded time sometimes, or site_id, or source_id, or group_id or something similar.
Repeat step 3 once again (or a few times)
If you already added all columns important for filtering and you’re still not addressing a single row with your pk - you can add more columns which can help to put similar records close to each other (to improve the compression)
If you have something like hierarchy / tree-like relations between the columns - put there the records from ‘root’ to ’leaves’ for example (continent, country, cityname). This way ClickHouse® can do a lookup by country/city even if the continent is not specified (it will just ‘check all continents’)
special variants of MergeTree may require special ORDER BY to make the record unique etc.
For timeseries
, it usually makes sense to put the timestamp as the latest column in ORDER BY, which helps with putting the same data nearby for better locality. There are only 2 major patterns for timestamps in ORDER BY: (…, toStartOf(Day|Hour|…)(timestamp), …, timestamp) and (…, timestamp). The first one is useful when you often query a small part of a table partition. (table partitioned by months, and you read only 1-4 days 90% of the time).
There are exceptions to the rule “low cordinality - first” related to compression ratio. For example, data with a lot of repeated attributes in rows (like clickstream), ordering by session_id will benefit compression and reduce disk read, while setting a low cardinality column (like event type) in the first place makes compression and overall query time worse.
Some examples of good ORDER BY:
ORDER BY (tenantid, site_id, utm_source, clientid, timestamp)
ORDER BY (site_id, toStartOfHour(timestamp), sessionid, timestamp )
PRIMARY KEY (site_id, toStartOfHour(timestamp), sessionid)
All dimensions go to ORDER BY, all metrics - outside of that.
The most important for filtering columns with the lowest cardinality should be the left-most.
If the number of dimensions is high, it typically makes sense to use a prefix of ORDER BY as a PRIMARY KEY to avoid polluting the sparse index.
Examples:
ORDER BY (tenant_id, hour, country_code, team_id, group_id, source_id)
PRIMARY KEY (tenant_id, hour, country_code, team_id)
For Replacing / Collapsing
You need to keep all ‘mutable’ columns outside of ORDER BY, and have some unique id (a base to collapse duplicates) inside.
Typically the right-most column is some row identifier. And it’s often not needed in sparse index (so PRIMARY KEY can be a prefix of ORDER BY)
The rest consideration are the same.
Examples:
ORDER BY (tenantid, site_id, eventid) -- utm_source is mutable, while tenantid, site_id is not
PRIMARY KEY (tenantid, site_id) -- eventid is not used for filtering, needed only for collapsing duplicates
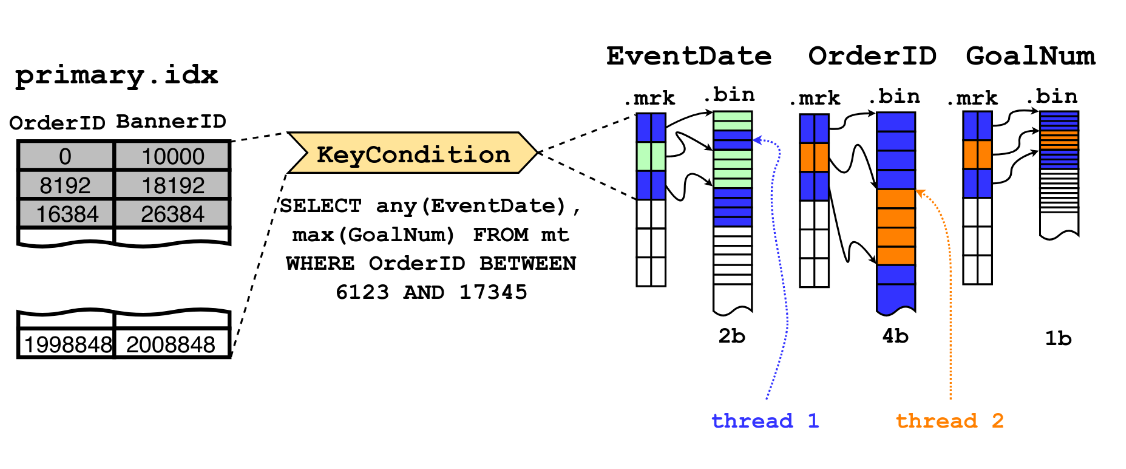
Here for the filtering it will use the skipping index to select the parts WHERE col1 > xxx and the result won’t be need to be ordered because the ORDER BY in the query aligns with the ORDER BY in the table and the data is already ordered in disk. (FWIW, Alexander Zaitsev and Mikhail Filimonov wrote a great post on skipping indexes and how they work
for the Altinity blog.)
executeQuery: (from [::ffff:192.168.11.171]:39428, user: admin) SELECT * FROM order_test WHERE col1 > toDateTime('2020-10-01') ORDER BY col1,col2 FORMAT Null;(stage: Complete)ContextAccess (admin): Access granted: SELECT(col1, col2) ON tests.order_test
ContextAccess (admin): Access granted: SELECT(col1, col2) ON tests.order_test
InterpreterSelectQuery: FetchColumns -> Complete
tests.order_test (SelectExecutor): Key condition: (column 0 in [1601503201, +Inf))tests.order_test (SelectExecutor): MinMax index condition: (column 0 in [1601503201, +Inf))tests.order_test (SelectExecutor): Running binary search on index range for part 202010_367_545_8 (7612 marks)tests.order_test (SelectExecutor): Running binary search on index range for part 202010_549_729_12 (37 marks)tests.order_test (SelectExecutor): Running binary search on index range for part 202011_689_719_2 (1403 marks)tests.order_test (SelectExecutor): Running binary search on index range for part 202012_550_730_12 (3 marks)tests.order_test (SelectExecutor): Found (LEFT) boundary mark: 0tests.order_test (SelectExecutor): Found (LEFT) boundary mark: 0tests.order_test (SelectExecutor): Found (LEFT) boundary mark: 0tests.order_test (SelectExecutor): Found (RIGHT) boundary mark: 37tests.order_test (SelectExecutor): Found (RIGHT) boundary mark: 3tests.order_test (SelectExecutor): Found (RIGHT) boundary mark: 1403tests.order_test (SelectExecutor): Found continuous range in 11 steps
tests.order_test (SelectExecutor): Found continuous range in 3 steps
tests.order_test (SelectExecutor): Running binary search on index range for part 202011_728_728_0 (84 marks)tests.order_test (SelectExecutor): Found continuous range in 21 steps
tests.order_test (SelectExecutor): Running binary search on index range for part 202011_725_725_0 (128 marks)tests.order_test (SelectExecutor): Found (LEFT) boundary mark: 0tests.order_test (SelectExecutor): Found (LEFT) boundary mark: 0tests.order_test (SelectExecutor): Found (RIGHT) boundary mark: 84tests.order_test (SelectExecutor): Running binary search on index range for part 202011_722_722_0 (128 marks)tests.order_test (SelectExecutor): Found continuous range in 13 steps
tests.order_test (SelectExecutor): Found (RIGHT) boundary mark: 128tests.order_test (SelectExecutor): Found continuous range in 14 steps
tests.order_test (SelectExecutor): Running binary search on index range for part 202011_370_686_19 (5993 marks)tests.order_test (SelectExecutor): Found (LEFT) boundary mark: 0tests.order_test (SelectExecutor): Found (RIGHT) boundary mark: 5993tests.order_test (SelectExecutor): Found (LEFT) boundary mark: 0tests.order_test (SelectExecutor): Found continuous range in 25 steps
tests.order_test (SelectExecutor): Found (RIGHT) boundary mark: 128tests.order_test (SelectExecutor): Found continuous range in 14 steps
tests.order_test (SelectExecutor): Found (LEFT) boundary mark: 0tests.order_test (SelectExecutor): Found (RIGHT) boundary mark: 7612tests.order_test (SelectExecutor): Found continuous range in 25 steps
tests.order_test (SelectExecutor): Selected 8/9 parts by partition key, 8 parts by primary key, 15380/15380 marks by primary key, 15380 marks to read from 8 ranges
Ok.
0 rows in set. Elapsed: 0.649 sec. Processed 125.97 million rows, 629.86 MB (194.17 million rows/s., 970.84 MB/s.)
If we change the ORDER BY expression in the query, ClickHouse will need to retrieve the rows and reorder them:
As seen In the MergingSortedTransform message, the ORDER BY in the table definition is not aligned with the ORDER BY in the query, so ClickHouse has to reorder the resultset.
executeQuery: (from [::ffff:192.168.11.171]:39428, user: admin) SELECT * FROM order_test WHERE col1 > toDateTime('2020-10-01') ORDER BY col2,col1 FORMAT Null;(stage: Complete)ContextAccess (admin): Access granted: SELECT(col1, col2) ON tests.order_test
ContextAccess (admin): Access granted: SELECT(col1, col2) ON tests.order_test
InterpreterSelectQuery: FetchColumns -> Complete
tests.order_test (SelectExecutor): Key condition: (column 0 in [1601503201, +Inf))tests.order_test (SelectExecutor): MinMax index condition: (column 0 in [1601503201, +Inf))tests.order_test (SelectExecutor): Running binary search on index range for part 202010_367_545_8 (7612 marks)tests.order_test (SelectExecutor): Running binary search on index range for part 202012_550_730_12 (3 marks)tests.order_test (SelectExecutor): Found (LEFT) boundary mark: 0tests.order_test (SelectExecutor): Running binary search on index range for part 202011_725_725_0 (128 marks)tests.order_test (SelectExecutor): Found (RIGHT) boundary mark: 3tests.order_test (SelectExecutor): Running binary search on index range for part 202011_689_719_2 (1403 marks)tests.order_test (SelectExecutor): Running binary search on index range for part 202010_549_729_12 (37 marks)tests.order_test (SelectExecutor): Running binary search on index range for part 202011_728_728_0 (84 marks)tests.order_test (SelectExecutor): Found (LEFT) boundary mark: 0tests.order_test (SelectExecutor): Found continuous range in 3 steps
tests.order_test (SelectExecutor): Found (LEFT) boundary mark: 0tests.order_test (SelectExecutor): Found (LEFT) boundary mark: 0tests.order_test (SelectExecutor): Found (LEFT) boundary mark: 0tests.order_test (SelectExecutor): Running binary search on index range for part 202011_722_722_0 (128 marks)tests.order_test (SelectExecutor): Found (RIGHT) boundary mark: 7612tests.order_test (SelectExecutor): Found (RIGHT) boundary mark: 37tests.order_test (SelectExecutor): Found (LEFT) boundary mark: 0tests.order_test (SelectExecutor): Found continuous range in 11 steps
tests.order_test (SelectExecutor): Found (RIGHT) boundary mark: 1403tests.order_test (SelectExecutor): Found (RIGHT) boundary mark: 84tests.order_test (SelectExecutor): Found continuous range in 25 steps
tests.order_test (SelectExecutor): Running binary search on index range for part 202011_370_686_19 (5993 marks)tests.order_test (SelectExecutor): Found continuous range in 21 steps
tests.order_test (SelectExecutor): Found (RIGHT) boundary mark: 128tests.order_test (SelectExecutor): Found continuous range in 13 steps
tests.order_test (SelectExecutor): Found (LEFT) boundary mark: 0tests.order_test (SelectExecutor): Found continuous range in 14 steps
tests.order_test (SelectExecutor): Found (RIGHT) boundary mark: 128tests.order_test (SelectExecutor): Found (LEFT) boundary mark: 0tests.order_test (SelectExecutor): Found continuous range in 14 steps
tests.order_test (SelectExecutor): Found (RIGHT) boundary mark: 5993tests.order_test (SelectExecutor): Found continuous range in 25 steps
tests.order_test (SelectExecutor): Selected 8/9 parts by partition key, 8 parts by primary key, 15380/15380 marks by primary key, 15380 marks to read from 8 ranges
tests.order_test (SelectExecutor): MergingSortedTransform: Merge sorted 1947 blocks, 125972070 rows in 1.423973879 sec., 88465155.05499662 rows/sec., 423.78 MiB/sec
Ok.
0 rows in set. Elapsed: 1.424 sec. Processed 125.97 million rows, 629.86 MB (88.46 million rows/s., 442.28 MB/s.)
PARTITION BY
Things to consider:
Good size for single partition is something like 1-300Gb.
For Summing/Replacing a bit smaller (400Mb-40Gb)
Better to avoid touching more that few dozens of partitions with typical SELECT query.
Single insert should bring data to one or few partitions.
The number of partitions in table - dozen or hundreds, not thousands.
The size of partitions you can check in system.parts table.
Examples:
-- for time-series:
PARTITION BY toYear(timestamp) -- long retention, not too much data
PARTITION BY toYYYYMM(timestamp) --
PARTITION BY toMonday(timestamp) --
PARTITION BY toDate(timestamp) --
PARTITION BY toStartOfHour(timestamp) -- short retention, lot of data
-- for table with some incremental (non time-bounded) counter
PARTITION BY intDiv(transaction_id, 1000000)
-- for some dimention tables (always requested with WHERE userid)
PARTITION BY userid % 16
For the small tables (smaller than few gigabytes) partitioning is usually not needed at all (just skip PARTITION BY expression when you create the table).
CREATE TABLE test_last
(
`col1` Int32,
`col2` SimpleAggregateFunction(anyLast, Nullable(DateTime)),
`col3` SimpleAggregateFunction(anyLast, Nullable(DateTime))
)
ENGINE = AggregatingMergeTree
ORDER BY col1
Ok.
0 rows in set. Elapsed: 0.003 sec.
INSERT INTO test_last (col1, col2) VALUES (1, now());
Ok.
1 rows in set. Elapsed: 0.014 sec.
INSERT INTO test_last (col1, col3) VALUES (1, now())
Ok.
1 rows in set. Elapsed: 0.006 sec.
SELECT
col1,
anyLast(col2),
anyLast(col3)
FROM test_last
GROUP BY col1
┌─col1─┬───────anyLast(col2)─┬───────anyLast(col3)─┐
│ 1 │ 2020-01-16 20:57:46 │ 2020-01-16 20:57:51 │
└──────┴─────────────────────┴─────────────────────┘
1 rows in set. Elapsed: 0.005 sec.
SELECT *
FROM test_last
FINAL
┌─col1─┬────────────────col2─┬────────────────col3─┐
│ 1 │ 2020-01-16 20:57:46 │ 2020-01-16 20:57:51 │
└──────┴─────────────────────┴─────────────────────┘
1 rows in set. Elapsed: 0.003 sec.
Merge two data streams
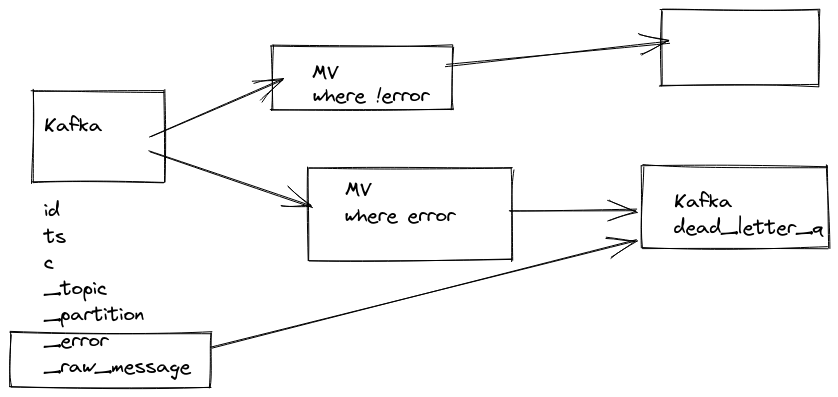
Q. I have 2 Kafka topics from which I am storing events into 2 different tables (A and B) having the same unique ID. I want to create a single table that combines the data in tables A and B into one table C. The problem is that data is received asynchronously and not all the data is available when a row arrives in Table A or vice-versa.
A. You can use AggregatingMergeTree with Nullable columns and any aggregation function or Non-Nullable column and max aggregation function if it is acceptable for your data.
CREATE TABLE table_C (
id Int64,
colA SimpleAggregatingFunction(any,Nullable(UInt32)),
colB SimpleAggregatingFunction(max, String)
) ENGINE = AggregatingMergeTree()
ORDER BY id;
CREATE MATERIALIZED VIEW mv_A TO table_C AS
SELECT id,colA FROM Kafka_A;
CREATE MATERIALIZED VIEW mv_B TO table_C AS
SELECT id,colB FROM Kafka_B;
Schema (especially compression codecs, some bad types, sorting order…)
Horizontal vs Vertical merge
Horizontal = reads all columns at once, do merge sort, write new part
Vertical = first read columns from order by, do merge sort, write them to disk, remember permutation, then process the rest of columns on by one, applying permutation.
Horizontal merge used by default, will use more memory if there are more than 80 columns in the table
OPTIMIZE TABLE example FINAL DEDUPLICATE BY expr
When using
deduplicate
feature in OPTIMIZE FINAL, the question is which row will remain and won’t be deduped?
For SELECT operations ClickHouse® does not guarantee the order of the resultset unless you specify ORDER BY. This random ordering is affected by different parameters, like for example max_threads.
In a merge operation ClickHouse reads rows sequentially in storage order, which is determined by ORDER BY specified in CREATE TABLE statement, and only the first unique row in that order survives deduplication. So it is a bit different from how SELECT actually works. As FINAL clause is used then ClickHouse will merge all rows across all partitions (If it is not specified then the merge operation will be done per partition), and so the first unique row of the first partition will survive deduplication. Merges are single-threaded because it is too complicated to apply merge ops in-parallel, and it generally makes no sense.
ReplacingMergeTree
is a powerful ClickHouse® MergeTree engine. It is one of the techniques that can be used to guarantee unicity or exactly once delivery in ClickHouse.
General Operations
Engine Parameters
Engine = ReplacingMergeTree([version_column],[is_deleted_column])
ORDER BY <list_of_columns>
ORDER BY – The ORDER BY defines the columns that need to be unique at merge time. Since merge time can not be decided most of the time, the FINAL keyword is required to remove duplicates.
version_column – An monotonically increasing number, which can be based on a timestamp. Used for make sure sure updates are executed in a right order.
UPDATE – INSERT INTO t(..., _version) values (...), insert with incremented version
DELETE – INSERT INTO t(..., _version, is_deleted) values(..., 1)
FINAL
ClickHouse does not guarantee that merge will fire and replace rows using ReplacingMergeTree logic. FINAL keyword should be used in order to apply merge in a query time. It works reasonably fast when PK filter is used, but maybe slow for SELECT * type of queries:
ClickHouse merge parts only in scope of single partition, so if two rows with the same replacing key would land in different partitions, they would never be merged in single row. FINAL keyword works in other way, it merge all rows across all partitions. But that behavior can be changed viado_not_merge_across_partitions_select_final setting.
-- GROUP BY
SELECTkey,argMax(val_1,ts)asval_1,argMax(val_2,ts)asval_2,argMax(val_3,ts)asval_3,argMax(val_4,ts)asval_4,argMax(val_5,ts)asval_5,max(ts)FROMrepl_tblWHEREkey=10GROUPBYkey;1rowinset.Elapsed:0.008sec.-- ORDER BY LIMIT BY
SELECT*FROMrepl_tblWHEREkey=10ORDERBYtsDESCLIMIT1BYkey;1rowinset.Elapsed:0.006sec.-- Subquery
SELECT*FROMrepl_tblWHEREkey=10ANDts=(SELECTmax(ts)FROMrepl_tblWHEREkey=10);1rowinset.Elapsed:0.009sec.-- FINAL
SELECT*FROMrepl_tblFINALWHEREkey=10;1rowinset.Elapsed:0.008sec.
Multiple keys
-- GROUP BY
SELECTkey,argMax(val_1,ts)asval_1,argMax(val_2,ts)asval_2,argMax(val_3,ts)asval_3,argMax(val_4,ts)asval_4,argMax(val_5,ts)asval_5,max(ts)FROMrepl_tblWHEREkeyIN(SELECTtoUInt32(number)FROMnumbers(1000000)WHEREnumber%100)GROUPBYkeyFORMATNull;Peakmemoryusage(forquery):2.19GiB.0rowsinset.Elapsed:1.043sec.Processed5.08millionrows,524.38MB(4.87millionrows/s.,502.64MB/s.)-- SET optimize_aggregation_in_order=1;
Peakmemoryusage(forquery):349.94MiB.0rowsinset.Elapsed:0.901sec.Processed4.94millionrows,506.55MB(5.48millionrows/s.,562.17MB/s.)-- ORDER BY LIMIT BY
SELECT*FROMrepl_tblWHEREkeyIN(SELECTtoUInt32(number)FROMnumbers(1000000)WHEREnumber%100)ORDERBYtsDESCLIMIT1BYkeyFORMATNull;Peakmemoryusage(forquery):1.12GiB.0rowsinset.Elapsed:1.171sec.Processed5.08millionrows,524.38MB(4.34millionrows/s.,447.95MB/s.)-- Subquery
SELECT*FROMrepl_tblWHERE(key,ts)IN(SELECTkey,max(ts)FROMrepl_tblWHEREkeyIN(SELECTtoUInt32(number)FROMnumbers(1000000)WHEREnumber%100)GROUPBYkey)FORMATNull;Peakmemoryusage(forquery):197.30MiB.0rowsinset.Elapsed:0.484sec.Processed8.72millionrows,507.33MB(18.04millionrows/s.,1.05GB/s.)-- SET optimize_aggregation_in_order=1;
Peakmemoryusage(forquery):171.93MiB.0rowsinset.Elapsed:0.465sec.Processed8.59millionrows,490.55MB(18.46millionrows/s.,1.05GB/s.)-- FINAL
SELECT*FROMrepl_tblFINALWHEREkeyIN(SELECTtoUInt32(number)FROMnumbers(1000000)WHEREnumber%100)FORMATNull;Peakmemoryusage(forquery):537.13MiB.0rowsinset.Elapsed:0.357sec.Processed4.39millionrows,436.28MB(12.28millionrows/s.,1.22GB/s.)
Full table
-- GROUP BY
SELECTkey,argMax(val_1,ts)asval_1,argMax(val_2,ts)asval_2,argMax(val_3,ts)asval_3,argMax(val_4,ts)asval_4,argMax(val_5,ts)asval_5,max(ts)FROMrepl_tblGROUPBYkeyFORMATNull;Peakmemoryusage(forquery):16.08GiB.0rowsinset.Elapsed:11.600sec.Processed40.00millionrows,5.12GB(3.45millionrows/s.,441.49MB/s.)-- SET optimize_aggregation_in_order=1;
Peakmemoryusage(forquery):865.76MiB.0rowsinset.Elapsed:9.677sec.Processed39.82millionrows,5.10GB(4.12millionrows/s.,526.89MB/s.)-- ORDER BY LIMIT BY
SELECT*FROMrepl_tblORDERBYtsDESCLIMIT1BYkeyFORMATNull;Peakmemoryusage(forquery):8.39GiB.0rowsinset.Elapsed:14.489sec.Processed40.00millionrows,5.12GB(2.76millionrows/s.,353.45MB/s.)-- Subquery
SELECT*FROMrepl_tblWHERE(key,ts)IN(SELECTkey,max(ts)FROMrepl_tblGROUPBYkey)FORMATNull;Peakmemoryusage(forquery):2.40GiB.0rowsinset.Elapsed:5.225sec.Processed79.65millionrows,5.40GB(15.24millionrows/s.,1.03GB/s.)-- SET optimize_aggregation_in_order=1;
Peakmemoryusage(forquery):924.39MiB.0rowsinset.Elapsed:4.126sec.Processed79.67millionrows,5.40GB(19.31millionrows/s.,1.31GB/s.)-- FINAL
SELECT*FROMrepl_tblFINALFORMATNull;Peakmemoryusage(forquery):834.09MiB.0rowsinset.Elapsed:2.314sec.Processed38.80millionrows,4.97GB(16.77millionrows/s.,2.15GB/s.)
1.3.8.1 - ReplacingMergeTree does not collapse duplicates
ReplacingMergeTree does not collapse duplicates
Hi there, I have a question about replacing merge trees. I have set up a
Materialized View
with ReplacingMergeTree table, but even if I call optimize on it, the parts don’t get merged. I filled that table yesterday, nothing happened since then. What should I do?
Merges are eventual and may never happen. It depends on the number of inserts that happened after, the number of parts in the partition, size of parts.
If the total size of input parts are greater than the maximum part size then they will never be merged.
in non-regular (Replicated)MergeTree tables over non ORDER BY columns. ClickHouse® applies index condition on the first step of query execution, so it’s possible to get outdated rows.
--(1) create test table
droptableifexiststest;createtabletest(versionUInt32,idUInt32,stateUInt8,INDEXstate_idx(state)typeset(0)GRANULARITY1)ENGINEReplacingMergeTree(version)ORDERBY(id);--(2) insert sample data
INSERTINTOtest(version,id,state)VALUES(1,1,1);INSERTINTOtest(version,id,state)VALUES(2,1,0);INSERTINTOtest(version,id,state)VALUES(3,1,1);--(3) check the result:
-- expected 3, 1, 1
selectversion,id,statefromtestfinal;┌─version─┬─id─┬─state─┐│3│1│1│└─────────┴────┴───────┘-- expected empty result
selectversion,id,statefromtestfinalwherestate=0;┌─version─┬─id─┬─state─┐│2│1│0│└─────────┴────┴───────┘
1.3.10 - SummingMergeTree
SummingMergeTree
Nested structures
In certain conditions it could make sense to collapse one of dimensions to set of arrays. It’s usually profitable to do if this dimension is not commonly used in queries. It would reduce amount of rows in aggregated table and
speed up queries
which doesn’t care about this dimension in exchange of aggregation performance by collapsed dimension.
How to aggregate mutating event stream with duplicates
Challenges with mutated data
When you have an incoming event stream with duplicates, updates, and deletes, building a consistent row state inside the ClickHouse® table is a big challenge.
The UPDATE/DELETE approach in the OLTP world won’t help with OLAP databases tuned to handle big batches. UPDATE/DELETE operations in ClickHouse are executed as “mutations,” rewriting a lot of data and being relatively slow. You can’t run such operations very often, as for OLTP databases. But the UPSERT operation (insert and replace) runs fast with the ReplacingMergeTree Engine. It’s even set as the default mode for INSERT without any special keyword. We can emulate UPDATE (or even DELETE) with the UPSERT operation.
There are a lot of blog posts
on how to use ReplacingMergeTree Engine to handle mutated data streams. A properly designed table schema with ReplacingMergeTree Engine is a good instrument for building the DWH Dimensions table. But when maintaining metrics in Fact tables, there are several problems:
it’s not possible to use a valuable ClickHouse feature - online aggregation of incoming data by Materialized Views or Projections on top of the ReplacingMT table, because duplicates and updates will not be deduplicated by the engine during inserts, and calculated aggregates (like sum or count) will be incorrect. For significant amounts of data, it’s become critical because aggregating raw data during report queries will take too much time.
unfinished support for DELETEs. While in the newest versions of ClickHouse, it’s possible to add the is_deleted to ReplacingMergeTree parameters, the necessity of manually filtering out deleted rows after FINAL processing makes that feature less useful.
Mutated data should be localized to the same partition. If the “replacing” row is saved to a partition different from the previous one, the report query will be much slower or produce unexpected results.
-- multiple partitions problem
CREATETABLERMT(`key`Int64,`someCol`String,`eventTime`DateTime)ENGINE=ReplacingMergeTree()PARTITIONBYtoYYYYMM(eventTime)ORDERBYkey;INSERTINTORMTValues(1,'first','2024-04-25T10:16:21');INSERTINTORMTValues(1,'second','2024-05-02T08:36:59');withmergedas(select*fromRMTFINAL)select*frommergedwhereeventTime<'2024-05-01'
You will get a row with ‘first’, not an empty set, as one might expect with the FINAL processing of a whole table.
Collapsing
ClickHouse has other table engines, such as CollapsingMergeTree and VersionedCollapsingMergeTree, that can be used even better for UPSERT operation.
Both work by inserting a “rollback row” to compensate for the previous insert. The difference between CollapsingMergeTree and VersionedCollapsingMergeTree is in the algorithm of collapsing. For Cluster configurations, it’s essential to understand which row came first and who should replace whom. That is why using ReplicatedVersionedCollapsingMergeTree is mandatory for Replicated Clusters.
When dealing with such complicated data streams, it needs to be solved 3 tasks simultaneously:
remove duplicates
process updates and deletes
calculate correct aggregates
It’s essential to understand how the collapsing algorithm of VersionedCollapsingMergeTree works. Quote from the documentation
:
When ClickHouse merges data parts, it deletes each pair of rows that have the same primary key and version and different Sign. The order of rows does not matter.
The version column should increase over time. You may use a natural timestamp for that. Random-generated IDs are not suitable for the version column.
Replace data in another partition
Let’s first fix the problem with mutated data in a different partition.
CREATETABLEVCMT(keyInt64,someColString,eventTimeDateTime,signInt8)ENGINE=VersionedCollapsingMergeTree(sign,eventTime)PARTITIONBYtoYYYYMM(eventTime)ORDERBYkey;INSERTINTOVCMTValues(1,'first','2024-04-25 10:16:21',1);INSERTINTOVCMTValues(1,'first','2024-04-25 10:16:21',-1),(1,'second','2024-05-02 08:36:59',1);setdo_not_merge_across_partitions_select_final=1;-- for fast FINAL
select'no rows after:';withmergedas(select*fromVCMTFINAL)select*frommergedwhereeventTime<'2024-05-01';
With VersionedCollapsingMergeTree, we can use more partition strategies, even with columns not tied to the row’s primary key. This could facilitate the creation of faster queries, more convenient TTLs (Time-To-Live), and backups.
Row deduplication
There are several ways to remove duplicates from the event stream. The most effective feature is block deduplication, which occurs when ClickHouse drops incoming blocks with the same checksum (or tag). However, this requires building a smart ingestor capable of saving positions in a transactional manner.
However, another method is possible: verifying whether a particular row already exists in the destination table to avoid redundant insertions. Together with block deduplication, that method also avoids using ReplacingMergeTree and FINAL during query time.
Ensuring accuracy and consistency in results requires executing this process on a single thread within one cluster node. This method is particularly suitable for less active event streams, such as those with up to 100,000 events per second. To boost performance, incoming streams should be segmented into several partitions (or ‘shards’) based on the table/event’s Primary Key, with each partition processed on a single thread.
use Null table and MatView to be able to access both the insert block and the dest table
check the existence of IDs in the destination table with a fast index scan by a primary key using the IN operator
filter existing rows from insert block by NOT IN operator
In most cases, the insert block does not have too many rows (like 1000-100k), so checking the destination table for their existence by scanning the Primary Key (residing in memory) won’t take much time. However, due to the high table index granularity, it can still be noticeable on high load. To enhance performance, consider reducing index granularity to 4096 (from the default 8192) or even fewer values.
Getting old row
To process updates in CollapsingMergeTree, the ’last row state’ must be known before inserting the ‘compensation row.’ Sometimes, this is possible - CDC events coming from MySQL’s binlog or Postgres’s WAL contain not only ’new’ data but also ‘old’ values. If one of the columns includes a sequence-generated version or timestamp of the row’s update time, it can be used as the row’s ‘version’ for VersionedCollapsingMergeTree. When the incoming event stream lacks old metric values and suitable version information, we can retrieve that data by examining the ClickHouse table using the same method used for row deduplication in the previous example.
I read more data from the Example2 table than from Example1. Instead of simply checking the row existence by the IN operator, a JOIN with existing rows is used to build a “compensate row.”
For UPSERT, the collapsing algorithm requires inserting two rows. So, I need to create two rows from any row that is found in the local table. It´s an essential part of the suggested approach, which allows me to produce proper rows for inserting with a human-readable code with clear if() statements. That is why I execute arrayJoin while reading old data.
Don’t try to run the code above. It’s just a short explanation of the idea, lacking many needed elements.
UPSERT by Collapsing
Here is a more realistic example
with more checks that can be played with:
createtableExample3(idInt32,metric1UInt32,metric2UInt32,_versionUInt64,signInt8default1)engine=VersionedCollapsingMergeTree(sign,_version)ORDERBYid;createtableStageengine=NullasExample3;creatematerializedviewExample3TransformtoExample3aswith__newas(SELECT*FROMStageorderby_versiondesc,signdesclimit1byid),__oldAS(SELECT*,arrayJoin([-1,1])AS_signfrom(select*FROMExample3finalPREWHEREidIN(SELECTidFROM__new)wheresign=1))selectid,if(__old._sign=-1,__old.metric1,__new.metric1)ASmetric1,if(__old._sign=-1,__old.metric2,__new.metric2)ASmetric2,if(__old._sign=-1,__old._version,__new._version)AS_version,if(__old._sign=-1,-1,1)ASsignfrom__newleftjoin__oldusingidwhereif(__new.sign=-1,__old._sign=-1,-- insert only delete row if it's found in old data
__new._version>__old._version-- skip duplicates for updates
);-- original
insertintoStagevalues(1,1,1,1,1),(2,2,2,1,1);select'step1',*fromExample3;-- no duplicates (with the same version) inserted
insertintoStagevalues(1,3,1,1,1),(2,3,2,1,1);select'step2',*fromExample3;-- delete a row with id=2. version for delete row does not have any meaning
insertintoStagevalues(2,2,2,0,-1);select'step3',*fromExample3final;-- replace a row with id=1. row with sign=-1 not needed, but can be in the insert blocks (will be skipped)
insertintoStagevalues(1,1,1,0,-1),(1,3,3,2,1);select'step4',*fromExample3final;
Important additions:
When multiple events with the same ID and different versions are received in the one insert batch, the most recent event is applied.
“delete rows” with sign=-1 and the wrong version are not used for processing. For the Collapsing algorithm, the delete row version should match the version from the row stored in the local table, not the same version from the replacing row. That’s why I decided to skip such a “delete row” received from the incoming stream and build it from the table’s data.
using FINAL and PREWHERE (to speed up FINAL) while reading the destination table. PREWHERE filters are applied before FINAL processing, reducing the number of grouped rows.
filter to skip out-of-order events by checking the version
DELETE event processing (inside last WHERE)
Speed Test
setallow_experimental_analyzer=0;createtableExample3(idInt32,DepartmentString,metric1UInt32,metric2Float32,_versionUInt64,signInt8default1)engine=VersionedCollapsingMergeTree(sign,_version)ORDERBYidpartitionby(id%20)settingsindex_granularity=4096;setdo_not_merge_across_partitions_select_final=1;-- make 100M table
INSERTINTOExample3SELECTnumberASid,['HR','Finance','Engineering','Sales','Marketing'][rand()%5+1]ASDepartment,rand()%1000ASmetric1,(rand()%10000)/100.0ASmetric2,0AS_version,1ASsignFROMnumbers(1E8);createfunctiontimeSpentas()->date_diff('millisecond',(selecttsfromt1),now64(3));-- measure plain INSERT time for 1M batch
createtemporarytablet1(tsDateTime64(3))asselectnow64(3);INSERTINTOExample3SELECTnumberASid,['HR','Finance','Engineering','Sales','Marketing'][rand()%5+1]ASDepartment,rand()%1000ASmetric1,(rand()%10000)/100.0ASmetric2,1AS_version,1ASsignFROMnumbers(1E6);select'---',timeSpent(),'INSERT';--create table Stage engine=MergeTree order by id as Example3 ;
createtableStageengine=NullasExample3;creatematerializedviewExample3TransformtoExample3aswith__newas(SELECT*FROMStageorderby_versiondesc,signdesclimit1byid),__oldAS(SELECT*,arrayJoin([-1,1])AS_signfrom(select*FROMExample3finalPREWHEREidIN(SELECTidFROM__new)wheresign=1))selectid,if(__old._sign=-1,__old.Department,__new.Department)ASDepartment,if(__old._sign=-1,__old.metric1,__new.metric1)ASmetric1,if(__old._sign=-1,__old.metric2,__new.metric2)ASmetric2,if(__old._sign=-1,__old._version,__new._version)AS_version,if(__old._sign=-1,-1,1)ASsignfrom__newleftjoin__oldusingidwhereif(__new.sign=-1,__old._sign=-1,-- insert only delete row if it's found in old data
__new._version>__old._version-- skip duplicates for updates
);-- calculate UPSERT time for 1M batch
droptablet1;createtemporarytablet1(tsDateTime64(3))asselectnow64(3);INSERTINTOStageSELECT(rand()%1E6)*100ASid,--number AS id,
['HR','Finance','Engineering','Sales','Marketing'][rand()%5+1]ASDepartment,rand()%1000ASmetric1,(rand()%10000)/100.0ASmetric2,2AS_version,1ASsignFROMnumbers(1E6);select'---',timeSpent(),'UPSERT';-- FINAL query
droptablet1;createtemporarytablet1(tsDateTime64(3))asselectnow64(3);selectDepartment,count(),sum(metric1)fromExample3FINALgroupbyDepartmentorderbyDepartmentformatNull;select'---',timeSpent(),'FINAL';-- GROUP BY query
droptablet1;createtemporarytablet1(tsDateTime64(3))asselectnow64(3);selectDepartment,sum(sign),sum(sign*metric1)fromExample3groupbyDepartmentorderbyDepartmentformatNull;select'---',timeSpent(),'GROUP BY';optimizetableExample3final;-- FINAL query
droptablet1;createtemporarytablet1(tsDateTime64(3))asselectnow64(3);selectDepartment,count(),sum(metric1)fromExample3FINALgroupbyDepartmentorderbyDepartmentformatNull;select'---',timeSpent(),'FINAL OPTIMIZED';-- GROUP BY query
droptablet1;createtemporarytablet1(tsDateTime64(3))asselectnow64(3);selectDepartment,sum(sign),sum(sign*metric1)fromExample3groupbyDepartmentorderbyDepartmentformatNull;select'---',timeSpent(),'GROUP BY OPTIMIZED';
You can use fiddle or clickhouse-local to run such a test:
cat test.sql | clickhouse-local -nm
Results (Mac A2 Pro), milliseconds:
--- 252 INSERT
--- 1710 UPSERT
--- 763 FINAL
--- 311 GROUP BY
--- 314 FINAL OPTIMIZED
--- 295 GROUP BY OPTIMIZED
UPSERT is six times slower than direct INSERT because it requires looking up the destination table. That is the price. It is better to use idempotent inserts with an exactly-once delivery guarantee. However, it’s not always possible.
The FINAL speed is quite good, especially if we split the table by 20 partitions, use do_not_merge_across_partitions_select_final setting, and keep most of the table’s partitions optimized (1 part per partition). But we can do it better.
Adding projections
Let’s add an aggregating projection, and also add a more useful updated_at timestamp instead of an abstract _version and replace String for Department dimension by LowCardinality(String). Let’s look at the difference in time execution.
setallow_experimental_analyzer=0;createtableExample4(idInt32,DepartmentLowCardinality(String),metric1Int32,metric2Float32,_versionDateTime64(3)defaultnow64(3),signInt8default1)engine=VersionedCollapsingMergeTree(sign,_version)ORDERBYidpartitionby(id%20)settingsindex_granularity=4096;setdo_not_merge_across_partitions_select_final=1;-- make 100M table
INSERTINTOExample4SELECTnumberASid,['HR','Finance','Engineering','Sales','Marketing'][rand()%5+1]ASDepartment,rand()%1000ASmetric1,(rand()%10000)/100.0ASmetric2,0AS_version,1ASsignFROMnumbers(1E8);createtemporarytabletimeMark(tsDateTime64(3));createfunctiontimeSpentas()->date_diff('millisecond',(selectmax(ts)fromtimeMark),now64(3));-- measure plain INSERT time for 1M batch
insertintotimeMarkselectnow64(3);INSERTINTOExample4(id,Department,metric1,metric2)SELECTnumberASid,['HR','Finance','Engineering','Sales','Marketing'][rand()%5+1]ASDepartment,rand()%1000ASmetric1,(rand()%10000)/100.0ASmetric2FROMnumbers(1E6);select'---',timeSpent(),'INSERT';--create table Stage engine=MergeTree order by id as Example4 ;
createtableStageengine=NullasExample4;creatematerializedviewExample4TransformtoExample4aswith__newas(SELECT*FROMStageorderby_versiondesc,signdesclimit1byid),__oldAS(SELECT*,arrayJoin([-1,1])AS_signfrom(select*FROMExample4finalPREWHEREidIN(SELECTidFROM__new)wheresign=1))selectid,if(__old._sign=-1,__old.Department,__new.Department)ASDepartment,if(__old._sign=-1,__old.metric1,__new.metric1)ASmetric1,if(__old._sign=-1,__old.metric2,__new.metric2)ASmetric2,if(__old._sign=-1,__old._version,__new._version)AS_version,if(__old._sign=-1,-1,1)ASsignfrom__newleftjoin__oldusingidwhereif(__new.sign=-1,__old._sign=-1,-- insert only delete row if it's found in old data
__new._version>__old._version-- skip duplicates for updates
);-- calculate UPSERT time for 1M batch
insertintotimeMarkselectnow64(3);INSERTINTOStage(id,Department,metric1,metric2)SELECT(rand()%1E6)*100ASid,--number AS id,
['HR','Finance','Engineering','Sales','Marketing'][rand()%5+1]ASDepartment,rand()%1000ASmetric1,(rand()%10000)/100.0ASmetric2FROMnumbers(1E6);select'---',timeSpent(),'UPSERT';-- FINAL query
insertintotimeMarkselectnow64(3);selectDepartment,count(),sum(metric1)fromExample4FINALgroupbyDepartmentorderbyDepartmentformatNull;select'---',timeSpent(),'FINAL';-- GROUP BY query
insertintotimeMarkselectnow64(3);selectDepartment,sum(sign),sum(sign*metric1)fromExample4groupbyDepartmentorderbyDepartmentformatNull;select'---',timeSpent(),'GROUP BY';--select '--parts1',partition, count() from system.parts where active and table='Example4' group by partition;
insertintotimeMarkselectnow64(3);optimizetableExample4final;select'---',timeSpent(),'OPTIMIZE';-- FINAL OPTIMIZED
insertintotimeMarkselectnow64(3);selectDepartment,count(),sum(metric1)fromExample4FINALgroupbyDepartmentorderbyDepartmentformatNull;select'---',timeSpent(),'FINAL OPTIMIZED';-- GROUP BY OPTIMIZED
insertintotimeMarkselectnow64(3);selectDepartment,sum(sign),sum(sign*metric1)fromExample4groupbyDepartmentorderbyDepartmentformatNull;select'---',timeSpent(),'GROUP BY OPTIMIZED';-- UPSERT a little data to create more parts
INSERTINTOStage(id,Department,metric1,metric2)SELECTnumberASid,['HR','Finance','Engineering','Sales','Marketing'][rand()%5+1]ASDepartment,rand()%1000ASmetric1,(rand()%10000)/100.0ASmetric2FROMnumbers(1000);--select '--parts2',partition, count() from system.parts where active and table='Example4' group by partition;
-- GROUP BY SEMI-OPTIMIZED
insertintotimeMarkselectnow64(3);selectDepartment,sum(sign),sum(sign*metric1)fromExample4groupbyDepartmentorderbyDepartmentformatNull;select'---',timeSpent(),'GROUP BY SEMI-OPTIMIZED';--alter table Example4 add column Smetric1 Int32 alias metric1*sign;
altertableExample4addprojectionbyDep(selectDepartment,sum(sign),sum(sign*metric1)groupbyDepartment);-- Materialize Projection
insertintotimeMarkselectnow64(3);altertableExample4materializeprojectionbyDepsettingsmutations_sync=1;select'---',timeSpent(),'Materialize Projection';-- GROUP BY query Projected
insertintotimeMarkselectnow64(3);selectDepartment,sum(sign),sum(sign*metric1)fromExample4groupbyDepartmentorderbyDepartmentsettingsforce_optimize_projection=1formatNull;select'---',timeSpent(),'GROUP BY Projected';
Results (Mac A2 Pro), milliseconds:
--- 175 INSERT
--- 1613 UPSERT
--- 329 FINAL
--- 102 GROUP BY
--- 10498 OPTIMIZE
--- 103 FINAL OPTIMIZED
--- 90 GROUP BY OPTIMIZED
--- 94 GROUP BY SEMI-OPTIMIZED
--- 919 Materialize Projection
--- 5 GROUP BY Projected
Some thoughts:
INSERT, UPSERT, and SELECT benefit from switching the Department column to LowCardinality. Fewer reads - faster queries.
OPTIMIZE is VERY expensive
FINAL is quite fast (especially for the OPTIMIZED table). You don’t need to OPTIMIZE the table till the 1 part for partition to remove FINAL from the query. Not having too many parts already gives you a performance boost.
GROUP BY for that task is still faster
projections building requires resources. Inserts to the table with Projections will be longer. Tune the insert timeouts.
Query over projection is very fast (as it should be). However, it’s not always possible to aggregate data in such a simple way.
DELETEs inaccuracy
The typical CDC event for DWH systems besides INSERT is UPSERT—a new row replaces the old one (with suitable aggregate corrections). But DELETE events are also supported (ones with column sign=-1). The Materialized View described above will correctly process the DELETE event by inserting only 1 row with sign=-1 if a row with a particular ID already exists in the table. In such cases, VersionedCollapsingMergeTree will wipe both rows (with sign=1 & -1) during merge or final operations.
However, it can lead to incorrect duplicate processing in some rare situations. Here is the scenario:
two events happen in the source database (insert and delete) for the very same ID
only insert event create a duplicate (delete event does not duplicate)
all 3 events (delete and two inserts) were processed in separate batches
ClickHouse executes the merge operation very quickly after the first INSERT and DELETE events are received, effectively removing the row with that ID from the table
the second (duplicated) insert is saved to the table because we lost the information about the first insertion
The probability of such a sequence is relatively low, especially in normal operations when the amount of DELETEs is not too significant. Processing events in big batches will reduce the probability even more.
Combine old and new
The presented technique can be used to reimplement the AggregatingMergeTree algorithm to combine old and new row data using VersionedCollapsingMergeTree.
createtableExample5(idInt32,metric1UInt32,metric2Nullable(UInt32),updated_atDateTime64(3)defaultnow64(3),signInt8default1)engine=VersionedCollapsingMergeTree(sign,updated_at)ORDERBYid;createtableStageengine=NullasExample5;creatematerializedviewExample5TransformtoExample5aswith__newas(SELECT*FROMStageorderbysigndesc,updated_atdesclimit1byid),__oldAS(SELECT*,arrayJoin([-1,1])AS_signfrom(select*FROMExample5finalPREWHEREidIN(SELECTidFROM__new)wheresign=1))selectid,if(__old._sign=-1,__old.metric1,greatest(__new.metric1,__old.metric1))ASmetric1,if(__old._sign=-1,__old.metric2,ifNull(__new.metric2,__old.metric2))ASmetric2,if(__old._sign=-1,__old.updated_at,__new.updated_at)ASupdated_at,if(__old._sign=-1,-1,1)ASsignfrom__newleftjoin__oldusingidwhereif(__new.sign=-1,__old._sign=-1,-- insert only delete row if it's found in old data
__new.updated_at>__old.updated_at-- skip duplicates for updates
);-- original
insertintoStage(id)values(1),(2);select'step0',*fromExample5;insertintoStage(id,metric1)values(1,1),(2,2);select'step1',*fromExample5final;insertintoStage(id,metric2)values(1,11),(2,12);select'step2',*fromExample5final;
Complex Primary Key
I used a simple, compact column with Int64 type for the primary key in previous examples. It’s better to go this route with monotonically growing IDs like autoincrement ID or SnowFlakeId (based on timestamp). However, in some cases, a more complex primary key is needed. For instance, when storing data for multiple tenants (Customers, partners, etc.) in the same table. This is not a problem for the suggested technique - use all the necessary columns in all filters and JOIN operations as Tuple.
createtableExample6(idInt64,tenant_idInt32,metric1UInt32,_versionUInt64,signInt8default1)engine=VersionedCollapsingMergeTree(sign,_version)ORDERBY(tenant_id,id);createtableStageengine=NullasExample6;creatematerializedviewExample6TransformtoExample6aswith__newas(SELECT*FROMStageorderbysigndesc,_versiondesclimit1bytenant_id,id),__oldAS(SELECT*,arrayJoin([-1,1])AS_signfrom(select*FROMExample6finalPREWHERE(tenant_id,id)IN(SELECTtenant_id,idFROM__new)wheresign=1))selectid,tenant_id,if(__old._sign=-1,__old.metric1,__new.metric1)ASmetric1,if(__old._sign=-1,__old._version,__new._version)AS_version,if(__old._sign=-1,-1,1)ASsignfrom__newleftjoin__oldusing(tenant_id,id)whereif(__new.sign=-1,__old._sign=-1,-- insert only delete row if it's found in old data
__new._version>__old._version-- skip duplicates for updates
);
Sharding
The suggested approach works well when inserting data in a single thread on a single replica. This is suitable for up to 1M events per second. However, for higher traffic, it’s necessary to use multiple ingesting threads across several replicas. In such cases, collisions caused by parts manipulation and replication delay can disrupt the entire Collapsing algorithm.
But inserting different shards with a sharding key derived from ID works fine. Every shard will operate with its own non-intersecting set of IDs, and don’t interfere with each other.
The same approach can be implemented when inserting several threads into the same replica node. For big installations with high traffic and many shards and replicas, the ingesting app can split the data stream into a considerably large number of “virtual shards” (or partitions in Kafka terminology) and then map the “virtual shards” to the threads doing inserts to “physical shards.”
The incoming stream could be split into several ones by using an expression like cityHash64(id) % 50 = 0 as a sharding key. The ingesting app should calculate the shard number before sending data to internal buffers that will be flushed to INSERTs.
-- emulate insert into distributed table
INSERTINTOfunctionremote('localhos{t,t,t}',default,Stage,id)SELECT(rand()%1E6)*100ASid,--number AS id,
['HR','Finance','Engineering','Sales','Marketing'][rand()%5+1]ASDepartment,rand()%1000ASmetric1,(rand()%10000)/100.0ASmetric2,2AS_version,1ASsignFROMnumbers(1000)settingsprefer_localhost_replica=0;
2 - Queries & Syntax
Learn about ClickHouse® queries & syntax, including Joins & Window Functions.
┌─name───────────────────────────────┬─value────┬─changed─┬─description────────────────────────────────────────────────────────────────────────────────────────────────────────────────────────────────────────────────────────────────────────────────────────────────┬─min──┬─max──┬─readonly─┬─type───┐
│ group_by_two_level_threshold │ 100000 │ 0 │ From what number of keys, a two-level aggregation starts. 0 - the threshold is not set. │ ᴺᵁᴸᴸ │ ᴺᵁᴸᴸ │ 0 │ UInt64 │
│ group_by_two_level_threshold_bytes │ 50000000 │ 0 │ From what size of the aggregation state in bytes, a two-level aggregation begins to be used. 0 - the threshold is not set. Two-level aggregation is used when at least one of the thresholds is triggered. │ ᴺᵁᴸᴸ │ ᴺᵁᴸᴸ │ 0 │ UInt64 │
└────────────────────────────────────┴──────────┴─────────┴────────────────────────────────────────────────────────────────────────────────────────────────────────────────────────────────────────────────────────────────────────────────────────────────────────────┴──────┴──────┴──────────┴────────┘
In order to parallelize merging of hash tables, ie execute such merge via multiple threads, ClickHouse use two-level approach:
On the first step ClickHouse creates 256 buckets for each thread. (determined by one byte of hash function)
On the second step ClickHouse can merge those 256 buckets independently by multiple threads.
It utilizes a two-level group by and dumps those buckets on disk. And at the last stage ClickHouse will read those buckets from disk one by one and merge them.
So you should have enough RAM to hold one bucket (1/256 of whole GROUP BY size).
Usually it works slower than regular GROUP BY, because ClickHouse needs to read and process data in specific ORDER, which makes it much more complicated to parallelize reading and aggregating.
But it use much less memory, because ClickHouse can stream resultset and there is no need to keep it in memory.
Last item cache
ClickHouse saves value of previous hash calculation, just in case next value will be the same.
All queries and datasets are unique, so in different situations different hacks could work better or worse.
PreFilter values before GROUP BY
SELECTuser_id,sum(clicks)FROMsessionsWHEREcreated_at>'2021-11-01 00:00:00'GROUPBYuser_idHAVING(argMax(clicks,created_at)=16)AND(argMax(platform,created_at)='Rat')FORMAT`Null`<Debug>MemoryTracker:Peakmemoryusage(forquery):18.36GiB.SELECTuser_id,sum(clicks)FROMsessionsWHEREuser_idIN(SELECTuser_idFROMsessionsWHERE(platform='Rat')AND(clicks=16)AND(created_at>'2021-11-01 00:00:00')-- So we will select user_id which could potentially match our HAVING clause in OUTER query.
)AND(created_at>'2021-11-01 00:00:00')GROUPBYuser_idHAVING(argMax(clicks,created_at)=16)AND(argMax(platform,created_at)='Rat')FORMAT`Null`<Debug>MemoryTracker:Peakmemoryusage(forquery):4.43GiB.
Use Fixed-width data types instead of String
For example, you have 2 strings which has values in special form like this
‘ABX 1412312312313’
You can just remove the first 4 characters and convert the rest to UInt64
toUInt64(substr(‘ABX 1412312312313’,5))
And you packed 17 bytes in 8, more than 2 times the improvement of size!
Because each thread uses an independent hash table, if you lower thread amount it will reduce number of hash tables as well and lower memory usage at the cost of slower query execution.
From 22.4 ClickHouse can predict, when it make sense to initialize aggregation with two-level from start, instead of rehashing on fly.
It can improve query time.
https://github.com/ClickHouse/ClickHouse/pull/33439
GROUP BY in external memory
Slow!
Use hash function for GROUP BY keys
GROUP BY cityHash64(‘xxxx’)
Can lead to incorrect results as hash functions is not 1 to 1 mapping.
An approach that allows you to redefine partitioning without table creation
In that example, partitioning is being calculated via MATERIALIZED column expression toDate(toStartOfInterval(ts, toIntervalT(...))), but partition id also can be generated on application side and inserted to ClickHouse® as is.
SELECTnumberFROMnumbers_mt(100000000)GROUPBYnumberFORMAT`Null`MemoryTracker:Peakmemoryusage(forquery):4.04GiB.0rowsinset.Elapsed:8.212sec.Processed100.00millionrows,800.00MB(12.18millionrows/s.,97.42MB/s.)SELECTnumberFROMnumbers_mt(100000000)GROUPBYnumberSETTINGSmax_threads=1FORMAT`Null`MemoryTracker:Peakmemoryusage(forquery):6.00GiB.0rowsinset.Elapsed:19.206sec.Processed100.03millionrows,800.21MB(5.21millionrows/s.,41.66MB/s.)SELECTnumberFROMnumbers_mt(100000000)GROUPBYnumberLIMIT1000FORMAT`Null`MemoryTracker:Peakmemoryusage(forquery):4.05GiB.0rowsinset.Elapsed:4.852sec.Processed100.00millionrows,800.00MB(20.61millionrows/s.,164.88MB/s.)Thisqueryfasterthanfirst,becauseClickHouse®doesn't need to merge states for all keys, only for first 1000 (based on LIMIT)
SELECT number % 1000 AS key
FROM numbers_mt(1000000000)
GROUP BY key
LIMIT 1000
FORMAT `Null`
MemoryTracker: Peak memory usage (for query): 3.15 MiB.
0 rows in set. Elapsed: 0.770 sec. Processed 1.00 billion rows, 8.00 GB (1.30 billion rows/s., 10.40 GB/s.)
SELECT number % 1000 AS key
FROM numbers_mt(1000000000)
GROUP BY key
LIMIT 1001
FORMAT `Null`
MemoryTracker: Peak memory usage (for query): 3.77 MiB.
0 rows in set. Elapsed: 0.770 sec. Processed 1.00 billion rows, 8.00 GB (1.30 billion rows/s., 10.40 GB/s.)
Multi threaded
Will return result only after completion of aggregation
When we try to type cast 64.32 to Decimal128(2) the resulted value is 64.31.
When it sees a number with a decimal separator it interprets as Float64 literal (where 64.32 have no accurate representation, and actually you get something like 64.319999999999999999) and later that Float is casted to Decimal by removing the extra precision.
Workaround is very simple - wrap the number in quotes (and it will be considered as a string literal by query parser, and will be transformed to Decimal directly), or use postgres-alike casting syntax:
One more approach to hide (delete) rows in ClickHouse®
No row policy
CREATETABLEtest_delete(tenantInt64,keyInt64,tsDateTime,value_aString)ENGINE=MergeTreePARTITIONBYtoYYYYMM(ts)ORDERBY(tenant,key,ts);INSERTINTOtest_deleteSELECTnumber%5,number,toDateTime('2020-01-01')+number/10,concat('some_looong_string',toString(number)),FROMnumbers(1e8);INSERTINTOtest_delete-- multiple small tenants
SELECTnumber%5000,number,toDateTime('2020-01-01')+number/10,concat('some_looong_string',toString(number)),FROMnumbers(1e8);
expression: CREATE ROW POLICY pol1 ON test_delete USING tenant not in (1,2,3) TO all;
table subq: CREATE ROW POLICY pol1 ON test_delete USING tenant not in deleted_tenants TO all;
ext. dict. NOT dictHas : CREATE ROW POLICY pol1 ON test_delete USING NOT dictHas('deleted_tenants_dict', tenant) TO all;
ext. dict. dictHas :
Q
no policy
expression
table subq
ext. dict. NOT
ext. dict.
engine=Set
Q1
0.285 / 200.00m
0.333 / 140.08m
0.329 / 140.08m
0.388 / 200.00m
0.399 / 200.00m
0.322 / 200.00m
Q2
0.265 / 20.23m
0.287 / 20.23m
0.287 / 20.23m
0.291 / 20.23m
0.284 / 20.23m
0.275 / 20.23m
Q3
0.062 / 20.23m
0.080 / 20.23m
0.080 / 20.23m
0.084 / 20.23m
0.080 / 20.23m
0.084 / 20.23m
Q4
0.009 / 212.99t
0.011 / 212.99t
0.010 / 213.00t
0.010 / 212.99t
0.010 / 212.99t
0.010 / 212.99t
Q5
0.008 / 180.22t
0.008 / 180.23t
0.046 / 20.22m
0.034 / 20.22m
0.030 / 20.22m
Expression in row policy seems to be fastest way (Q1, Q5).
2.8 - Why is simple `SELECT count()` Slow in ClickHouse®?
ClickHouse is a columnar database that provides excellent performance for analytical queries. However, in some cases, a simple count query can be slow. In this article, we’ll explore the reasons why this can happen and how to optimize the query.
Three Strategies for Counting Rows in ClickHouse
There are three ways to count rows in a table in ClickHouse:
optimize_trivial_count_query: This strategy extracts the number of rows from the table metadata. It’s the fastest and most efficient way to count rows, but it only works for simple count queries.
allow_experimental_projection_optimization: This strategy uses a virtual projection called _minmax_count_projection to count rows. It’s faster than scanning the table but slower than the trivial count query.
Scanning the smallest column in the table and reading rows from that. This is the slowest strategy and is only used when the other two strategies can’t be used.
Why Does ClickHouse Sometimes Choose the Slowest Counting Strategy?
In some cases, ClickHouse may choose the slowest counting strategy even when there are faster options available. Here are some possible reasons why this can happen:
Row policies are used on the table: If row policies are used, ClickHouse needs to filter rows to give the proper count. You can check if row policies are used by selecting from system.row_policies.
Experimental light-weight delete feature was used on the table: If the experimental light-weight delete feature was used, ClickHouse may use the slowest counting strategy. You can check this by looking into parts_columns for the column named _row_exists. To do this, run the following query:
Some other features like allow_experimental_query_deduplication or empty_result_for_aggregation_by_empty_set is used.
2.9 - Collecting query execution flamegraphs using system.trace_log
ClickHouse® has embedded functionality to analyze the details of query performance.
It’s system.trace_log table.
By default it collects information only about queries when runs longer than 1 sec (and collects stacktraces every second).
You can adjust that per query using settings query_profiler_real_time_period_ns & query_profiler_cpu_time_period_ns.
Both works very similar (with desired interval dump the stacktraces of all the threads which execute the query).
real timer - allows to ‘see’ the situations when cpu was not working much, but time was spend for example on IO.
cpu timer - allows to see the ‘hot’ points in calculations more accurately (skip the io time).
Trying to collect stacktraces with a frequency higher than few KHz is usually not possible.
To check where most of the RAM is used you can collect stacktraces during memory allocations / deallocation, by using the
setting memory_profiler_sample_probability.
clickhouse-speedscope
# install wget https://github.com/laplab/clickhouse-speedscope/archive/refs/heads/master.tar.gz -O clickhouse-speedscope.tar.gz
tar -xvzf clickhouse-speedscope.tar.gz
cd clickhouse-speedscope-master/
pip3 install -r requirements.txt
For debugging particular query:
clickhouse-client
SET query_profiler_cpu_time_period_ns=1000000; -- 1000 times per 'cpu' sec
-- or SET query_profiler_real_time_period_ns=2000000; -- 500 times per 'real' sec.
-- or SET memory_profiler_sample_probability=0.1; -- to debug the memory allocations
SELECT ... <your select>
SYSTEM FLUSH LOGS;
-- get the query_id from the clickhouse-client output or from system.query_log (also pay attention on query_id vs initial_query_id for distributed queries).
Now let’s process that:
python3 main.py & # start the proxy in background
python3 main.py --query-id 908952ee-71a8-48a4-84d5-f4db92d45a5d # process the stacktraces
fg # get the proxy from background
Ctrl + C # stop it.
git clone https://github.com/brendangregg/FlameGraph /opt/flamegraph
clickhouse-client -q "SELECT arrayStringConcat(arrayReverse(arrayMap(x -> concat( addressToLine(x), '#', demangle(addressToSymbol(x)) ), trace)), ';') AS stack, count() AS samples FROM system.trace_log WHERE event_time >= subtractMinutes(now(),10) GROUP BY trace FORMAT TabSeparated" | /opt/flamegraph/flamegraph.pl > flamegraph.svg
clickhouse-client -q "SELECT arrayStringConcat((arrayMap(x -> concat(splitByChar('/', addressToLine(x))[-1], '#', demangle(addressToSymbol(x)) ), trace)), ';') AS stack, sum(abs(size)) AS samples FROM system.trace_log where trace_type = 'Memory' and event_date = today() group by trace order by samples desc FORMAT TabSeparated" | /opt/flamegraph/flamegraph.pl > allocs.svg
clickhouse-client -q "SELECT arrayStringConcat(arrayReverse(arrayMap(x -> concat(splitByChar('/', addressToLine(x))[-1], '#', demangle(addressToSymbol(x)) ), trace)), ';') AS stack, count() AS samples FROM system.trace_log where trace_type = 'Memory' group by trace FORMAT TabSeparated SETTINGS allow_introspection_functions=1" | /opt/flamegraph/flamegraph.pl > ~/mem1.svg
2.10 - Using array functions to mimic window-functions alike behavior
There are cases where you may need to mimic window functions using arrays in ClickHouse. This could be for optimization purposes, to better manage memory, or to enable on-disk spilling, especially if you’re working with an older version of ClickHouse that doesn’t natively support window functions.
Here’s an example demonstrating how to mimic a window function like runningDifference() using arrays:
Step 1: Create Sample Data
We’ll start by creating a test table with some sample data:
This table contains IDs, timestamps (ts), and values (val), where each id appears multiple times with different timestamps.
Step 2: Running Difference Example
If you try using runningDifference directly, it works block by block, which can be problematic when the data needs to be ordered or when group changes occur.
The output may look inconsistent because runningDifference requires ordered data within blocks.
Step 3: Using Arrays for Grouping and Calculation
Instead of using runningDifference, we can utilize arrays to group data, sort it, and apply similar logic more efficiently.
Grouping Data into Arrays -
You can group multiple columns into arrays by using the groupArray function. For example, to collect several columns as arrays of tuples, you can use the following query:
Applying Calculations with Arrays -
Once the data is sorted, you can apply array functions like arrayMap and arrayDifference to calculate differences between values in the arrays:
This allows you to manipulate and analyze data within arrays effectively, using powerful functions such as arrayMap, arrayDifference, and arrayEnumerate.
2.11 - -State & -Merge combinators
-State & -Merge combinators
The -State combinator in ClickHouse® does not store additional information about the -If combinator, which means that aggregate functions with and without -If have the same serialized data structure. This can be verified through various examples, as demonstrated below.
Example 1: maxIfState and maxState
In this example, we use the maxIfState and maxState functions on a dataset of numbers, serialize the result, and merge it using the maxMerge function.
$clickhouse-local--query "SELECT maxIfState(number,number % 2) as x, maxState(number) as y FROM numbers(10) FORMAT RowBinary" | clickhouse-local --input-format RowBinary --structure="x AggregateFunction(max,UInt64), y AggregateFunction(max,UInt64)" --query "SELECT maxMerge(x), maxMerge(y) FROM table"
99$clickhouse-local--query "SELECT maxIfState(number,number % 2) as x, maxState(number) as y FROM numbers(11) FORMAT RowBinary" | clickhouse-local --input-format RowBinary --structure="x AggregateFunction(max,UInt64), y AggregateFunction(max,UInt64)" --query "SELECT maxMerge(x), maxMerge(y) FROM table"
910
In both cases, the -State combinator results in identical serialized data footprints, regardless of the conditions in the -If variant. The maxMerge function merges the state without concern for the original -If condition.
Example 2: quantilesTDigestIfState
Here, we use the quantilesTDigestIfState function to demonstrate that functions like quantile-based and sequence matching functions follow the same principle regarding serialized data consistency.
$clickhouse-local--query "SELECT quantilesTDigestIfState(0.1,0.9)(number,number % 2) FROM numbers(1000000) FORMAT RowBinary" | clickhouse-local --input-format RowBinary --structure="x AggregateFunction(quantileTDigestWeighted(0.5),UInt64,UInt8)" --query "SELECT quantileTDigestWeightedMerge(0.4)(x) FROM table"
400000$clickhouse-local--query "SELECT quantilesTDigestIfState(0.1,0.9)(number,number % 2) FROM numbers(1000000) FORMAT RowBinary" | clickhouse-local --input-format RowBinary --structure="x AggregateFunction(quantilesTDigestWeighted(0.5),UInt64,UInt8)" --query "SELECT quantilesTDigestWeightedMerge(0.4,0.8)(x) FROM table"
[400000,800000]
Example 3: Quantile Functions with -Merge
This example shows how the quantileState and quantileMerge functions work together to calculate a specific quantile.
Example 4: sequenceMatch and sequenceCount Functions with -Merge
Finally, we demonstrate the behavior of sequenceMatchState and sequenceMatchMerge, as well as sequenceCountState and sequenceCountMerge, in ClickHouse.
ClickHouse’s -State combinator stores serialized data in a consistent manner, irrespective of conditions used with -If. The same applies to a wide range of functions, including quantile and sequence-based functions. This behavior ensures that functions like maxMerge, quantileMerge, sequenceMatchMerge, and sequenceCountMerge work seamlessly, even across varied inputs.
2.12 - ALTER MODIFY COLUMN is stuck, the column is inaccessible.
ALTER MODIFY COLUMN is stuck, the column is inaccessible.
Problem
You’ve created a table in ClickHouse with the following structure:
The failure occurred because the Enum8 type only allows for predefined values. Since ‘key_c’ wasn’t included in the definition, the mutation failed and left the table in an inconsistent state.
Solution
Identify and Terminate the Stuck Mutation
First, you need to locate the mutation that’s stuck in an incomplete state.
Apply the Correct Column Modification
Now that the column is accessible, you can safely reapply the ALTER query, but this time include all the required enum values:
Monitor Progress
You can monitor the progress of the column modification using the system.mutations or system.parts_columns tables to ensure everything proceeds as expected:
To make ClickHouse® more compatible with ANSI SQL standards (at the expense of some performance), you can adjust several settings. These configurations will bring ClickHouse closer to ANSI SQL behavior but may introduce a slowdown in query performance:
join_use_nulls=1
Introduced in: early versions
Ensures that JOIN operations return NULL for non-matching rows, aligning with standard SQL behavior.
cast_keep_nullable=1
Introduced in: v20.5
Preserves the NULL flag when casting between data types, which is typical in ANSI SQL.
union_default_mode='DISTINCT'
Introduced in: v21.1
Makes the UNION operation default to UNION DISTINCT, which removes duplicate rows, following ANSI SQL behavior.
allow_experimental_window_functions=1
Introduced in: v21.3
Enables support for window functions, which are a standard feature in ANSI SQL.
prefer_column_name_to_alias=1
Introduced in: v21.4
This setting resolves ambiguities by preferring column names over aliases, following ANSI SQL conventions.
group_by_use_nulls=1
Introduced in: v22.7
Allows NULL values to appear in the GROUP BY clause, consistent with ANSI SQL behavior.
By enabling these settings, ClickHouse becomes more ANSI SQL-compliant, although this may come with a trade-off in terms of performance. Each of these options can be enabled as needed, based on the specific SQL compatibility requirements of your application.
2.14 - Async INSERTs
Comprehensive guide to ClickHouse Async INSERTs - configuration, best practices, and monitoring
Overview
Async INSERTs is a ClickHouse® feature that enables automatic server-side batching of data. While we generally recommend batching at the application/ingestor level for better control and decoupling, async inserts are valuable when you have hundreds or thousands of clients performing small inserts and client-side batching is not feasible.
Time threshold elapses (async_insert_busy_timeout_ms)
Maximum number of queries accumulate (async_insert_max_query_number)
Critical Configuration Settings
Core Settings
-- Enable async inserts (0=disabled, 1=enabled)
SETasync_insert=1;-- Wait behavior (STRONGLY RECOMMENDED: use 1)
-- 0 = fire-and-forget mode (risky - no error feedback)
-- 1 = wait for data to be written to storage
SETwait_for_async_insert=1;-- Buffer flush conditions
SETasync_insert_max_data_size=1000000;-- 1MB default
SETasync_insert_busy_timeout_ms=1000;-- 1 second
SETasync_insert_max_query_number=100;-- max queries before flush
Adaptive Timeout (Since 24.3)
-- Adaptive timeout automatically adjusts flush timing based on server load
-- Default: 1 (enabled) - OVERRIDES manual timeout settings
-- Set to 0 for deterministic behavior with manual settings
SETasync_insert_use_adaptive_busy_timeout=0;
Important Behavioral Notes
What Works and What Doesn’t
✅ Works with Async Inserts:
Direct INSERT with VALUES
INSERT with FORMAT (JSONEachRow, CSV, etc.)
Native protocol inserts (since 22.x)
❌ Does NOT Work:
INSERT .. SELECT statements - Other strategies are needed for managing performance and load. Do not use async_insert.
Data Safety Considerations
ALWAYS use wait_for_async_insert = 1 in production!
Risks with wait_for_async_insert = 0:
Silent data loss on errors (read-only table, disk full, too many parts)
Data loss on sudden restart (no fsync by default)
Data not immediately queryable after acknowledgment
No error feedback to client
Deduplication Behavior
Sync inserts: Automatic deduplication enabled by default
Async inserts: Deduplication disabled by default
Enable with async_insert_deduplicate = 1 (since 22.x)
Warning: Don’t use with deduplicate_blocks_in_dependent_materialized_views = 1
features / improvements
Async insert dedup: Support block deduplication for asynchronous inserts. Before this change, async inserts did not support deduplication, because multiple small inserts coexisted in one inserted batch:
Added system table asynchronous_insert_log. It contains information about asynchronous inserts (including results of queries in fire-and-forget mode. (with wait_for_async_insert=0)) for better introspection #42040
Support async inserts in clickhouse-client for queries with inlined data (Native protocol):
Fixed bug which could lead to deadlock while using asynchronous inserts #43233
.
Fix crash when async inserts with deduplication are used for ReplicatedMergeTree tables using a nondefault merging algorithm #51676
Async inserts not working with log_comment setting 48430
Fix misbehaviour with async inserts with deduplication #50663
Reject Insert if async_insert=1 and deduplicate_blocks_in_dependent_materialized_views=1#60888
Disable async_insert_use_adaptive_busy_timeout correctly with compatibility settings #61486
observability / introspection
In 22.x versions, it is not possible to relate part_log/query_id column with asynchronous_insert_log/query_id column. We need to use query_log/query_id:
asynchronous_insert_log shows up the query_id and flush_query_id of each async insert. The query_id from asynchronous_insert_log shows up in the system.query_log as type = 'QueryStart' but the same query_id does not show up in the query_id column of the system.part_log. Because the query_id column in the part_log is the identifier of the INSERT query that created a data part, and it seems it is for sync INSERTS but not for async inserts.
So in asynchronous_inserts table you can check the current batch that still has not been flushed. In the asynchronous_insert_log you can find a log of all the flushed async inserts.
This has been improved in ClickHouse 23.7 Flush queries for async inserts (the queries that do the final push of data) are now logged in the system.query_log where they appear as query_kind = 'AsyncInsertFlush'#51160
Versions
23.8 is a good version to start using async inserts because of the improvements and bugfixes.
24.3 the new adaptive timeout mechanism has been added so ClickHouse will throttle the inserts based on the server load.#58486
This new feature is enabled by default and will OVERRRIDE current async insert settings, so better to disable it if your async insert settings are working. Here’s how to do it in a clickhouse-client session: SET async_insert_use_adaptive_busy_timeout = 0; You can also add it as a setting on the INSERT or as a profile setting.
Generate test data in Native and TSV format ( 100 millions rows )
Text formats and Native format require different set of settings, here I want to find / demonstrate mandatory minimum of settings for any case.
clickhouse-client -q \
'SELECT toInt64(number) A, toString(number) S FROM numbers(100000000) FORMAT Native' > t.native
clickhouse-client -q \
'SELECT toInt64(number) A, toString(number) S FROM numbers(100000000) FORMAT TSV' > t.tsv
Insert with default settings (not atomic)
DROP TABLE IF EXISTS trg;CREATE TABLE trg(A Int64, S String)Engine=MergeTree ORDER BY A;-- Load data in Native format
clickhouse-client -q 'INSERT INTO trg FORMAT Native' <t.native
-- Check how many parts is created
SELECT
count(),
min(rows),
max(rows),
sum(rows)FROM system.parts
WHERE (level= 0) AND (table='trg');┌─count()─┬─min(rows)─┬─max(rows)─┬─sum(rows)─┐
│ 90 │ 890935 │ 1113585 │ 100000000 │
└─────────┴───────────┴───────────┴───────────┘
--- 90 parts! was created - not atomic
DROP TABLE IF EXISTS trg;CREATE TABLE trg(A Int64, S String)Engine=MergeTree ORDER BY A;-- Load data in TSV format
clickhouse-client -q 'INSERT INTO trg FORMAT TSV' <t.tsv
-- Check how many parts is created
SELECT
count(),
min(rows),
max(rows),
sum(rows)FROM system.parts
WHERE (level= 0) AND (table='trg');┌─count()─┬─min(rows)─┬─max(rows)─┬─sum(rows)─┐
│ 85 │ 898207 │ 1449610 │ 100000000 │
└─────────┴───────────┴───────────┴───────────┘
--- 85 parts! was created - not atomic
Insert with adjusted settings (atomic)
Atomic insert use more memory because it needs 100 millions rows in memory.
DROP TABLE IF EXISTS trg;CREATE TABLE trg(A Int64, S String)Engine=MergeTree ORDER BY A;clickhouse-client --input_format_parallel_parsing=0\
--min_insert_block_size_bytes=0\
--min_insert_block_size_rows=1000000000\
-q 'INSERT INTO trg FORMAT Native' <t.native
-- Check that only one part is created
SELECT
count(),
min(rows),
max(rows),
sum(rows)FROM system.parts
WHERE (level= 0) AND (table='trg');┌─count()─┬─min(rows)─┬─max(rows)─┬─sum(rows)─┐
│ 1 │ 100000000 │ 100000000 │ 100000000 │
└─────────┴───────────┴───────────┴───────────┘
-- 1 part, success.
DROP TABLE IF EXISTS trg;CREATE TABLE trg(A Int64, S String)Engine=MergeTree ORDER BY A;-- Load data in TSV format
clickhouse-client --input_format_parallel_parsing=0\
--min_insert_block_size_bytes=0\
--min_insert_block_size_rows=1000000000\
-q 'INSERT INTO trg FORMAT TSV' <t.tsv
-- Check that only one part is created
SELECT
count(),
min(rows),
max(rows),
sum(rows)FROM system.parts
WHERE (level= 0) AND (table='trg');┌─count()─┬─min(rows)─┬─max(rows)─┬─sum(rows)─┐
│ 1 │ 100000000 │ 100000000 │ 100000000 │
└─────────┴───────────┴───────────┴───────────┘
-- 1 part, success.
2.16 - ClickHouse® Projections
Using this ClickHouse feature to optimize queries
Projections in ClickHouse act as inner tables within a main table, functioning as a mechanism to optimize queries by using these inner tables when only specific columns are needed. Essentially, a projection is similar to a Materialized View
with an AggregatingMergeTree engine
, designed to be automatically populated with relevant data.
However, too many projections can lead to excess storage, much like overusing Materialized Views. Projections share the same lifecycle as the main table, meaning they are automatically backfilled and don’t require query rewrites, which is particularly advantageous when integrating with BI tools.
Projection parts are stored within the main table parts, and their merges occur simultaneously as the main table merges, ensuring data consistency without additional maintenance.
compared to a separate table+MV setup:
A separate table gives you more freedom (like partitioning, granularity, etc), but projections - more consistency (parts managed as a whole)
Projections do not support many features (like indexes and FINAL). That becomes better with recent versions, but still a drawback
The design approach for projections is the same as for indexes. Create a table and give it to users. If you encounter a slower query, add a projection for that particular query (or set of similar queries). You can create 10+ projections per table, materialize, drop, etc - the very same as indexes. You exchange query speed for disk space/IO and CPU needed to build and rebuild projections on merges.
Links
Amos Bird - kuaishou.com - Projections in ClickHouse. slides
. video
A query analyzer should have a reason for using a projection and should not have any limitation to do so.
the query should use ONLY the columns defined in the projection.
There should be a lot of data to read from the main table (gigabytes)
for ORDER BY projection WHERE statement referring to a column should be in the query
FINAL queries do not work with projections.
tables with DELETEd rows do not work with projections. This is because rows in a projection may be affected by a DELETE operation. But there is a MergeTree setting lightweight_mutation_projection_mode to change the behavior (Since 24.7)
Projection is used only if it is cheaper to read from it than from the table (expected amount of rows and GBs read is smaller)
Projection should be materialized. Verify that all parts have the needed projection by comparing system.parts and system.projection_parts (see query below)
a bug in a Clickhouse version. Look at changelog
and search for projection.
If there are many projections per table, the analyzer can select any of them. If you think that it is better, use settings preferred_optimize_projection_name or force_optimize_projection_name
If expressions are used instead of plain column names, the query should use the exact expression as defined in the projection with the same functions and modifiers. Use column aliases to make the query the very same as in the projection definition:
SELECT
p.database AS base_database,
p.table AS base_table,
p.name AS base_part_name, -- Name of the part in the base table
p.has_lightweight_delete,
pp.active
FROM system.parts AS p -- Alias for the base table's parts
LEFT JOIN system.projection_parts AS pp -- Alias for the projection's parts
ON p.database = pp.database AND p.table = pp.table
AND p.name = pp.parent_name
AND pp.name = 'projection'
WHERE
p.database = 'database'
AND p.table = 'table'
AND p.active -- Consider only active parts of the base table
-- and not pp.active -- see only missed in the list
ORDER BY p.database, p.table, p.name;
Recalculate on Merge
What happens in the case of non-trivial background merges in ReplacingMergeTree, AggregatingMergeTree and similar, and OPTIMIZE table DEDUPLICATE queries?
Before version 24.8, projections became out of sync with the main data.
Somewhere later (before 25.3) ignore option was introduced. It can be helpful for cases when SummingMergeTree is used with Projections and no DELETE operation in any flavor (Replacing/Collapsing/DELETE/ALTER DELETE) is executed over the table.
However, projection usage is still disabled for FINAL queries. So, you have to use OPTIMIZE FINAL or SELECT …GROUP BY instead of FINAL for fighting duplicates between parts
CREATE TABLE users (uid Int16, name String, version Int16,
projection xx (
select name,uid,version order by name
)
) ENGINE=ReplacingMergeTree order by uid
settings deduplicate_merge_projection_mode='rebuild'
;
INSERT INTO users
SELECT
number AS uid,
concat('User_', toString(uid)) AS name,
1 AS version
FROM numbers(100000);
INSERT INTO users
SELECT
number AS uid,
concat('User_', toString(uid)) AS name,
2 AS version
FROM numbers(100000);
SELECT 'duplicate',name,uid,version FROM users
where name ='User_98304'
settings force_optimize_projection=1 ;
SELECT 'dedup by group by/limit 1 by',name,uid,version FROM users
where name ='User_98304'
order by version DESC
limit 1 by uid
settings force_optimize_projection=1
;
optimize table users final ;
SELECT 'dedup after optimize',name,uid,version FROM users
where name ='User_98304'
settings force_optimize_projection=1 ;
SELECT
database,
table,
name,
formatReadableSize(sum(data_compressed_bytes) AS size) AS compressed,
formatReadableSize(sum(data_uncompressed_bytes) AS usize) AS uncompressed,
round(usize / size, 2) AS compr_rate,
sum(rows) AS rows,
count() AS part_count
FROM system.projection_parts
WHERE active
GROUP BY
database,
table,
name
ORDER BY size DESC;
How to receive a list of tables with projections?
select database, table from system.tables
where create_table_query ilike '%projection%'
and database <> 'system'
Examples
Aggregating ClickHouse projections
createtablez(BrowserString,CountryUInt8,FFloat64)Engine=MergeTreeorderbyBrowser;insertintozselecttoString(number%9999),number%33,1fromnumbers(100000000);--Q1)
selectsum(F),BrowserfromzgroupbyBrowserformatNull;Elapsed:0.205sec.Processed100.00millionrows--Q2)
selectsum(F),Browser,CountryfromzgroupbyBrowser,CountryformatNull;Elapsed:0.381sec.Processed100.00millionrows--Q3)
selectsum(F),count(),Browser,CountryfromzgroupbyBrowser,CountryformatNull;Elapsed:0.398sec.Processed100.00millionrowsaltertablezaddprojectionpp(selectBrowser,Country,count(),sum(F)groupbyBrowser,Country);altertablezmaterializeprojectionpp;---- 0 = don't use proj, 1 = use projection
setallow_experimental_projection_optimization=1;--Q1)
selectsum(F),BrowserfromzgroupbyBrowserformatNull;Elapsed:0.003sec.Processed22.43thousandrows--Q2)
selectsum(F),Browser,CountryfromzgroupbyBrowser,CountryformatNull;Elapsed:0.004sec.Processed22.43thousandrows--Q3)
selectsum(F),count(),Browser,CountryfromzgroupbyBrowser,CountryformatNull;Elapsed:0.005sec.Processed22.43thousandrows
Emulation of an inverted index using orderby projection
You can create an orderby projection and include all columns of a table, but if a table is very wide it will double the amount of stored data. This example demonstrate a trick, we create an orderby projection and include primary key columns and the target column and sort by the target column. This allows using subquery to find primary key values
and after that to query the table using the primary key.
CREATETABLEtest_a(`src`String,`dst`String,`other_cols`String,PROJECTIONp1(SELECTsrc,dstORDERBYdst))ENGINE=MergeTreeORDERBYsrc;insertintotest_aselectnumber,-number,'other_col '||toString(number)fromnumbers(1e8);select*fromtest_awheresrc='42';┌─src─┬─dst─┬─other_cols───┐│42│-42│other_col42│└─────┴─────┴──────────────┘1rowinset.Elapsed:0.005sec.Processed16.38thousandrows,988.49KB(3.14millionrows/s.,189.43MB/s.)select*fromtest_awheredst='-42';┌─src─┬─dst─┬─other_cols───┐│42│-42│other_col42│└─────┴─────┴──────────────┘1rowinset.Elapsed:0.625sec.Processed100.00millionrows,1.79GB(160.05millionrows/s.,2.86GB/s.)-- optimization using projection
select*fromtest_awheresrcin(selectsrcfromtest_awheredst='-42')anddst='-42';┌─src─┬─dst─┬─other_cols───┐│42│-42│other_col42│└─────┴─────┴──────────────┘1rowinset.Elapsed:0.013sec.Processed32.77thousandrows,660.75KB(2.54millionrows/s.,51.26MB/s.)
Elapsed: 0.625 sec. Processed 100.00 million rows – not optimized
VS
Elapsed: 0.013 sec. Processed 32.77 thousand rows – optimized
This article provides an overview of the different methods to handle row deletion in ClickHouse, using tombstone columns and ALTER UPDATE or DELETE. The goal is to highlight the performance impacts of different techniques and storage settings, including a scenario using S3 for remote storage.
Creating a Test Table
We will start by creating a simple MergeTree table with a tombstone column (is_active) to track active rows:
INSERTINTOtest_delete(key,ts,value_a,value_b,value_c)SELECTnumber,1,concat('some_looong_string',toString(number)),concat('another_long_str',toString(number)),concat('string',toString(number))FROMnumbers(10000000);INSERTINTOtest_delete(key,ts,value_a,value_b,value_c)VALUES(400000,2,'totally different string','another totally different string','last string');
Hard Deletion Using ALTER DELETE
If you need to completely remove a row from the table, you can use ALTER DELETE:
ALTERTABLEtest_deleteDELETEWHERE(key=400000)AND(ts=1);Ok.0rowsinset.Elapsed:1.101sec.-- 20 times slower!!!
However, this operation is significantly slower compared to the ALTER UPDATE approach. For example:
ALTER DELETE: Takes around 1.1 seconds
ALTER UPDATE: Only 0.05 seconds
The reason for this difference is that DELETE modifies the physical data structure, while UPDATE merely changes a column value.
SELECT*FROMtest_deleteWHEREkey=400000;┌────key─┬─ts─┬─value_a──────────────────┬─value_b──────────────────────────┬─value_c─────┬─is_active─┐│400000│2│totallydifferentstring│anothertotallydifferentstring│laststring│1│└────────┴────┴──────────────────────────┴──────────────────────────────────┴─────────────┴───────────┘-- For ReplacingMergeTree -> https://clickhouse.com/docs/en/engines/table-engines/mergetree-family/replacingmergetree
OPTIMIZETABLEtest_deleteFINAL;Ok.0rowsinset.Elapsed:2.230sec.-- 40 times slower!!!
SELECT*FROMtest_deleteWHEREkey=400000┌────key─┬─ts─┬─value_a──────────────────┬─value_b──────────────────────────┬─value_c─────┬─is_active─┐│400000│2│totallydifferentstring│anothertotallydifferentstring│laststring│1│└────────┴────┴──────────────────────────┴──────────────────────────────────┴─────────────┴───────────┘
Soft Deletion (via ALTER UPDATE): A quicker approach that does not involve physical data deletion but rather updates the tombstone column.
Hard Deletion (via ALTER DELETE): Can take significantly longer, especially with large datasets stored in remote storage like S3.
Optimizing for Faster Deletion with S3 Storage
If using S3 for storage, the DELETE operation becomes even slower due to the overhead of handling remote data. Here’s an example with a table using S3-backed storage:
CREATETABLEtest_delete(`key`UInt32,`value_a`String,`value_b`String,`value_c`String,`is_deleted`UInt8DEFAULT0)ENGINE=MergeTreeORDERBYkeySETTINGSstorage_policy='s3tiered';INSERTINTOtest_delete(key,value_a,value_b,value_c)SELECTnumber,concat('some_looong_string',toString(number)),concat('another_long_str',toString(number)),concat('really long string',toString(arrayMap(i->cityHash64(i*number),range(50))))FROMnumbers(10000000);OPTIMIZETABLEtest_deleteFINAL;ALTERTABLEtest_deleteMOVEPARTITIONtuple()TODISK's3disk';SELECTcount()FROMtest_delete;┌──count()─┐│10000000│└──────────┘1rowinset.Elapsed:0.002sec.
DELETE Using ALTER UPDATE and Row Policy
You can also control visibility at the query level using row policies. For example, to only show rows where is_active = 1:
To delete a row using ALTER UPDATE:
CREATEROWPOLICYpol1ONtest_deleteUSINGis_active=1TOall;SELECTcount()FROMtest_delete;-- select count() became much slower, it reads data now, not metadata
┌──count()─┐│10000000│└──────────┘1rowinset.Elapsed:0.314sec.Processed10.00millionrows,10.00MB(31.84millionrows/s.,31.84MB/s.)ALTERTABLEtest_deleteUPDATEis_active=0WHERE(key=400000)settingsmutations_sync=2;0rowsinset.Elapsed:1.256sec.SELECTcount()FROMtest_delete;┌─count()─┐│9999999│└─────────┘
This impacts the performance of queries like SELECT count(), as ClickHouse now needs to scan data instead of reading metadata.
This operation is faster, with an elapsed time of around 1.28 seconds in this case:
The choice between ALTER UPDATE and ALTER DELETE depends on your use case. For soft deletes, updating a tombstone column is significantly faster and easier to manage. However, if you need to physically remove rows, be mindful of the performance costs, especially with remote storage like S3.
Since 25.6 - final supports skip indexes (use_skip_indexes_if_final=1 by default)
Since 25.12 - apply_prewhere_after_final and apply_row_policy_after_final settings for correct PREWHERE/row policy handling with FINAL
Since 26.2 - enable_automatic_decision_for_merging_across_partitions_for_final=1 by default (auto-enables cross-partition optimization when safe)
Partitioning
Proper partition design could speed up FINAL processing.
For example, if you have a table with Daily partitioning, you can:
After day end + some time interval during which you can get some updates run OPTIMIZE TABLE xxx PARTITION 'prev_day' FINAL
or add table SETTINGS min_age_to_force_merge_seconds=86400,min_age_to_force_merge_on_partition_only=1
In that case, using FINAL with do_not_merge_across_partitions_select_final will be cheap or even zero.
Example:
DROPTABLEIFEXISTSrepl_tbl;CREATETABLErepl_tbl(`key`UInt32,`val_1`UInt32,`val_2`String,`val_3`String,`val_4`String,`val_5`UUID,`ts`DateTime)ENGINE=ReplacingMergeTree(ts)PARTITIONBYtoDate(ts)ORDERBYkey;INSERTINTOrepl_tblSELECTnumberaskey,rand()asval_1,randomStringUTF8(10)asval_2,randomStringUTF8(5)asval_3,randomStringUTF8(4)asval_4,generateUUIDv4()asval_5,'2020-01-01 00:00:00'astsFROMnumbers(10000000);OPTIMIZETABLErepl_tblPARTITIONID'20200101'FINAL;INSERTINTOrepl_tblSELECTnumberaskey,rand()asval_1,randomStringUTF8(10)asval_2,randomStringUTF8(5)asval_3,randomStringUTF8(4)asval_4,generateUUIDv4()asval_5,'2020-01-02 00:00:00'astsFROMnumbers(10000000);OPTIMIZETABLErepl_tblPARTITIONID'20200102'FINAL;INSERTINTOrepl_tblSELECTnumberaskey,rand()asval_1,randomStringUTF8(10)asval_2,randomStringUTF8(5)asval_3,randomStringUTF8(4)asval_4,generateUUIDv4()asval_5,'2020-01-03 00:00:00'astsFROMnumbers(10000000);OPTIMIZETABLErepl_tblPARTITIONID'20200103'FINAL;INSERTINTOrepl_tblSELECTnumberaskey,rand()asval_1,randomStringUTF8(10)asval_2,randomStringUTF8(5)asval_3,randomStringUTF8(4)asval_4,generateUUIDv4()asval_5,'2020-01-04 00:00:00'astsFROMnumbers(10000000);OPTIMIZETABLErepl_tblPARTITIONID'20200104'FINAL;SYSTEMSTOPMERGESrepl_tbl;INSERTINTOrepl_tblSELECTnumberaskey,rand()asval_1,randomStringUTF8(10)asval_2,randomStringUTF8(5)asval_3,randomStringUTF8(4)asval_4,generateUUIDv4()asval_5,'2020-01-05 00:00:00'astsFROMnumbers(10000000);SELECTcount()FROMrepl_tblWHERENOTignore(*)┌──count()─┐│50000000│└──────────┘1rowsinset.Elapsed:1.504sec.Processed50.00millionrows,6.40GB(33.24millionrows/s.,4.26GB/s.)SELECTcount()FROMrepl_tblFINALWHERENOTignore(*)┌──count()─┐│10000000│└──────────┘1rowsinset.Elapsed:3.314sec.Processed50.00millionrows,6.40GB(15.09millionrows/s.,1.93GB/s.)/* more that 2 time slower, and will get worse once you will have more data */setdo_not_merge_across_partitions_select_final=1;SELECTcount()FROMrepl_tblFINALWHERENOTignore(*)┌──count()─┐│50000000│└──────────┘1rowsinset.Elapsed:1.850sec.Processed50.00millionrows,6.40GB(27.03millionrows/s.,3.46GB/s.)/* only 0.35 sec slower, and while partitions have about the same size that extra cost will be about constant */
Since 26.2, enable_automatic_decision_for_merging_across_partitions_for_final=1 (default) auto-enables this when partition key columns are included in PRIMARY KEY
Light ORDER BY
All columns specified in ORDER BY will be read during FINAL processing, creating additional disk load. Use fewer columns and lighter column types to create faster queries.
Example: UUID vs UInt64
CREATE TABLE uuid_table (id UUID, value UInt64) ENGINE = ReplacingMergeTree() ORDER BY id;
CREATE TABLE uint64_table (id UInt64,value UInt64) ENGINE = ReplacingMergeTree() ORDER BY id;
INSERT INTO uuid_table SELECT generateUUIDv4(), number FROM numbers(5E7);
INSERT INTO uint64_table SELECT number, number FROM numbers(5E7);
SELECT sum(value) FROM uuid_table FINAL format JSON;
SELECT sum(value) FROM uint64_table FINAL format JSON;
When enable_vertical_final=1 (default since 24.1), ClickHouse uses a different deduplication strategy:
Marks duplicate rows as deleted instead of merging them immediately
Filters deleted rows in a later processing step
Reads different columns from different parts in parallel
This improves performance for queries that read only a subset of columns, as non-ORDER BY columns can be read independently from different parts.
PREWHERE and Row Policies with FINAL (25.12+)
By default, PREWHERE and row policies are applied before FINAL deduplication. This can cause incorrect results when:
PREWHERE references columns that differ across duplicate rows
Row policies should filter based on the “winning” row values after deduplication
Use these settings when needed:
apply_prewhere_after_final=1 - Apply PREWHERE after deduplication
apply_row_policy_after_final=1 - Apply row policies after deduplication
Example problem: if you have ReplacingMergeTree with a deleted column and PREWHERE filters on it, without apply_prewhere_after_final=1 you may get wrong results because PREWHERE sees rows before FINAL picks the winner.
FINAL with skip indexes:
Both use_skip_indexes_if_final and use_skip_indexes_if_final_exact_mode are enabled by default since 25.6
The main purpose of JOIN table engine is to avoid building the right table for joining on each query execution. So it’s usually used when you have a high amount of fast queries which share the same right table for joining.
Updates
It’s possible to update rows with setting join_any_take_last_row enabled.
If we look at our query, we only care if sale belongs to customer named James or Lisa and dont care for rest of cases. We can use that.
Usually, ClickHouse is able to pushdown conditions, but not in that case, when conditions itself part of function expression, so you can manually help in those cases.
Reduce attribute columns (push expression before JOIN step)
Our row from the right table consists of 2 fields: customer_sk and c_first_name.
First one is needed to JOIN by it, so it’s not much we can do here, but we can transform a bit of the second column.
Again, let’s look in how we use this column in main query:
We calculate 2 simple conditions(which don’t have any dependency on data from the left table) and nothing more.
It does mean that we can move this calculation to the right table, it will make 3 improvements!
Right table will be smaller -> smaller RAM usage -> better cache hits
We will calculate our conditions over a smaller data set. In the right table we have only 10 million rows and after joining because of the left table we have 2 billion rows -> 200 times improvement!
Our resulting table after JOIN will not have an expensive String column, only 1 byte UInt8 instead -> less copy of data in memory.
Let’s do it:
There are several ways to rewrite that query, let’s not bother with simple once and go straight to most optimized:
Put our 2 conditions in hand-made bitmask:
In order to do that we will take our conditions and multiply them by
As you can see, if you do it in that way, your conditions will not interfere with each other!
But we need to be careful with the wideness of the resulting numeric type.
Let’s write our calculations in type notation:
UInt8 + UInt8*2 -> UInt8 + UInt16 -> UInt32
But we actually do not use more than first 2 bits, so we need to cast this expression back to UInt8
Last thing to do is use the bitTest function in order to get the result of our condition by its position.
But can we make something with our JOIN key column?
It’s type is Nullable(UInt64)
Let’s check if we really need to have a 0…18446744073709551615 range for our customer id, it sure looks like that we have much less people on earth than this number. The same about Nullable trait, we don’t care about Nulls in customer_id
SELECT max(c_customer_sk) FROM customer
For sure, we don’t need that wide type.
Lets remove Nullable trait and cast column to UInt32, twice smaller in byte size compared to UInt64.
Another 10% perf improvement from using UInt32 key instead of Nullable(Int64)
Looks pretty neat, we almost got 10 times improvement over our initial query.
Can we do better?
Probably, but it does mean that we need to get rid of JOIN.
Use IN clause instead of JOIN
Despite that all DBMS support ~ similar feature set, feature performance on different database are different:
Small example, for PostgreSQL, is recommended to replace big IN clauses with JOINs, because IN clauses have bad performance.
But for ClickHouse it’s the opposite!, IN works faster than JOIN, because it only checks key existence in HashSet and doesn’t need to extract any data from the right table in IN.
But first is a short introduction. What the hell is a Dictionary with a FLAT layout?
Basically, it’s just a set of Array’s for each attribute where the value position in the attribute array is just a dictionary key
For sure it put heavy limitation about what dictionary key could be, but it gives really good advantages:
It’s really small memory usage (good cache hit rate) & really fast key lookups (no complex hash calculation)
So, if it’s that great what are the caveats?
First one is that your keys should be ideally autoincremental (with small number of gaps)
And for second, lets look in that simple query and write down all calculations:
SELECTsumIf(ss_sales_price,dictGet(...)='James')
Dictionary call (2 billion times)
String equality check (2 billion times)
Although it’s really efficient in terms of dictGet call and memory usage by Dictionary, it still materializes the String column (memcpy) and we pay a penalty of execution condition on top of such a string column for each row.
But what if we could first calculate our required condition and create such a “Dictionary” ad hoc in query time?
And we can actually do that!
But let’s repeat our analysis again:
As we can see, that Array approach doesn’t even notice that we increased the amount of conditions by 2 times.
2.25 - JSONExtract to parse many attributes at a time
JSONExtract to parse many attributes at a time
Don’t use several JSONExtract for parsing big JSON. It’s very ineffective, slow, and consumes CPU. Try to use one JSONExtract to parse String to Tupes and next get the needed elements:
WITHJSONExtract(json,'Tuple(name String, id String, resources Nested(description String, format String, tracking_summary Tuple(total UInt32, recent UInt32)), extras Nested(key String, value String))')ASparsed_jsonSELECTtupleElement(parsed_json,'name')ASname,tupleElement(parsed_json,'id')ASid,tupleElement(tupleElement(parsed_json,'resources'),'description')AS`resources.description`,tupleElement(tupleElement(parsed_json,'resources'),'format')AS`resources.format`,tupleElement(tupleElement(tupleElement(parsed_json,'resources'),'tracking_summary'),'total')AS`resources.tracking_summary.total`,tupleElement(tupleElement(tupleElement(parsed_json,'resources'),'tracking_summary'),'recent')AS`resources.tracking_summary.recent`FROMurl('https://raw.githubusercontent.com/jsonlines/guide/master/datagov100.json','JSONAsString','json String')
However, such parsing requires static schema - all keys should be presented in every row, or you will get an empty structure. More dynamic parsing requires several JSONExtract invocations, but still - try not to scan the same data several times:
For very subnested dynamic JSON files, if you don’t need all the keys, you could parse sublevels specifically. Still this will require several JSONExtract calls but each call will have less data to parse so complexity will be reduced for each pass: O(log n)
CREATETABLEbetter_parsing(jsonString)ENGINE=Memory;INSERTINTObetter_parsingFORMATJSONAsString{"timestamp":"2024-06-12T14:30:00.001Z","functionality":"DOCUMENT","flowId":"210abdee-6de5-474a-83da-748def0facc1","step":"BEGIN","env":"dev","successful":true,"data":{"action":"initiate_view","stats":{"total":1,"success":1,"failed":0},"client_ip":"192.168.1.100","client_port":"8080"}}WITHparsed_contentAS(SELECTJSONExtractKeysAndValues(json,'String')AS1st_level_arr,mapFromArrays(1st_level_arr.1,1st_level_arr.2)AS1st_level_map,JSONExtractKeysAndValues(1st_level_map['data'],'String')AS2nd_level_arr,mapFromArrays(2nd_level_arr.1,2nd_level_arr.2)AS2nd_level_map,JSONExtractKeysAndValues(2nd_level_map['stats'],'String')AS3rd_level_arr,mapFromArrays(3rd_level_arr.1,3rd_level_arr.2)AS3rd_level_mapFROMjson_tests.better_parsing)SELECT1st_level_map['timestamp']AStimestamp,2nd_level_map['action']ASaction,3rd_level_map['total']AStotal3rd_level_map['nokey']ASno_key_emptyFROMparsed_content/*
┌─timestamp────────────────┬─action────────┬─total─┬─no_key_empty─┐
1. │ 2024-06-12T14:30:00.001Z │ initiate_view │ 1 │ │
└──────────────────────────┴───────────────┴───────┴──────────────┘
1 row in set. Elapsed: 0.003 sec.
*/
2.26 - KILL QUERY
KILL QUERY
Unfortunately not all queries can be killed.
KILL QUERY only sets a flag that must be checked by the query.
A query pipeline is checking this flag before a switching to next block. If the pipeline has stuck somewhere in the middle it cannot be killed.
If a query does not stop, the only way to get rid of it is to restart ClickHouse®.
Q. We are trying to abort running queries when they are being replaced with a new one. We are setting the same query id for this. In some cases this error happens:
Query with id = e213cc8c-3077-4a6c-bc78-e8463adad35d is already running and can’t be stopped
The query is still being killed but the new one is not being executed. Do you know anything about this and if there is a fix or workaround for it?
I guess you use replace_running_query + replace_running_query_max_wait_ms.
Unfortunately it’s not always possible to kill the query at random moment of time.
Kill don’t send any signals, it just set a flag. Which gets (synchronously) checked at certain moments of query execution, mostly after finishing processing one block and starting another.
On certain stages (executing scalar sub-query) the query can not be killed at all. This is a known issue and requires an architectural change to fix it.
I see. Is there a workaround?
This is our use case:
A user requests an analytics report which has a query that takes several settings, the user makes changes to the report (e.g. to filters, metrics, dimensions…). Since the user changed what he is looking for the query results from the initial query are never used and we would like to cancel it when starting the new query (edited)
How to know if ALTER TABLE … DELETE/UPDATE mutation ON CLUSTER was finished successfully on all the nodes?
A. mutation status in system.mutations is local to each replica, so use
SELECThostname(),*FROMclusterAllReplicas('your_cluster_name',system.mutations);-- you can also add WHERE conditions to that query if needed.
Look on is_done and latest_fail_reason columns
Are mutations being run in parallel or they are sequential in ClickHouse® (in scope of one table)
ClickHouse runs mutations sequentially, but it can combine several mutations in a single and apply all of them in one merge.
Sometimes, it can lead to problems, when a combined expression which ClickHouse needs to execute becomes really big. (If ClickHouse combined thousands of mutations in one)
Because ClickHouse stores data in independent parts, ClickHouse is able to run mutation(s) merges for each part independently and in parallel.
It also can lead to high resource utilization, especially memory usage if you use x IN (SELECT ... FROM big_table) statements in mutation, because each merge will run and keep in memory its own HashSet. You can avoid this problem, if you will use Dictionary approach
for such mutations.
Parallelism of mutations controlled by settings:
SELECT*FROMsystem.merge_tree_settingsWHEREnameLIKE'%mutation%'┌─name───────────────────────────────────────────────┬─value─┬─changed─┬─description──────────────────────────────────────────────────────────────────────────────────────────────────────────────────────────────────────────────────────────────────┬─type───┐│max_replicated_mutations_in_queue│8│0│HowmanytasksofmutatingpartsareallowedsimultaneouslyinReplicatedMergeTreequeue.│UInt64││number_of_free_entries_in_pool_to_execute_mutation│20│0│Whenthereislessthanspecifiednumberoffreeentriesinpool,donotexecutepartmutations.Thisistoleavefreethreadsforregularmergesandavoid"Too many parts"│UInt64│└────────────────────────────────────────────────────┴───────┴─────────┴──────────────────────────────────────────────────────────────────────────────────────────────────────────────────────────────────────────────────────────────────────────────┴────────┘
2.30 - OPTIMIZE vs OPTIMIZE FINAL
OPTIMIZE vs OPTIMIZE FINAL
OPTIMIZE TABLE xyz – this initiates an unscheduled merge.
Example
You have 40 parts in 3 partitions. This unscheduled merge selects some partition (i.e. February) and selects 3 small parts to merge, then merge them into a single part. You get 38 parts in the result.
OPTIMIZE TABLE xyz FINAL – initiates a cycle of unscheduled merges.
ClickHouse® merges parts in this table until will remains 1 part in each partition (if a system has enough free disk space). As a result, you get 3 parts, 1 part per partition. In this case, ClickHouse rewrites parts even if they are already merged into a single part. It creates a huge CPU / Disk load if the table (XYZ) is huge. ClickHouse reads / uncompress / merge / compress / writes all data in the table.
If this table has size 1TB it could take around 3 hours to complete.
So we don’t recommend running OPTIMIZE TABLE xyz FINAL against tables with more than 10million rows.
2.31 - Parameterized views
Parameterized views
ClickHouse® versions 23.1+ (23.1.6.42, 23.2.5.46, 23.3.1.2823)
have inbuilt support for parametrized views
:
A server restart is required for the default value to be applied
$ systemctl restart clickhouse-server
Now you can set settings as any other settings, and query them using getSetting() function.
SETmy2_category='hot deals';SELECTgetSetting('my2_category');┌─getSetting('my2_category')─┐│hotdeals│└────────────────────────────┘-- you can query ClickHouse settings as well
SELECTgetSetting('max_threads')┌─getSetting('max_threads')─┐│8│└───────────────────────────┘
SELECTsuppkey,brand,category,quantityFROMsales_wARRAYJOIN[AA,AB,AC,AD]ASquantity,splitByString(', ','AA, AB, AC, AD')AScategoryORDERBYsuppkeyASC┌─suppkey─┬─brand───┬─category─┬─quantity─┐│1│BRAND_A│AA│1500││1│BRAND_A│AB│4200││1│BRAND_A│AC│1600││1│BRAND_A│AD│9800││2│BRAND_B│AA│6200││2│BRAND_B│AB│1300││2│BRAND_B│AC│5800││2│BRAND_B│AD│3100││3│BRAND_C│AA│5000││3│BRAND_C│AB│8900││3│BRAND_C│AC│6900││3│BRAND_C│AD│3400│└─────────┴─────────┴──────────┴──────────┘SELECTsuppkey,brand,tpl.1AScategory,tpl.2ASquantityFROMsales_wARRAYJOINtupleToNameValuePairs(CAST((AA,AB,AC,AD),'Tuple(AA UInt32, AB UInt32, AC UInt32, AD UInt32)'))AStplORDERBYsuppkeyASC┌─suppkey─┬─brand───┬─category─┬─quantity─┐│1│BRAND_A│AA│1500││1│BRAND_A│AB│4200││1│BRAND_A│AC│1600││1│BRAND_A│AD│9800││2│BRAND_B│AA│6200││2│BRAND_B│AB│1300││2│BRAND_B│AC│5800││2│BRAND_B│AD│3100││3│BRAND_C│AA│5000││3│BRAND_C│AB│8900││3│BRAND_C│AC│6900││3│BRAND_C│AD│3400│└─────────┴─────────┴──────────┴──────────┘
2.34 - Possible deadlock avoided. Client should retry
Possible deadlock avoided. Client should retry
In ClickHouse® version 19.14 a serious issue was found: a race condition that can lead to server deadlock. The reason for that was quite fundamental, and a temporary workaround for that was added (“possible deadlock avoided”).
Those locks are one of the fundamental things that the core team was actively working on in 2020.
In 20.3 some of the locks leading to that situation were removed as a part of huge refactoring.
In 20.4 more locks were removed, the check was made configurable (see lock_acquire_timeout ) so you can say how long to wait before returning that exception
In 20.5 heuristics of that check (“possible deadlock avoided”) was improved.
In 20.6 all table-level locks which were possible to remove were removed, so alters are totally lock-free.
20.10 enables database=Atomic by default which allows running even DROP commands without locks.
Typically issue was happening when doing some concurrent select on system.parts / system.columns / system.table with simultaneous table manipulations (doing some kind of ALTERS / TRUNCATES / DROP)I
If that exception happens often in your use-case:
use recent clickhouse versions
ensure you use Atomic engine for the database (not Ordinary) (can be checked in system.databases)
Sometime you can try to workaround issue by finding the queries which uses that table concurently (especially to system.tables / system.parts and other system tables) and try killing them (or avoiding them).
The execution pipeline is embedded in the partition reading code.
So that works this way:
ClickHouse® does partition pruning based on WHERE conditions.
For every partition, it picks a columns ranges (aka ‘marks’ / ‘granulas’) based on primary key conditions.
Here the sampling logic is applied: a) in case of SAMPLE k (k in 0..1 range) it adds conditions WHERE sample_key < k * max_int_of_sample_key_type b) in case of SAMPLE k OFFSET m it adds conditions WHERE sample_key BETWEEN m * max_int_of_sample_key_type AND (m + k) * max_int_of_sample_key_typec) in case of SAMPLE N (N>1) if first estimates how many rows are inside the range we need to read and based on that convert it to 3a case (calculate k based on number of rows in ranges and desired number of rows)
on the data returned by those other conditions are applied (so here the number of rows can be decreased here)
Uniformly distributed in the domain of its data type:
Bad: Timestamp;
Good: intHash32(UserID);
Cheap to calculate:
Bad: cityHash64(URL);
Good: intHash32(UserID);
Not after high granular fields in primary key:
Bad: ORDER BY (Timestamp, sample_key);
Good: ORDER BY (CounterID, Date, sample_key).
Sampling is:
Deterministic
Works in a consistent way for different tables.
Allows reading less amount of data from disk.
SAMPLE key, bonus
SAMPLE 1/10
Select data for 1/10 of all possible sample keys; SAMPLE 1000000
Select from about (not less than) 1 000 000 rows on each shard;
You can use _sample_factor virtual column to determine the relative sample factor; SAMPLE 1/10 OFFSET 1/10
Select second 1/10 of all possible sample keys; SET max_parallel_replicas = 3
Select from multiple replicas of each shard in parallel;
SAMPLE emulation via WHERE condition
Sometimes, it’s easier to emulate sampling via conditions in WHERE clause instead of using SAMPLE key.
SELECT count() FROM table WHERE ... AND cityHash64(some_high_card_key) % 10 = 0; -- Deterministic
SELECT count() FROM table WHERE ... AND rand() % 10 = 0; -- Non-deterministic
ClickHouse will read more data from disk compared to an example with a good SAMPLE key, but it’s more universal and can be used if you can’t change table ORDER BY key. (To learn more about ClickHouse internals, Administrator Training for ClickHouse
is available.)
The following example demonstrates how sampling can be setup correctly, and an example if it being set up incorrectly as a comparison.
Sampling requires sample by expression . This ensures a range of sampled column types fit within a specified range, which ensures the requirement of low cardinality. In this example, I cannot use transaction_id because I can not ensure that the min value of transaction_id = 0 and max value = MAX_UINT64. Instead, I used cityHash64(transaction_id)to expand the range within the minimum and maximum values.
For example if all values of transaction_id are from 0 to 10000 sampling will be inefficient. But cityHash64(transaction_id) expands the range from 0 to 18446744073709551615:
If I used transaction_id without knowing that they matched the allowable ranges, the results of sampled queries would be skewed. For example, when using sample 0.5, ClickHouse requests where sample_col >= 0 and sample_col <= MAX_UINT64/2.
Also you can include multiple columns into a hash function of the sampling expression to improve randomness of the distribution cityHash64(transaction_id, banner_id).
I reduced the granularity of the timestamp column to one hour with toStartOfHour(toDateTime(timestamp)) , otherwise sampling will not work.
Verifying Sampling Works
The following shows that sampling works with the table and parameters described above. Notice the Elapsed time when invoking sampling:
-- Q1. No where filters.
-- The query is 10 times faster with SAMPLE 0.01
selectbanner_id,sum(value),count(value),max(value)fromtable_onegroupbybanner_idformatNull;0rowsinset.Elapsed:11.490sec.Processed10.00billionrows,60.00GB(870.30millionrows/s.,5.22GB/s.)selectbanner_id,sum(value),count(value),max(value)fromtable_oneSAMPLE0.01groupbybanner_idformatNull;0rowsinset.Elapsed:1.316sec.Processed452.67millionrows,6.34GB(343.85millionrows/s.,4.81GB/s.)-- Q2. Filter by the first column in index (banner_id = 42)
-- The query is 20 times faster with SAMPLE 0.01
-- reads 20 times less rows: 10.30 million rows VS Processed 696.32 thousand rows
selectbanner_id,sum(value),count(value),max(value)fromtable_oneWHEREbanner_id=42groupbybanner_idformatNull;0rowsinset.Elapsed:0.020sec.Processed10.30millionrows,61.78MB(514.37millionrows/s.,3.09GB/s.)selectbanner_id,sum(value),count(value),max(value)fromtable_oneSAMPLE0.01WHEREbanner_id=42groupbybanner_idformatNull;0rowsinset.Elapsed:0.008sec.Processed696.32thousandrows,9.75MB(92.49millionrows/s.,1.29GB/s.)-- Q3. No filters
-- The query is 10 times faster with SAMPLE 0.01
-- reads 20 times less rows.
selectbanner_id,toStartOfHour(toDateTime(timestamp))hr,sum(value),count(value),max(value)fromtable_onegroupbybanner_id,hrformatNull;0rowsinset.Elapsed:36.660sec.Processed10.00billionrows,140.00GB(272.77millionrows/s.,3.82GB/s.)selectbanner_id,toStartOfHour(toDateTime(timestamp))hr,sum(value),count(value),max(value)fromtable_oneSAMPLE0.01groupbybanner_id,hrformatNull;0rowsinset.Elapsed:3.741sec.Processed452.67millionrows,9.96GB(121.00millionrows/s.,2.66GB/s.)-- Q4. Filter by not indexed column
-- The query is 6 times faster with SAMPLE 0.01
-- reads 20 times less rows.
selectcount()fromtable_onewherevalue=666formatNull;1rowsinset.Elapsed:6.056sec.Processed10.00billionrows,40.00GB(1.65billionrows/s.,6.61GB/s.)selectcount()fromtable_oneSAMPLE0.01wherevalue=666formatNull;1rowsinset.Elapsed:1.214sec.Processed452.67millionrows,5.43GB(372.88millionrows/s.,4.47GB/s.)
This is the same as our other table, BUT granularity of timestamp column is not reduced.
Verifying Sampling Does Not Work
The following tests shows that sampling is not working because of the lack of timestamp granularity. The Elapsed time is longer when sampling is used.
-- Q1. No where filters.
-- The query is 2 times SLOWER!!! with SAMPLE 0.01
-- Because it needs to read excessive column with sampling data!
selectbanner_id,sum(value),count(value),max(value)fromtable_onegroupbybanner_idformatNull;0rowsinset.Elapsed:11.196sec.Processed10.00billionrows,60.00GB(893.15millionrows/s.,5.36GB/s.)selectbanner_id,sum(value),count(value),max(value)fromtable_oneSAMPLE0.01groupbybanner_idformatNull;0rowsinset.Elapsed:24.378sec.Processed10.00billionrows,140.00GB(410.21millionrows/s.,5.74GB/s.)-- Q2. Filter by the first column in index (banner_id = 42)
-- The query is SLOWER with SAMPLE 0.01
selectbanner_id,sum(value),count(value),max(value)fromtable_oneWHEREbanner_id=42groupbybanner_idformatNull;0rowsinset.Elapsed:0.022sec.Processed10.27millionrows,61.64MB(459.28millionrows/s.,2.76GB/s.)selectbanner_id,sum(value),count(value),max(value)fromtable_oneSAMPLE0.01WHEREbanner_id=42groupbybanner_idformatNull;0rowsinset.Elapsed:0.037sec.Processed10.27millionrows,143.82MB(275.16millionrows/s.,3.85GB/s.)-- Q3. No filters
-- The query is SLOWER with SAMPLE 0.01
selectbanner_id,toStartOfHour(toDateTime(timestamp))hr,sum(value),count(value),max(value)fromtable_onegroupbybanner_id,hrformatNull;0rowsinset.Elapsed:21.663sec.Processed10.00billionrows,140.00GB(461.62millionrows/s.,6.46GB/s.)selectbanner_id,toStartOfHour(toDateTime(timestamp))hr,sum(value),count(value),max(value)fromtable_oneSAMPLE0.01groupbybanner_id,hrformatNull;0rowsinset.Elapsed:26.697sec.Processed10.00billionrows,220.00GB(374.57millionrows/s.,8.24GB/s.)-- Q4. Filter by not indexed column
-- The query is SLOWER with SAMPLE 0.01
selectcount()fromtable_onewherevalue=666formatNull;0rowsinset.Elapsed:7.679sec.Processed10.00billionrows,40.00GB(1.30billionrows/s.,5.21GB/s.)selectcount()fromtable_oneSAMPLE0.01wherevalue=666formatNull;0rowsinset.Elapsed:21.668sec.Processed10.00billionrows,120.00GB(461.51millionrows/s.,5.54GB/s.)
2.38 - Simple aggregate functions & combinators
Simple aggregate functions & combinators
Q. What is SimpleAggregateFunction? Are there advantages to use it instead of AggregateFunction in AggregatingMergeTree?
The ClickHouse® SimpleAggregateFunction can be used for those aggregations when the function state is exactly the same as the resulting function value. Typical example is max function: it only requires storing the single value which is already maximum, and no extra steps needed to get the final value. In contrast avg need to store two numbers - sum & count, which should be divided to get the final value of aggregation (done by the -Merge step at the very end).
SimpleAggregateFunction
AggregateFunction
inserting
accepts the value of underlying type OR
a value of corresponding SimpleAggregateFunction type
CREATE TABLE saf_test ( x SimpleAggregateFunction(max, UInt64) ) ENGINE=AggregatingMergeTree ORDER BY tuple();
INSERT INTO saf_test VALUES (1); INSERT INTO saf_test SELECT max(number) FROM numbers(10); INSERT INTO saf_test SELECT maxSimpleState(number) FROM numbers(20);
ONLY accepts the state of same aggregate function calculated using -State
combinator
storing
Internally store just a value of underlying type
function-specific state
storage usage
typically is much better due to better compression/codecs
in very rare cases it can be more optimal than raw values
adaptive granularity doesn't work for large states
reading raw value per row
you can access it directly
you need to use finalizeAggregation function
using aggregated value
just
select max(x) from test;
you need to use -Merge combinator select maxMerge(x) from test;
memory usage
typically less memory needed (in some corner cases even 10 times)
typically uses more memory, as every state can be quite complex
Q. How maxSimpleState combinator result differs from plain max?
They produce the same result, but types differ (the first have SimpleAggregateFunction datatype). Both can be pushed to SimpleAggregateFunction or to the underlying type. So they are interchangeable.
Info
-SimpleState is useful for implicit Materialized View creation, like
CREATE MATERIALIZED VIEW mv ENGINE = AggregatingMergeTree ORDER BY date AS SELECT date, sumSimpleState(1) AS cnt, sumSimpleState(revenue) AS rev FROM table GROUP BY date
Q. Can I use -If combinator with SimpleAggregateFunction?
Something like SimpleAggregateFunction(maxIf, UInt64, UInt8) is NOT possible. But is 100% ok to push maxIf (or maxSimpleStateIf) into SimpleAggregateFunction(max, UInt64)
There is one problem with that approach:
-SimpleStateIf Would produce 0 as result in case of no-match, and it can mess up some aggregate functions state. It wouldn’t affect functions like max/argMax/sum, but could affect functions like min/argMin/any/anyLast
Set result to some big number in case of no-match, which would be bigger than any possible value, so it would be safe to use. But it would work only for min/argMin
WITHminIfState(number,number>5)ASstate_1,minSimpleStateIf(number,number>5)ASstate_2SELECTbyteSize(state_1),toTypeName(state_1),byteSize(state_2),toTypeName(state_2)FROMnumbers(10)FORMATVertical-- For UInt64
Row1:──────byteSize(state_1):24toTypeName(state_1):AggregateFunction(minIf,UInt64,UInt8)byteSize(state_2):8toTypeName(state_2):SimpleAggregateFunction(min,UInt64)-- For UInt32
──────byteSize(state_1):16byteSize(state_2):4-- For UInt16
──────byteSize(state_1):12byteSize(state_2):2-- For UInt8
──────byteSize(state_1):10byteSize(state_2):1
ClickHouse® provides a type of index that in specific circumstances can significantly improve query speed. These structures are labeled “skip” indexes because they enable ClickHouse to skip reading significant chunks of data that are guaranteed to have no matching values.
2.39.1 - Example: minmax
Example: minmax
Use cases
Strong correlation between column from table ORDER BY / PARTITION BY key and other column which is regularly being used in WHERE condition
Good example is incremental ID which increasing with time.
Multiple Date/DateTime columns can be used in WHERE conditions
Usually it could happen if you have separate Date and DateTime columns and different column being used in PARTITION BY expression and in WHERE condition. Another possible scenario when you have multiple DateTime columns which have pretty the same date or even time.
As you can see ClickHouse read 110.00 million rows and the query elapsed Elapsed: 0.505 sec.
Let’s add an index
altertablebftestaddindexix1(x)TYPEbloom_filterGRANULARITY3;-- GRANULARITY 3 means how many table granules will be in the one index granule
-- In our case 1 granule of skip index allows to check and skip 3*8192 rows.
-- Every dataset is unique sometimes GRANULARITY 1 is better, sometimes
-- GRANULARITY 10.
-- Need to test on the real data.
optimizetablebftestfinal;-- I need to optimize my table because an index is created for only
-- new parts (inserted or merged)
-- optimize table final re-writes all parts, but with an index.
-- probably in your production you don't need to optimize
-- because your data is rotated frequently.
-- optimize is a heavy operation, better never run optimize table final in a
-- production.
createtablebftest(kInt64,xInt64)Engine=MergeTreeorderbyk;-- data is in x column is correlated with the primary key
insertintobftestselectnumber,number*2fromnumbers(100000000);altertablebftestaddindexix1(x)TYPEminmaxGRANULARITY1;altertablebftestmaterializeindexix1;selectcount()frombftestwherex=42;1rowsinset.Elapsed:0.004sec.Processed8.19thousandrows
projection
createtablebftest(kInt64,xInt64,SString)Engine=MergeTreeorderbyk;insertintobftestselectnumber,rand64()%565656,''fromnumbers(10000000);insertintobftestselectnumber,rand64()%565656,''fromnumbers(100000000);altertablebftestaddprojectionp1(selectk,xorderbyx);altertablebftestmaterializeprojectionp1settingsmutations_sync=1;setallow_experimental_projection_optimization=1;-- projection
selectcount()frombftestwherex=42;1rowsinset.Elapsed:0.002sec.Processed24.58thousandrows-- no projection
select*frombftestwherex=42formatNull;0rowsinset.Elapsed:0.432sec.Processed110.00millionrows-- projection
select*frombftestwherekin(selectkfrombftestwherex=42)formatNull;0rowsinset.Elapsed:0.316sec.Processed1.50millionrows
2.40 - Time zones
Time zones
Important things to know:
DateTime inside ClickHouse® is actually UNIX timestamp always, i.e. number of seconds since 1970-01-01 00:00:00 GMT.
Conversion from that UNIX timestamp to a human-readable form and reverse can happen on the client (for native clients) and on the server (for HTTP clients, and for some type of queries, like toString(ts))
Depending on the place where that conversion happened rules of different timezones may be applied.
You can check server timezone using SELECT timezone()
clickhouse-client
also by default tries to use server timezone (see also --use_client_time_zone flag)
If you want you can store the timezone name inside the data type, in that case, timestamp <-> human-readable time rules of that timezone will be applied.
ClickHouse uses system timezone info from tzdata package if it exists, and uses own builtin tzdata if it is missing in the system.
cd /usr/share/zoneinfo/Canada
ln -s ../America/Halifax A
TZ=Canada/A clickhouse-local -q 'select timezone()'
Canada/A
When the conversion using different rules happen
SELECTtimezone()┌─timezone()─┐│UTC│└────────────┘createtablet_with_dt_utc(tsDateTime64(3,'Europe/Moscow'))engine=Log;createtablex(tsString)engine=Null;creatematerializedviewx_mvtot_with_dt_utcasselectparseDateTime64BestEffort(ts)astsfromx;$echo'2021-07-15T05:04:23.733'|clickhouse-client-q'insert into t_with_dt_utc format CSV'-- here client checks the type of the columns, see that it's 'Europe/Moscow' and use conversion according to moscow rules
$echo'2021-07-15T05:04:23.733'|clickhouse-client-q'insert into x format CSV'-- here client check tha type of the columns (it is string), and pass string value to the server.
-- parseDateTime64BestEffort(ts) uses server default timezone (UTC in my case), and convert the value using UTC rules.
-- and the result is 2 different timestamps (when i selecting from that is shows both in 'desired' timezone, forced by column type, i.e. Moscow):
SELECT*FROMt_with_dt_utc┌──────────────────────ts─┐│2021-07-1505:04:23.733││2021-07-1508:04:23.733│└─────────────────────────┘
Best practice here: use UTC timezone everywhere, OR use the same default timezone for ClickHouse server as used by your data
2.41 - Time-series alignment with interpolation
Time-series alignment with interpolation
This article demonstrates how to perform time-series data alignment with interpolation using window functions in ClickHouse. The goal is to align two different time-series (A and B) on the same timestamp axis and fill the missing values using linear interpolation.
Step-by-Step Implementation
We begin by creating a table with test data that simulates two time-series (A and B) with randomly distributed timestamps and values. Then, we apply interpolation to fill missing values for each time-series based on the surrounding data points.
1. Drop Existing Table (if it exists)
DROPTABLEtest_ts_interpolation;
This ensures that any previous versions of the table are removed.
2. Generate Test Data
In this step, we generate random time-series data with timestamps and values for series A and B. The values are calculated differently for each series:
CREATETABLEtest_ts_interpolationENGINE=LogASSELECT((number*100)+50)-(rand()%100)AStimestamp,-- random timestamp generation
transform(rand()%2,[0,1],['A','B'],'')ASts,-- randomly assign series 'A' or 'B'
if(ts='A',timestamp*10,timestamp*100)ASvalue-- different value generation for each series
FROMnumbers(1000000);
Here, the timestamp is generated randomly and assigned to either series A or B using the transform() function. The value is calculated based on the series type (A or B), with different multipliers for each.
3. Preview the Generated Data
After generating the data, you can inspect it by running a simple SELECT query:
SELECT*FROMtest_ts_interpolation;
This will show the randomly generated timestamps, series (A or B), and their corresponding values.
4. Perform Interpolation with Window Functions
To align the time-series and interpolate missing values, we use window functions in the following query:
SELECTtimestamp,if(ts='A',toFloat64(value),-- If the current series is 'A', keep the original value
prev_a.2+(timestamp-prev_a.1)*(next_a.2-prev_a.2)/(next_a.1-prev_a.1)-- Interpolate for 'A'
)asa_value,if(ts='B',toFloat64(value),-- If the current series is 'B', keep the original value
prev_b.2+(timestamp-prev_b.1)*(next_b.2-prev_b.2)/(next_b.1-prev_b.1)-- Interpolate for 'B'
)asb_valueFROM(SELECTtimestamp,ts,value,-- Find the previous and next values for series 'A'
anyLastIf((timestamp,value),ts='A')OVER(ORDERBYtimestampROWSBETWEENUNBOUNDEDPRECEDINGAND1PRECEDING)ASprev_a,anyLastIf((timestamp,value),ts='A')OVER(ORDERBYtimestampDESCROWSBETWEENUNBOUNDEDPRECEDINGAND1PRECEDING)ASnext_a,-- Find the previous and next values for series 'B'
anyLastIf((timestamp,value),ts='B')OVER(ORDERBYtimestampROWSBETWEENUNBOUNDEDPRECEDINGAND1PRECEDING)ASprev_b,anyLastIf((timestamp,value),ts='B')OVER(ORDERBYtimestampDESCROWSBETWEENUNBOUNDEDPRECEDINGAND1PRECEDING)ASnext_bFROMtest_ts_interpolation)
Explanation:
Timestamp Alignment:
We align the timestamps of both series (A and B) and handle missing data points.
Interpolation Logic:
For each A-series timestamp, if the current series is not A, we calculate the interpolated value using the linear interpolation formula:
Similarly, for the B series, interpolation is calculated between the previous (prev_b) and next (next_b) known values.
Window Functions:
anyLastIf() is used to fetch the previous or next values for series A and B based on the timestamps.
We use window functions to efficiently calculate these values over the ordered sequence of timestamps.
By using window functions and interpolation, we can align time-series data with irregular timestamps and fill in missing values based on nearby data points. This technique is useful in scenarios where data is recorded at different times or irregular intervals across multiple series.
2.42 - Top N & Remain
Top N & Remain
When working with large datasets, you may often need to compute the sum of values for the top N groups and aggregate the remainder separately. This article demonstrates several methods to achieve that in ClickHouse.
Dataset Setup
We’ll start by creating a table top_with_rest and inserting data for demonstration purposes:
This method uses ROW_NUMBER() to segregate the top N from the rest.
Method 5: Using WITH TOTALS
This method includes totals for all groups, and you calculate the remainder on the application side.
SELECT
k,
sum(number) AS res
FROM top_with_rest
GROUP BY k
WITH TOTALS
ORDER BY res DESC
LIMIT 10
┌─k───┬───res─┐
│ 999 │ 99945 │
│ 998 │ 99845 │
│ 997 │ 99745 │
│ 996 │ 99645 │
│ 995 │ 99545 │
│ 994 │ 99445 │
│ 993 │ 99345 │
│ 992 │ 99245 │
│ 991 │ 99145 │
│ 990 │ 99045 │
└─────┴───────┘
Totals:
┌─k─┬──────res─┐
│ │ 49995000 │
└───┴──────────┘
You would subtract the sum of the top rows from the totals in your application.
These methods offer different approaches for handling the Top N rows and aggregating the remainder in ClickHouse. Depending on your requirements—whether you prefer using UNION ALL, arrays, window functions, or totals—each method provides flexibility for efficient querying.
2.43 - Troubleshooting
Tips for ClickHouse® troubleshooting
Query Execution Logging
When troubleshooting query execution in ClickHouse®, one of the most useful tools is logging the query execution details. This can be controlled using the session-level setting send_logs_level. Here are the different log levels you can use:
Possible values: 'trace', 'debug', 'information', 'warning', 'error', 'fatal', 'none'
This can be used with clickhouse-client
in both interactive and non-interactive mode.
The logs provide detailed information about query execution, making it easier to identify issues or bottlenecks. You can use the following command to run a query with logging enabled:
ClickHouse supports exporting query performance data in a format compatible with speedscope.app. This can help you visualize performance bottlenecks within queries. Example query to generate a flamegraph:
https://www.speedscope.app/
WITH'95578e1c-1e93-463c-916c-a1a8cdd08198'ASquery,min(min)ASstart_value,max(max)ASend_value,groupUniqArrayArrayArray(trace_arr)ASuniq_frames,arrayMap((x,a,b)->('sampled',b,'none',start_value,end_value,arrayMap(s->reverse(arrayMap(y->toUInt32(indexOf(uniq_frames,y)-1),s)),x),a),groupArray(trace_arr),groupArray(weights),groupArray(trace_type))ASsamplesSELECTconcat('clickhouse-server@',version())ASexporter,'https://www.speedscope.app/file-format-schema.json'AS`$schema`,concat('ClickHouse query id: ',query)ASname,CAST(samples,'Array(Tuple(type String, name String, unit String, startValue UInt64, endValue UInt64, samples Array(Array(UInt32)), weights Array(UInt32)))')ASprofiles,CAST(tuple(arrayMap(x->(demangle(addressToSymbol(x)),addressToLine(x)),uniq_frames)),'Tuple(frames Array(Tuple(name String, line String)))')ASsharedFROM(SELECTmin(min_ns)ASmin,trace_type,max(max_ns)ASmax,groupArray(trace)AStrace_arr,groupArray(cnt)ASweightsFROM(SELECTmin(timestamp_ns)ASmin_ns,max(timestamp_ns)ASmax_ns,trace,trace_type,count()AScntFROMsystem.trace_logWHEREquery_id=queryGROUPBYtrace_type,trace)GROUPBYtrace_type)SETTINGSallow_introspection_functions=1,output_format_json_named_tuples_as_objects=1FORMATJSONEachRow
And query to generate traces per thread
WITH'8e7e0616-cfaf-43af-a139-d938ced7655a'ASquery,min(min)ASstart_value,max(max)ASend_value,groupUniqArrayArrayArray(trace_arr)ASuniq_frames,arrayMap((x,a,b,c,d)->('sampled',concat(b,' - thread ',c.1,' - traces ',c.2),'nanoseconds',d.1-start_value,d.2-start_value,arrayMap(s->reverse(arrayMap(y->toUInt32(indexOf(uniq_frames,y)-1),s)),x),a),groupArray(trace_arr),groupArray(weights),groupArray(trace_type),groupArray((thread_id,total)),groupArray((min,max)))ASsamplesSELECTconcat('clickhouse-server@',version())ASexporter,'https://www.speedscope.app/file-format-schema.json'AS`$schema`,concat('ClickHouse query id: ',query)ASname,CAST(samples,'Array(Tuple(type String, name String, unit String, startValue UInt64, endValue UInt64, samples Array(Array(UInt32)), weights Array(UInt32)))')ASprofiles,CAST(tuple(arrayMap(x->(demangle(addressToSymbol(x)),addressToLine(x)),uniq_frames)),'Tuple(frames Array(Tuple(name String, line String)))')ASsharedFROM(SELECTmin(min_ns)ASmin,trace_type,thread_id,max(max_ns)ASmax,groupArray(trace)AStrace_arr,groupArray(cnt)ASweights,sum(cnt)astotalFROM(SELECTmin(timestamp_ns)ASmin_ns,max(timestamp_ns)ASmax_ns,trace,trace_type,thread_id,sum(if(trace_typeIN('Memory','MemoryPeak','MemorySample'),size,1))AScntFROMsystem.trace_logWHEREquery_id=queryGROUPBYtrace_type,trace,thread_id)GROUPBYtrace_type,thread_idORDERBYtrace_typeASC,totalDESC)SETTINGSallow_introspection_functions=1,output_format_json_named_tuples_as_objects=1,output_format_json_quote_64bit_integers=1FORMATJSONEachRow
By enabling detailed logging and tracing, you can effectively diagnose issues and optimize query performance in ClickHouse.
Update table metadata: schema .sql & metadata in ZK.
It’s usually cheap and fast command. And any new INSERT after schema change will calculate TTL according to new rule.
ALTER TABLE tbl MATERIALIZE TTL
Recalculate TTL for already exist parts.
It can be heavy operation, because ClickHouse® will read column data & recalculate TTL & apply TTL expression.
You can disable this step completely by using materialize_ttl_after_modify user session setting (by default it’s 1, so materialization is enabled).
If you will disable materialization of TTL, it does mean that all old parts will be transformed according OLD TTL rules.
MATERIALIZE TTL:
Recalculate TTL (Kinda cheap, it read only column participate in TTL)
Apply TTL (Rewrite of table data for all columns)
You also can only disable apply TTL substep via materialize_ttl_recalculate_only merge_tree setting (by default it’s 0, so clickhouse will apply TTL expression)
The idea of materialize_ttl_after_modify = 0 and materialize_ttl_recalculate_only = 1 is to use ALTER TABLE tbl MATERIALIZE TTL IN PARTITION xxx; ALTER TABLE tbl MATERIALIZE TTL IN PARTITION yyy; and materialize TTL gently or drop/move partitions manually until the old data without/old TTL is processed.
MATERIALIZE TTL done via Mutation:
ClickHouse create new parts via hardlinks and write new ttl.txt file
ClickHouse remove old(inactive) parts after remove time (default is 8 minutes)
20220401 ttl: 20220601 disk: s3
20220416 ttl: 20220616 disk: s3
20220501 ttl: 20220631 disk: s3 (ClickHouse will not move this part to local disk, because there is no TTL rule for that)
20220502 ttl: 20220701 disk: local
20220516 ttl: 20220716 disk: local
20220601 ttl: 20220731 disk: local
Decrease of TTL
TTL timestamp + INTERVAL 30 DAY MOVE TO DISK s3 -> TTL timestamp + INTERVAL 14 DAY MOVE TO DISK s3
Table parts:
20220401 ttl: 20220401 disk: s3
20220416 ttl: 20220516 disk: s3
20220501 ttl: 20220531 disk: s3
20220502 ttl: 20220601 disk: local
20220516 ttl: 20220616 disk: local
20220601 ttl: 20220631 disk: local
20220401 ttl: 20220415 disk: s3
20220416 ttl: 20220501 disk: s3
20220501 ttl: 20220515 disk: s3
20220502 ttl: 20220517 disk: local (ClickHouse will move this part to disk s3 in background according to TTL rule)
20220516 ttl: 20220601 disk: local (ClickHouse will move this part to disk s3 in background according to TTL rule)
20220601 ttl: 20220616 disk: local
Possible TTL Rules
TTL:
DELETE (With enabled `ttl_only_drop_parts`, it's cheap operation, ClickHouse will drop the whole part)
MOVE
GROUP BY
WHERE
RECOMPRESS
merge_with_ttl_timeout │ 14400 │ 0 │ Minimal time in seconds, when merge with delete TTL can be repeated.
merge_with_recompression_ttl_timeout │ 14400 │ 0 │ Minimal time in seconds, when merge with recompression TTL can be repeated.
max_replicated_merges_with_ttl_in_queue │ 1 │ 0 │ How many tasks of merging parts with TTL are allowed simultaneously in ReplicatedMergeTree queue.
max_number_of_merges_with_ttl_in_pool │ 2 │ 0 │ When there is more than specified number of merges with TTL entries in pool, do not assign new merge with TTL. This is to leave free threads for regular merges and avoid "Too many parts"
ttl_only_drop_parts │ 0 │ 0 │ Only drop altogether the expired parts and not partially prune them.
Session settings:
materialize_ttl_after_modify │ 1 │ 0 │ Apply TTL for old data, after ALTER MODIFY TTL query
2.44.2 - What are my TTL settings?
What are my TTL settings?
Using SHOW CREATE TABLE
If you just want to see the current TTL settings on a table, you can look at the schema definition.
SHOW CREATE TABLE events2_local
FORMAT Vertical
Query id: eba671e5-6b8c-4a81-a4d8-3e21e39fb76b
Row 1:
──────
statement: CREATE TABLE default.events2_local
(
`EventDate` DateTime,
`EventID` UInt32,
`Value` String
)
ENGINE = ReplicatedMergeTree('/clickhouse/{cluster}/tables/{shard}/default/events2_local', '{replica}')
PARTITION BY toYYYYMM(EventDate)
ORDER BY (EventID, EventDate)
TTL EventDate + toIntervalMonth(1)
SETTINGS index_granularity = 8192
This works even when there’s no data in the table. It does not tell you when the TTLs expire or anything specific to data in one or more of the table parts.
Using system.parts
If you want to see the actually TTL values for specific data, run a query on system.parts.
There are columns listing all currently applicable TTL limits for each part.
(It does not work if the table is empty because there aren’t any parts yet.)
During TTL merges ClickHouse® re-calculates values of columns in the SET section.
GROUP BY section should be a prefix of a table’s PRIMARY KEY (the same as ORDER BY, if no separate PRIMARY KEY defined).
-- stop merges to demonstrate data before / after
-- a rolling up
SYSTEMSTOPTTLMERGEStest_ttl_group_by;SYSTEMSTOPMERGEStest_ttl_group_by;INSERTINTOtest_ttl_group_by(key,ts,value)SELECTnumber%5,now()+number,1FROMnumbers(100);INSERTINTOtest_ttl_group_by(key,ts,value)SELECTnumber%5,now()-interval60day+number,2FROMnumbers(100);SELECTtoYYYYMM(ts)ASm,count(),sum(value),min(min_value),max(max_value)FROMtest_ttl_group_byGROUPBYm;┌──────m─┬─count()─┬─sum(value)─┬─min(min_value)─┬─max(max_value)─┐│202102│100│200│2│2││202104│100│100│1│1│└────────┴─────────┴────────────┴────────────────┴────────────────┘SYSTEMSTARTTTLMERGEStest_ttl_group_by;SYSTEMSTARTMERGEStest_ttl_group_by;OPTIMIZETABLEtest_ttl_group_byFINAL;SELECTtoYYYYMM(ts)ASm,count(),sum(value),min(min_value),max(max_value)FROMtest_ttl_group_byGROUPBYm;┌──────m─┬─count()─┬─sum(value)─┬─min(min_value)─┬─max(max_value)─┐│202102│5│200│2│2││202104│100│100│1│1│└────────┴─────────┴────────────┴────────────────┴────────────────┘
As you can see 100 rows were rolled up into 5 rows (key has 5 values) for rows older than 30 days.
Example with SummingMergeTree table
CREATETABLEtest_ttl_group_by(`key1`UInt32,`key2`UInt32,`ts`DateTime,`value`UInt32,`min_value`SimpleAggregateFunction(min,UInt32)DEFAULTvalue,`max_value`SimpleAggregateFunction(max,UInt32)DEFAULTvalue)ENGINE=SummingMergeTreePARTITIONBYtoYYYYMM(ts)PRIMARYKEY(key1,key2,toStartOfDay(ts))ORDERBY(key1,key2,toStartOfDay(ts),ts)TTLts+interval30dayGROUPBYkey1,key2,toStartOfDay(ts)SETvalue=sum(value),min_value=min(min_value),max_value=max(max_value),ts=min(toStartOfDay(ts));-- stop merges to demonstrate data before / after
-- a rolling up
SYSTEMSTOPTTLMERGEStest_ttl_group_by;SYSTEMSTOPMERGEStest_ttl_group_by;INSERTINTOtest_ttl_group_by(key1,key2,ts,value)SELECT1,1,toStartOfMinute(now()+number*60),1FROMnumbers(100);INSERTINTOtest_ttl_group_by(key1,key2,ts,value)SELECT1,1,toStartOfMinute(now()+number*60),1FROMnumbers(100);INSERTINTOtest_ttl_group_by(key1,key2,ts,value)SELECT1,1,toStartOfMinute(now()+number*60-toIntervalDay(60)),2FROMnumbers(100);INSERTINTOtest_ttl_group_by(key1,key2,ts,value)SELECT1,1,toStartOfMinute(now()+number*60-toIntervalDay(60)),2FROMnumbers(100);SELECTtoYYYYMM(ts)ASm,count(),sum(value),min(min_value),max(max_value)FROMtest_ttl_group_byGROUPBYm;┌──────m─┬─count()─┬─sum(value)─┬─min(min_value)─┬─max(max_value)─┐│202102│200│400│2│2││202104│200│200│1│1│└────────┴─────────┴────────────┴────────────────┴────────────────┘SYSTEMSTARTTTLMERGEStest_ttl_group_by;SYSTEMSTARTMERGEStest_ttl_group_by;OPTIMIZETABLEtest_ttl_group_byFINAL;SELECTtoYYYYMM(ts)ASm,count(),sum(value),min(min_value),max(max_value)FROMtest_ttl_group_byGROUPBYm;┌──────m─┬─count()─┬─sum(value)─┬─min(min_value)─┬─max(max_value)─┐│202102│1│400│2│2││202104│100│200│1│1│└────────┴─────────┴────────────┴────────────────┴────────────────┘
During merges ClickHouse re-calculates ts columns as min(toStartOfDay(ts)). It’s possible only for the last column of SummingMergeTreeORDER BY section ORDER BY (key1, key2, toStartOfDay(ts), ts) otherwise it will break the order of rows in the table.
Example with AggregatingMergeTree table
CREATETABLEtest_ttl_group_by_agg(`key1`UInt32,`key2`UInt32,`ts`DateTime,`counter`AggregateFunction(count,UInt32))ENGINE=AggregatingMergeTreePARTITIONBYtoYYYYMM(ts)PRIMARYKEY(key1,key2,toStartOfDay(ts))ORDERBY(key1,key2,toStartOfDay(ts),ts)TTLts+interval30dayGROUPBYkey1,key2,toStartOfDay(ts)SETcounter=countMergeState(counter),ts=min(toStartOfDay(ts));CREATETABLEtest_ttl_group_by_raw(`key1`UInt32,`key2`UInt32,`ts`DateTime)ENGINE=Null;CREATEMATERIALIZEDVIEWtest_ttl_group_by_mvTOtest_ttl_group_by_aggASSELECT`key1`,`key2`,`ts`,countState()ascounterFROMtest_ttl_group_by_rawGROUPBYkey1,key2,ts;-- stop merges to demonstrate data before / after
-- a rolling up
SYSTEMSTOPTTLMERGEStest_ttl_group_by_agg;SYSTEMSTOPMERGEStest_ttl_group_by_agg;INSERTINTOtest_ttl_group_by_raw(key1,key2,ts)SELECT1,1,toStartOfMinute(now()+number*60)FROMnumbers(100);INSERTINTOtest_ttl_group_by_raw(key1,key2,ts)SELECT1,1,toStartOfMinute(now()+number*60)FROMnumbers(100);INSERTINTOtest_ttl_group_by_raw(key1,key2,ts)SELECT1,1,toStartOfMinute(now()+number*60-toIntervalDay(60))FROMnumbers(100);INSERTINTOtest_ttl_group_by_raw(key1,key2,ts)SELECT1,1,toStartOfMinute(now()+number*60-toIntervalDay(60))FROMnumbers(100);SELECTtoYYYYMM(ts)ASm,count(),countMerge(counter)FROMtest_ttl_group_by_aggGROUPBYm;┌──────m─┬─count()─┬─countMerge(counter)─┐│202307│200│200││202309│200│200│└────────┴─────────┴─────────────────────┘SYSTEMSTARTTTLMERGEStest_ttl_group_by_agg;SYSTEMSTARTMERGEStest_ttl_group_by_agg;OPTIMIZETABLEtest_ttl_group_by_aggFINAL;SELECTtoYYYYMM(ts)ASm,count(),countMerge(counter)FROMtest_ttl_group_by_aggGROUPBYm;┌──────m─┬─count()─┬─countMerge(counter)─┐│202307│1│200││202309│100│200│└────────┴─────────┴─────────────────────┘
CREATETABLEtest_ttl_group_by(`key`UInt32,`ts`DateTime,`value`UInt32,`min_value`UInt32DEFAULTvalue,`max_value`UInt32DEFAULTvalue)ENGINE=MergeTreePARTITIONBYtoYYYYMM(ts)ORDERBY(key,toStartOfDay(ts))TTLts+interval180day,ts+interval30dayGROUPBYkey,toStartOfDay(ts)SETvalue=sum(value),min_value=min(min_value),max_value=max(max_value),ts=min(toStartOfDay(ts));-- stop merges to demonstrate data before / after
-- a rolling up
SYSTEMSTOPTTLMERGEStest_ttl_group_by;SYSTEMSTOPMERGEStest_ttl_group_by;INSERTINTOtest_ttl_group_by(key,ts,value)SELECTnumber%5,now()+number,1FROMnumbers(100);INSERTINTOtest_ttl_group_by(key,ts,value)SELECTnumber%5,now()-interval60day+number,2FROMnumbers(100);INSERTINTOtest_ttl_group_by(key,ts,value)SELECTnumber%5,now()-interval200day+number,3FROMnumbers(100);SELECTtoYYYYMM(ts)ASm,count(),sum(value),min(min_value),max(max_value)FROMtest_ttl_group_byGROUPBYm;┌──────m─┬─count()─┬─sum(value)─┬─min(min_value)─┬─max(max_value)─┐│202101│100│300│3│3││202106│100│200│2│2││202108│100│100│1│1│└────────┴─────────┴────────────┴────────────────┴────────────────┘SYSTEMSTARTTTLMERGEStest_ttl_group_by;SYSTEMSTARTMERGEStest_ttl_group_by;OPTIMIZETABLEtest_ttl_group_byFINAL;┌──────m─┬─count()─┬─sum(value)─┬─min(min_value)─┬─max(max_value)─┐│202106│5│200│2│2││202108│100│100│1│1│└────────┴─────────┴────────────┴────────────────┴────────────────┘
All columns have implicit default compression from server config, except event_time, that’s why need to change to compression to Default for this column otherwise it won’t be recompressed.
In case of Replicated installation, Dictionary should be created on all nodes and source tables should use the ReplicatedMergeTree
engine and be replicated across all nodes.
Info
Starting
from 20.4, ClickHouse® forbid by default any potential non-deterministic mutations.
This behavior controlled by setting allow_nondeterministic_mutations. You can append it to query like this ALTER TABLE xxx UPDATE ... WHERE ... SETTINGS allow_nondeterministic_mutations = 1;
For ON CLUSTER queries, you would need to put this setting in default profile and restart ClickHouse servers.
2.46 - Values mapping
Values mapping
SELECTcount()FROMnumbers_mt(1000000000)WHERENOTignore(transform(number%3,[0,1,2,3],['aa','ab','ad','af'],'a0'))1rowsinset.Elapsed:4.668sec.Processed1.00billionrows,8.00GB(214.21millionrows/s.,1.71GB/s.)SELECTcount()FROMnumbers_mt(1000000000)WHERENOTignore(multiIf((number%3)=0,'aa',(number%3)=1,'ab',(number%3)=2,'ad',(number%3)=3,'af','a0'))1rowsinset.Elapsed:7.333sec.Processed1.00billionrows,8.00GB(136.37millionrows/s.,1.09GB/s.)SELECTcount()FROMnumbers_mt(1000000000)WHERENOTignore(CAST(number%3ASEnum('aa'=0,'ab'=1,'ad'=2,'af'=3)'))
1 rows in set. Elapsed: 1.152 sec. Processed 1.00 billion rows, 8.00 GB (867.79 million rows/s., 6.94 GB/s.)
3.1 - How to encode/decode quantileTDigest states from/to list of centroids
A way to export or import quantileTDigest states from/into ClickHouse®
quantileTDigestState
quantileTDigestState is stored in two parts: a count of centroids in LEB128 format + list of centroids without a delimiter. Each centroid is represented as two Float32 values: Mean & Count.
3.5 - arrayMap, arrayJoin or ARRAY JOIN memory usage
Why do arrayMap, arrayFilter, and arrayJoin use so much memory?
arrayMap-like functions memory usage calculation.
In order to calculate arrayMap or similar array* functions ClickHouse® temporarily does arrayJoin-like operation, which in certain conditions can lead to huge memory usage for big arrays.
We can roughly estimate memory usage by multiplying the size of columns participating in the lambda function by the size of the unnested array.
And total memory usage will be 55 values (5(array size)*2(array count)*5(row count) + 5(unnested array size)), which is 5.5 times more than initial array size.
WITHCAST(NULL,'Nullable(UInt8)')AScolumnSELECTcolumn,assumeNotNull(column+999)ASx;┌─column─┬─x─┐│null│0│└────────┴───┘WITHCAST(NULL,'Nullable(UInt8)')AScolumnSELECTcolumn,assumeNotNull(materialize(column)+999)ASx;┌─column─┬───x─┐│null│999│└────────┴─────┘CREATETABLEtest_null(`key`UInt32,`value`Nullable(String))ENGINE=MergeTreeORDERBYkey;INSERTINTOtest_nullSELECTnumber,concat('value ',toString(number))FROMnumbers(4);SELECT*FROMtest_null;┌─key─┬─value───┐│0│value0││1│value1││2│value2││3│value3│└─────┴─────────┘ALTERTABLEtest_nullUPDATEvalue=NULLWHEREkey=3;SELECT*FROMtest_null;┌─key─┬─value───┐│0│value0││1│value1││2│value2││3│null│└─────┴─────────┘SELECTkey,assumeNotNull(value)FROMtest_null;┌─key─┬─assumeNotNull(value)─┐│0│value0││1│value1││2│value2││3│value3│└─────┴──────────────────────┘WITHCAST(NULL,'Nullable(Enum8(\'a\' = 1, \'b\' = 0))')AStestSELECTassumeNotNull(test)┌─assumeNotNull(test)─┐│b│└─────────────────────┘WITHCAST(NULL,'Nullable(Enum8(\'a\' = 1))')AStestSELECTassumeNotNull(test)Erroronprocessingquery'with CAST(null, 'Nullable(Enum8(\'a\'=1))') as test
select assumeNotNull(test); ;':Code:36,e.displayText()=DB::Exception:Unexpectedvalue0inenum,Stacktrace(whencopyingthismessage,alwaysincludethelinesbelow):
Info
Null values in ClickHouse® are stored in a separate dictionary: is this value Null. And for faster dispatch of functions there is no check on Null value while function execution, so functions like plus can modify internal column value (which has default value). In normal conditions it’s not a problem because on read attempt, ClickHouse first would check the Null dictionary and return value from column itself for non-Nulls only. And assumeNotNull function just ignores this Null dictionary. So it would return only column values, and in certain cases it’s possible to have unexpected results.
If it’s possible to have Null values, it’s better to use ifNull function instead.
Because encryption and decryption can be expensive due re-initialization of keys and iv, usually it make sense to use those functions over literal values instead of table column.
3.8 - sequenceMatch
sequenceMatch
Question
I expect the sequence here to only match once as a is only directly after a once - but it matches with gaps. Why is that?
Learn how you can integrate cloud services, BI tools, kafka, MySQL, Spark, MindsDB, and more with ClickHouse®
4.1 - Altinity Cloud Access Management
Enabling access_management for Altinity.Cloud databases.
Organizations that want to enable administrative users in their Altinity.Cloud ClickHouse® servers can do so by enabling access_management manually. This allows for administrative users to be created on the specific ClickHouse Cluster.
WARNING
Modifying the ClickHouse cluster settings manually can lead to the cluster not loading or other issues. Change settings only with full consultation with an Altinity.Cloud support team member, and be ready to remove settings if they cause any disruption of service.
To add the access_management setting to an Altinity.Cloud ClickHouse Cluster:
Log into your Altinity.Cloud account.
For the cluster to modify, select Configure -> Settings.
Cluster setting configure
From the Settings page, select +ADD SETTING.
Add cluster setting
Set the following options:
Setting Type: Select users.d file.
Filename: access_management.xml
Contents: Enter the following to allow the clickhouse_operator that controls the cluster through the clickhouse-operator the ability to set administrative options:
access_management=1 means that users admin, clickhouse_operator are able to create users and grant them privileges using SQL.
Select OK. The cluster will restart, and users can now be created in the cluster that can be granted administrative access.
If you are running ClickHouse 21.9 and above you can enable storing access management in ZooKeeper. in this case it will be automatically propagated to the cluster. This requires yet another configuration file:
The clickhouse-driver is a Python library used for interacting with ClickHouse. Here’s a summary of its features:
Connectivity: clickhouse-driver allows Python applications to connect to ClickHouse servers over TCP/IP Native Interface (9000/9440 ports) and also HTTP interface but it is experimental.
SQL Queries: It enables executing SQL queries against ClickHouse databases from Python scripts, including data manipulation (insertion, deletion, updating) and data retrieval (select queries).
Query Parameters: Supports parameterized queries, which helps in preventing SQL injection attacks and allows for more efficient execution of repeated queries with different parameter values.
Connection Pooling: Provides support for connection pooling, which helps manage connections efficiently, especially in high-concurrency applications, by reusing existing connections instead of creating new ones for each query.
Data Types: Handles conversion between Python data types and ClickHouse data types, ensuring compatibility and consistency when passing data between Python and ClickHouse.
Error Handling: Offers comprehensive error handling mechanisms, including exceptions and error codes, to facilitate graceful error recovery and handling in Python applications.
Asynchronous Support: Supports asynchronous execution of queries using asyncio, allowing for non-blocking query execution in asynchronous Python applications.
Customization: Provides options for customizing connection settings, query execution behavior, and other parameters to suit specific application requirements and performance considerations.
Compatibility: Works with various versions of ClickHouse, ensuring compatibility and support for different ClickHouse features and functionalities.
Documentation and Community: Offers comprehensive documentation and active community support, including examples, tutorials, and forums, to assist developers in effectively using the library and addressing any issues or questions they may have.
This was the first python driver for ClickHouse. It has a mature codebase. By default ClickHouse drivers uses synchronous code
. There is a wrapper to convert code to asynchronous, https://github.com/long2ice/asynch
Here you can get a basic working example from Altinity repo for ingestion/selection using clickhouse-driver:
The ClickHouse Connect Python driver is the ClickHouse, Inc supported-official Python library. Here’s a summary of its key features:
Connectivity: allows Python applications to connect to ClickHouse servers over HTTP Interface (8123/8443 ports).
Compatibility: The driver is compatible with Python 3.x versions, ensuring that it can be used with modern Python applications without compatibility issues.
Performance: The driver is optimized for performance, allowing for efficient communication with ClickHouse databases to execute queries and retrieve results quickly, which is crucial for applications requiring low latency and high throughput.
Query Execution: Developers can use the driver to execute SQL queries against ClickHouse databases, including SELECT, INSERT, UPDATE, DELETE, and other SQL operations, enabling them to perform various data manipulation tasks from Python applications.
Parameterized Queries: The driver supports parameterized queries, allowing developers to safely pass parameters to SQL queries to prevent SQL injection attacks and improve query performance by reusing query execution plans.
Data Type Conversion: The driver automatically handles data type conversion between Python data types and ClickHouse data types, ensuring seamless integration between Python applications and ClickHouse databases without manual data type conversion.
Error Handling: The driver provides robust error handling mechanisms, including exceptions and error codes, to help developers handle errors gracefully and take appropriate actions based on the type of error encountered during query execution.
Limited Asynchronous Support: Some implementations of the driver offer asynchronous support, allowing developers to execute queries asynchronously to improve concurrency and scalability in asynchronous Python applications using asynchronous I/O frameworks like asyncio.
Configuration Options: The driver offers various configuration options, such as connection parameters, authentication methods, and connection pooling settings, allowing developers to customize the driver’s behavior to suit their specific requirements and environment.
Documentation and Community: Offers comprehensive documentation and active community support, including examples, tutorials, and forums, to assist developers in effectively using the library and addressing any issues or questions they may have. https://clickhouse.com/docs/en/integrations/language-clients/python/intro/
If you want to specify a session_id per query you should be able to use the setting dictionary to pass a session_id for each query (note that ClickHouse will automatically generate a session_id if none is provided).
SETTINGS={"session_id":"dagster-batch"+"-"+f"{time.time()}"}client.query("INSERT INTO table ....",settings=SETTINGS)
importclickhouse_connectimportasynciofromclickhouse_connect.driver.httputilimportget_pool_managerasyncdefmain():client=awaitclickhouse_connect.get_async_client(host='localhost',port=8123,pool_mgr=get_pool_manager())foriinrange(100):result=awaitclient.query("SELECT name FROM system.databases")print(result.result_rows)asyncio.run(main())
clickhouse-connect code is synchronous by default and running synchronous functions in an async application is a workaround and might not be as efficient as using a library/wrapper designed for asynchronous operations from the ground up.. So you can use the current wrapper or you can use another approach with asyncio and concurrent.futures and ThreadpoolExecutor or ProcessPoolExecutor. Python GIL has a mutex over Threads but not to Processes so if you need performance at the cost of using processes instead of threads (not much different for medium workloads) you can use ProcesspoolExecutor instead.
importasynciofromconcurrent.futuresimportProcessPoolExecutorimportclickhouse_connect# Function to execute a query using clickhouse-connect synchronouslydefexecute_query_sync(query):client=clickhouse_connect.get_client()# Adjust connection params as neededresult=client.query(query)returnresult# Asynchronous wrapper function to run the synchronous function in a process poolasyncdefexecute_query_async(query):loop=asyncio.get_running_loop()# Use ProcessPoolExecutor to execute the synchronous functionwithProcessPoolExecutor()aspool:result=awaitloop.run_in_executor(pool,execute_query_sync,query)returnresultasyncdefmain():query="SELECT * FROM your_table LIMIT 10"# Example queryresult=awaitexecute_query_async(query)print(result)# Run the async main functionif__name__=='__main__':asyncio.run(main())
So to use asynchronous approach it is recommended to use a connection pool and some asyncio wrapper that can hide the complexity of using the ThreadPoolExecutor/ProcessPoolExecutor
It reads mysql binlog directly and transform queries into something which ClickHouse® can support. Supports updates and deletes (under the hood implemented via something like ReplacingMergeTree with enforced FINAL and ‘deleted’ flag). Status is ’experimental’, there are quite a lot of known limitations and issues, but some people use it. The original author of that went to another project, and the main team don’t have a lot of resource to improve that for now (more important thing in the backlog)
The replication happens on the mysql database level.
Replication using debezium + Kafka (+ Altinity Sink Connector for ClickHouse)
Debezium can read the binlog and transform it to Kafka messages.
You can later capture the stream of message on ClickHouse side and process it as you like.
Please remember that currently Kafka engine supports only at-least-once delivery guarantees.
It’s used by several companies, quite nice & flexible. But initial setup may require some efforts.
Altinity Sink Connector for ClickHouse
Can handle transformation of debezium messages (with support for DELETEs and UPDATEs) and exactly-once delivery for you.
That was done long time ago in altinity for one use-case, and it seem like it was never used outside of that.
It’s a python application with lot of switches which can copy a schema or read binlog from mysql and put it to ClickHouse.
Not supported currently. But it’s just a python, so maybe can be adjusted to different needs.
Accessing MySQL data via integration engines from inside ClickHouse.
Download the latest release
. On 64bit system you usually need both 32 bit and 64 bit drivers.
Install (usually you will need ANSI driver, but better to install both versions, see below).
Configure ClickHouse DSN.
Note: that install driver linked against MDAC (which is default for Windows), some non-windows native
applications (cygwin / msys64 based) may require driver linked against unixodbc. Build section below.
Add ClickHouse DSN configuration into ~/.odbc.ini file. (sample
)
Note: that install driver linked against iodbc (which is default for Mac), some homebrew applications
(like python) may require unixodbc driver to work properly. In that case see Build section below.
Linux
DEB/RPM packaging is not provided yet, please build & install the driver from sources.
Add ClickHouse DSN configuration into ~/.odbc.ini file. (sample
)
On Windows you can create/edit DSN using GUI tool through Control Panel.
The list of DSN parameters recognized by the driver is as follows:
Parameter
Default value
Description
Url
empty
URL that points to a running ClickHouse instance, may include username, password, port, database, etc.
Proto
deduced from Url, or from Port and SSLMode: https if 443 or 8443 or SSLMode is not empty, http otherwise
Protocol, one of: http, https
Server or Host
deduced from Url
IP or hostname of a server with a running ClickHouse instance on it
Port
deduced from Url, or from Proto: 8443 if https, 8123 otherwise
Port on which the ClickHouse instance is listening
Path
/query
Path portion of the URL
UID or Username
default
User name
PWD or Password
empty
Password
Database
default
Database name to connect to
Timeout
30
Connection timeout
SSLMode
empty
Certificate verification method (used by TLS/SSL connections, ignored in Windows), one of: allow, prefer, require, use allow to enable SSL_VERIFY_PEER
TLS/SSL certificate verification mode, SSL_VERIFY_PEER | SSL_VERIFY_FAIL_IF_NO_PEER_CERT
is used otherwise
PrivateKeyFile
empty
Path to private key file (used by TLS/SSL connections), can be empty if no private key file is used
CertificateFile
empty
Path to certificate file (used by TLS/SSL connections, ignored in Windows), if the private key and the certificate are stored in the same file, this can be empty if PrivateKeyFile is specified
CALocation
empty
Path to the file or directory containing the CA/root certificates (used by TLS/SSL connections, ignored in Windows)
DriverLog
on if CMAKE_BUILD_TYPE is Debug, off otherwise
Enable or disable the extended driver logging
DriverLogFile
\temp\clickhouse-odbc-driver.log on Windows, /tmp/clickhouse-odbc-driver.log otherwise
Path to the extended driver log file (used when DriverLog is on)
Troubleshooting & bug reporting
If some software doesn’t work properly with that driver, but works good with other drivers - we will be appropriate if you will be able to collect debug info.
To debug issues with the driver, first things that need to be done are:
enabling driver manager tracing. Links may contain some irrelevant vendor-specific details.
enabling driver logging, see DriverLog and DriverLogFile DSN parameters above
making sure that the application is allowed to create and write these driver log and driver manager trace files
follow the steps leading to the issue.
Collected log files will help to diagnose & solve the issue.
Driver Managers
Note, that since ODBC drivers are not used directly by a user, but rather accessed through applications, which in their turn access the driver through ODBC driver manager, user have to install the driver for the same architecture (32- or 64-bit) as the application that is going to access the driver. Moreover, both the driver and the application must be compiled for (and actually use during run-time) the same ODBC driver manager implementation (we call them “ODBC providers” here). There are three supported ODBC providers:
ODBC driver manager associated with MDAC (Microsoft Data Access Components, sometimes referenced as WDAC, Windows Data Access Components) - the standard ODBC provider of Windows
UnixODBC - the most common ODBC provider in Unix-like systems. Theoretically, could be used in Cygwin or MSYS/MinGW environments in Windows too.
iODBC - less common ODBC provider, mainly used in Unix-like systems, however, it is the standard ODBC provider in macOS. Theoretically, could be used in Cygwin or MSYS/MinGW environments in Windows too.
If you don’t see a package that matches your platforms, or the version of your system is significantly different than those of the available packages, or maybe you want to try a bleeding edge version of the code that hasn’t been released yet, you can always build the driver manually from sources.
Note, that it is always a good idea to install the driver from the corresponding native package (.msi, etc., which you can also easily create if you are building from sources), than use the binaries that were manually copied to some folder.
Building from sources
The general requirements for building the driver from sources are as follows:
CMake 3.12 and later
C++17 and C11 capable compiler toolchain:
Clang 4 and later
GCC 7 and later
Xcode 10 and later
Microsoft Visual Studio 2017 and later
ODBC Driver manager (MDAC / unixodbc / iODBC)
SSL library (openssl)
Generic build scenario:
git clone --recursive git@github.com:ClickHouse/clickhouse-odbc.git
cd clickhouse-odbc
mkdir build
cd build
cmake -DCMAKE_BUILD_TYPE=RelWithDebInfo ..
cmake --build . -C RelWithDebInfo
Additional requirements exist for each platform, which also depend on whether packaging and/or testing is performed.
Linux/macOS
Execute the following in the terminal to install needed dependencies:
# on Red Hat/CentOS (tested on CentOS 7)sudo yum groupinstall "Development Tools"sudo yum install centos-release-scl
sudo yum install devtoolset-8
sudo yum install git cmake openssl-devel unixODBC-devel # You may use libiodbc-devel INSTEAD of unixODBC-develscl enable devtoolset-8 -- bash # Enable Software collections for that terminal session, to use newer versions of complilers# on Ubuntu (tested on Ubuntu 18.10, for older versions you may need to install newer c++ compiler and cmake versions)sudo apt install build-essential git cmake libpoco-dev libssl-dev unixodbc-dev # You may use libiodbc-devel INSEAD of unixODBC-devel# MacOS: # You will need Xcode 10 or later and Command Line Tools to be installed, as well as [Homebrew](https://brew.sh/).brew install git cmake make poco openssl libiodbc # You may use unixodbc INSTEAD of libiodbc
Note: usually on Linux you use unixODBC driver manager, and on Mac - iODBC.
In some (rare) cases you may need use other driver manager, please do it only
if you clearly understand the differences. Driver should be used with the driver
manager it was linked to.
Enter the cloned source tree, create a temporary build folder, and generate a Makefile for the project in it:
cd clickhouse-odbc
mkdir build
cd build
# Configuration options for the project can be specified in the next command in a form of '-Dopt=val'# For MacOS: you may also add '-G Xcode' to the next command, in order to use Xcode as a build system or IDE, and generate the solution and project files instead of Makefile.cmake -DCMAKE_BUILD_TYPE=RelWithDebInfo ..
…and, optionally, run tests (note, that for non-unit tests, preconfigured driver and DSN entries must exist, that point to the binaries generated in this build folder):
cmake --build . -C RelWithDebInfo --target test
For MacOS: if you configured the project with ‘-G Xcode’ initially, open the IDE and build all, package, and test targets manually from there
cmake --open .
Windows
CMake bundled with the recent versions of Visual Studio can be used.
An SDK required for building the ODBC driver is included in Windows SDK, which in its turn is also bundled with Visual Studio.
You will need to install WiX toolset to be able to generate .msi packages. You can download and install it from WiX toolset home page
.
All of the following commands have to be issued in Visual Studio Command Prompt:
use x86 Native Tools Command Prompt for VS 2019 or equivalent for 32-bit builds
use x64 Native Tools Command Prompt for VS 2019 or equivalent for 64-bit builds
Enter the cloned source tree, create a temporary build folder, and generate the solution and project files in it:
cd clickhouse-odbc
mkdir build
cd build
# Configuration options for the project can be specified in the next command in a form of '-Dopt=val'# Use the following command for 32-bit build only.cmake -A Win32 -DCMAKE_BUILD_TYPE=RelWithDebInfo ..
# Use the following command for 64-bit build only.cmake -A x64 -DCMAKE_BUILD_TYPE=RelWithDebInfo ..
…and, optionally, run tests (note, that for non-unit tests, preconfigured driver and DSN entries must exist, that point to the binaries generated in this build folder):
cmake --build . -C RelWithDebInfo --target test
…or open the IDE and build all, package, and test targets manually from there:
cmake --open .
cmake options
The list of configuration options recognized during the CMake generation step is as follows:
Option
Default value
Description
CMAKE_BUILD_TYPE
RelWithDebInfo
Build type, one of: Debug, Release, RelWithDebInfo
CH_ODBC_ENABLE_SSL
ON
Enable TLS/SSL (required for utilizing https:// interface, etc.)
CH_ODBC_ENABLE_INSTALL
ON
Enable install targets (required for packaging)
CH_ODBC_ENABLE_TESTING
inherits value of BUILD_TESTING
Enable test targets
CH_ODBC_PREFER_BUNDLED_THIRD_PARTIES
ON
Prefer bundled over system variants of third party libraries
CH_ODBC_PREFER_BUNDLED_POCO
inherits value of CH_ODBC_PREFER_BUNDLED_THIRD_PARTIES
Prefer bundled over system variants of Poco library
CH_ODBC_PREFER_BUNDLED_SSL
inherits value of CH_ODBC_PREFER_BUNDLED_POCO
Prefer bundled over system variants of TLS/SSL library
CH_ODBC_PREFER_BUNDLED_GOOGLETEST
inherits value of CH_ODBC_PREFER_BUNDLED_THIRD_PARTIES
Prefer bundled over system variants of Google Test library
CH_ODBC_PREFER_BUNDLED_NANODBC
inherits value of CH_ODBC_PREFER_BUNDLED_THIRD_PARTIES
Prefer bundled over system variants of nanodbc library
CH_ODBC_RUNTIME_LINK_STATIC
OFF
Link with compiler and language runtime statically
CH_ODBC_THIRD_PARTY_LINK_STATIC
ON
Link with third party libraries statically
CH_ODBC_DEFAULT_DSN_ANSI
ClickHouse DSN (ANSI)
Default ANSI DSN name
CH_ODBC_DEFAULT_DSN_UNICODE
ClickHouse DSN (Unicode)
Default Unicode DSN name
TEST_DSN
inherits value of CH_ODBC_DEFAULT_DSN_ANSI
ANSI DSN name to use in tests
TEST_DSN_W
inherits value of CH_ODBC_DEFAULT_DSN_UNICODE
Unicode DSN name to use in tests
Packaging / redistributing the driver
You can just copy the library to another computer, in that case you need to
install run-time dependencies on target computer
Windows:
MDAC driver manager (preinstalled on all modern Windows systems)
C++ Redistributable for Visual Studio 2017 or same for 2019, etc.
register the driver so that the corresponding ODBC provider is able to locate it.
All this involves modifying a dedicated registry keys in case of MDAC, or editing odbcinst.ini (for driver registration) and odbc.ini (for DSN definition) files for UnixODBC or iODBC, directly or indirectly.
This will be done automatically using some default values if you are installing the driver using native installers.
Otherwise, if you are configuring manually, or need to modify the default configuration created by the installer, please see the exact locations of files (or registry keys) that need to be modified.
4.5 - ClickHouse® + Spark
jdbc
The trivial & natural way to talk to ClickHouse from Spark is using jdbc. There are 2 jdbc drivers:
ClickHouse can produce / consume data from/to Kafka to exchange data with Spark.
via hdfs
You can load data into hadoop/hdfs using sequence of statements like INSERT INTO FUNCTION hdfs(...) SELECT ... FROM clickhouse_table
later process the data from hdfs by spark and do the same in reverse direction.
via s3
Similar to above but using s3.
via shell calls
You can call other commands from Spark. Those commands can be clickhouse-client and/or clickhouse-local.
do you really need Spark? :)
In many cases you can do everything inside ClickHouse without Spark help :)
Arrays, Higher-order functions, machine learning, integration with lot of different things including the possibility to run some external code using executable dictionaries or UDF.
More info + some unordered links (mostly in Chinese / Russian)
HDFS+ClickHouse+Spark: A lightweight big data analysis system from 0 to 1. (Chinese: HDFS+ClickHouse+Spark:从0到1实现一款轻量级大数据分析系统) https://juejin.cn/post/6850418114962653198
Article is based on feedback provided by one of Altinity clients.
CatBoost:
It uses gradient boosting - a hard to use technique which can outperform neural networks. Gradient boosting is powerful but it’s easy to shoot yourself in the foot using it.
The documentation on how to use it is quite lacking. The only good source of information on how to properly configure a model to yield good results is this video: https://www.youtube.com/watch?v=usdEWSDisS0
. We had to dig around GitHub issues to find out how to make it work with ClickHouse®.
CatBoost is fast. Other libraries will take ~5X to ~10X as long to do what CatBoost does.
CatBoost will do preprocessing out of the box (fills nulls, apply standard scaling, encodes strings as numbers).
CatBoost has all functions you’d need (metrics, plotters, feature importance)
It makes sense to split what CatBoost does into 2 parts:
preprocessing (fills nulls, apply standard scaling, encodes strings as numbers)
number crunching (convert preprocessed numbers to another number - ex: revenue of impression)
Compared to Fast.ai
, CatBoost pre-processing is as simple to use and produces results that can be as good as Fast.ai
.
The number crunching part of Fast.ai
is no-config. For CatBoost you need to configure it, a lot.
CatBoost won’t simplify or hide any complexity of the process. So you need to know data science terms and what it does (ex: if your model is underfitting you can use a smaller l2_reg parameter in the model constructor).
In the end both Fast.ai
and CatBoost can yield comparable results.
Regarding deploying models, CatBoost is really good. The model runs fast, it has a simple binary format which can be loaded in ClickHouse, C, or Python and it will encapsulate pre-processing with the binary file. Deploying Fast.ai
models at scale/speed is impossible out of the box (we have our custom solution to do it which is not simple).
TLDR: CatBoost is fast, produces awesome models, is super easy to deploy and it’s easy to use/train (after becoming familiar with it despite the bad documentation & if you know data science terms).
Regarding MindsDB
The project seems to be a good idea but it’s too young. I was using the GUI version and I’ve encountered some bugs, and none of those bugs have a good error message.
It won’t show data in preview.
The “download” button won’t work.
It’s trying to create and drop tables in ClickHouse without me asking it to.
Other than bugs:
It will only use 1 core to do everything (training, analysis, download).
Analysis will only run with a very small subset of data, if I use something like 1M rows it never finishes.
Training a model on 100k rows took 25 minutes - (CatBoost takes 90s to train with 1M rows)
The model trained on MindsDB is way worse. It had r-squared of 0.46 (CatBoost=0.58)
To me it seems that they are a plugin which connects ClickHouse to MySQL to run the model in Pytorch.
It’s too complex and hard to debug and understand. The resulting model is not good enough.
TLDR: Easy to use (if bugs are ignored), too slow to train & produces a bad model.
4.8 - Google S3 (GCS)
GCS with the table function - seems to work correctly for simple scenarios.
This bucket must be set as part of the default project for the account. This configuration can be found in settings -> interoperability.
Generate a HMAC key for the account, can be done in settings -> interoperability, in the section for user account access keys.
In ClickHouse®, replace the S3 bucket endpoint with the GCS bucket endpoint This must be done with the path-style GCS endpoint: https://storage.googleapis.com/BUCKET_NAME/OBJECT_NAME.
Replace the aws access key id and aws secret access key with the corresponding parts of the HMAC key.
4.9 - Kafka engine
Kafka engine
librdkafka changelog
This changelog tracks the librdkafka version bundled with ClickHouse and notable related fixes.
<yandex><kafka><security_protocol>sasl_ssl</security_protocol><!-- Depending on your broker config you may need to uncomment below sasl_mechanism --><!-- <sasl_mechanism>SCRAM-SHA-512</sasl_mechanism> --><sasl_username>root</sasl_username><sasl_password>toor</sasl_password></kafka></yandex>
<yandex><kafka><security_protocol>sasl_ssl</security_protocol><sasl_mechanism>SCRAM-SHA-512</sasl_mechanism><sasl_username>root</sasl_username><sasl_password>toor</sasl_password><!-- fullchain cert here --><ssl_ca_location>/path/to/cert/fullchain.pem</ssl_ca_location></kafka></yandex>
Inline Kafka certs
To connect to some Kafka cloud services you may need to use certificates.
If needed they can be converted to pem format and inlined into ClickHouse® config.xml
Example:
<yandex><kafka><auto_offset_reset>smallest</auto_offset_reset><security_protocol>SASL_SSL</security_protocol><!-- older broker versions may need this below, for newer versions ignore --><!-- <ssl_endpoint_identification_algorithm>https</ssl_endpoint_identification_algorithm> --><sasl_mechanism>PLAIN</sasl_mechanism><sasl_username>username</sasl_username><sasl_password>password</sasl_password><!-- Same as above here ignore if newer broker version --><!-- <ssl_ca_location>probe</ssl_ca_location> --></kafka></yandex>
Some random example using SSL certificates to authenticate:
<yandex><kafka><max_poll_interval_ms>60000</max_poll_interval_ms><session_timeout_ms>60000</session_timeout_ms><heartbeat_interval_ms>10000</heartbeat_interval_ms><reconnect_backoff_ms>5000</reconnect_backoff_ms><reconnect_backoff_max_ms>60000</reconnect_backoff_max_ms><request_timeout_ms>20000</request_timeout_ms><retry_backoff_ms>500</retry_backoff_ms><message_max_bytes>20971520</message_max_bytes><debug>all</debug><!-- only to get the errors --><security_protocol>SSL</security_protocol><ssl_ca_location>/etc/clickhouse-server/ssl/kafka-ca-qa.crt</ssl_ca_location><ssl_certificate_location>/etc/clickhouse-server/ssl/client_clickhouse_client.pem</ssl_certificate_location><ssl_key_location>/etc/clickhouse-server/ssl/client_clickhouse_client.key</ssl_key_location><ssl_key_password>pass</ssl_key_password></kafka></yandex>
Authentication / connectivity
Sometimes the consumer group needs to be explicitly allowed in the broker UI config.
Use general Kafka/librdkafka settings from this page first, then apply provider-specific options from Config by provider
.
If we don’t have enough data (rows limit: kafka_max_block_size 1048576) or time limit reached (kafka_flush_interval_ms 7500ms) - continue polling (goto p.1)
Write a collected block of data to MV
Do commit (commit after write = at-least-once).
On any error, during that process, Kafka client is restarted (leading to rebalancing - leave the group and get back in few seconds).
kafka_commit_every_batch = 1 will change the loop logic mentioned above. Consumed batch committed to the Kafka and the block of rows send to Materialized Views only after that. It could be resembled as at-most-once delivery mode as prevent duplicate creation but allow loss of data in case of failures.
4.9.1.5 - SELECTs from engine=Kafka
SELECTs from engine=Kafka
Question
What will happen, if we would run SELECT query from working Kafka table with MV attached? Would data showed in SELECT query appear later in MV destination table?
Answer
Most likely SELECT query would show nothing.
If you lucky enough and something would show up, those rows wouldn’t appear in MV destination table.
So it’s not recommended to run SELECT queries on working Kafka tables.
In case of debug it’s possible to use another Kafka table with different consumer_group, so it wouldn’t affect your main pipeline.
4.9.2 - Consumption Patterns
Message consumption models, replay patterns, and delivery semantics.
4.9.2.1 - Exactly once semantics
Exactly once semantics
EOS consumer (isolation.level=read_committed) is enabled by default since librdkafka 1.2.0, so for ClickHouse® - since 20.2
BUT: while EOS semantics will guarantee you that no duplicates will happen on the Kafka side (i.e. even if you produce the same messages few times it will be consumed once), but ClickHouse as a Kafka client can currently guarantee only at-least-once. And in some corner cases (connection lost etc) you can get duplicates.
We need to have something like transactions on ClickHouse side to be able to avoid that. Adding something like simple transactions is in plans for Y2022.
block-aggregator by eBay
Block Aggregator is a data loader that subscribes to Kafka topics, aggregates the Kafka messages into blocks that follow the ClickHouse’s table schemas, and then inserts the blocks into ClickHouse. Block Aggregator provides exactly-once delivery guarantee to load data from Kafka to ClickHouse. Block Aggregator utilizes Kafka’s metadata to keep track of blocks that are intended to send to ClickHouse, and later uses this metadata information to deterministically re-produce ClickHouse blocks for re-tries in case of failures. The identical blocks are guaranteed to be deduplicated by ClickHouse.
For very large topics when you need more parallelism (especially on the insert side) you may use several tables with the same pipeline (pre ClickHouse® 20.9) or enable kafka_thread_per_consumer (after 20.9).
kafka_num_consumers=N,kafka_thread_per_consumer=1
Notes:
the inserts will happen in parallel (without that setting inserts happen linearly)
enough partitions are needed.
kafka_num_consumers is limited by number of physical cores (half of vCPUs). kafka_disable_num_consumers_limit can be used to override the limit.
background_message_broker_schedule_pool_size is 16 by default, you may need to increase if using more than 16 consumers
Before increasing kafka_num_consumers with keeping kafka_thread_per_consumer=0 may improve consumption & parsing speed, but flushing & committing still happens by a single thread there (so inserts are linear).
4.9.2.3 - Multiple MVs attached to Kafka table
How Multiple MVs attached to Kafka table consume and how they are affected by kafka_num_consumers/kafka_thread_per_consumer
Kafka Consumer is a thread inside the Kafka Engine table that is visible by Kafka monitoring tools like kafka-consumer-groups and in Clickhouse in system.kafka_consumers table.
Having multiple consumers increases ingesting parallelism and can significantly speed up event processing. However, it comes with a trade-off: it’s a CPU-intensive task, especially under high event load and/or complicated parsing of incoming data. Therefore, it’s crucial to create as many consumers as you really need and ensure you have enough CPU cores to handle them. We don’t recommend creating too many Kafka Engines per server because it could lead to uncontrolled CPU usage in situations like bulk data upload or catching up a huge kafka lag due to excessive parallelism of the ingesting process.
kafka_thread_per_consumer meaning
Consider a basic pipeline depicted as a Kafka table with 2 MVs attached. The Kafka broker has 2 topics and 4 partitions.
kafka_thread_per_consumer = 0
Kafka engine table will act as 2 consumers, but only 1 insert thread for both of them. It is important to note that the topic needs to have as many partitions as consumers. For this scenario, we use these settings:
The same Kafka engine will create 2 streams, 1 for each consumer, and will join them in a union stream. And it will use 1 thread for inserting [ 2385 ]
This is how we can see it in the logs:
2022.11.09 17:49:34.282077 [ 2385 ] {} <Debug> StorageKafka (kafka_table): Started streaming to 2 attached views
How ClickHouse® calculates the number of threads depending on the thread_per_consumer setting:
With this approach, even if the number of consumers increased, the Kafka engine will still use only 1 thread to flush. The consuming/processing rate will probably increase a bit, but not linearly. For example, 5 consumers will not consume 5 times faster. Also, a good property of this approach is the linearization of INSERTS, which means that the order of the inserts is preserved and sequential. This option is good for small/medium Kafka topics.
kafka_thread_per_consumer = 1
Kafka engine table will act as 2 consumers and 1 thread per consumer. For this scenario, we use these settings:
With this approach, the number of consumers remains the same, but each consumer will use their own insert/flush thread, and the consuming/processing rate should increase.
Background Pool
In Clickhouse there is a special thread pool for background processes, such as streaming engines. Its size is controlled by the background_message_broker_schedule_pool_size setting and is 16 by default. If you exceed this limit across all tables on the server, you’ll likely encounter continuous Kafka rebalances, which will slow down processing considerably. For a server with a lot of CPU cores, you can increase that limit to a higher value, like 20 or even 40. background_message_broker_schedule_pool_size = 20 allows you to create 5 Kafka Engine tables with 4 consumers each of them has its own insert thread. This option is good for large Kafka topics with millions of messages per second.
Multiple Materialized Views
Attaching multiple Materialized Views (MVs) to a Kafka Engine table can be used when you need to apply different transformations to the same topic and store the resulting data in different tables.
(This approach also applies to the other streaming engines - RabbitMQ, s3queue, etc).
All streaming engines begin processing data (reading from the source and producing insert blocks) only after at least one Materialized View is attached to the engine. Multiple Materialized Views can be connected to distribute data across various tables with different transformations. But how does it work when the server starts?
Once the first Materialized View (MV) is loaded, started, and attached to the Kafka/s3queue table, data consumption begins immediately—data is read from the source, pushed to the destination, and the pointers advance to the next position. However, any other MVs that haven’t started yet will miss the data consumed by the first MV, leading to some data loss.
This issue worsens with asynchronous table loading. Tables are only loaded upon first access, and the loading process takes time. When multiple MVs direct the data stream to different tables, some tables might be ready sooner than others. As soon as the first table becomes ready, data consumption starts, and any tables still loading will miss the data consumed during that interval, resulting in further data loss for those tables.
That means when you make a design with Multiple MVs async_load_databases should be switched off:
Also, you have to prevent starting to consume until all MVs are loaded and started. For that, you can add an additional Null table to the MV pipeline, so the Kafka table will pass the block to a single Null table first, and only then many MVs start their own transformations to many dest tables:
When a consumer joins the consumer group, the broker will check if it has a committed offset. If that is the case, then it will start from the latest offset. Both ClickHouse and librdKafka documentation state that the default value for auto_offset_reset is largest (or latest in new Kafka versions) but it is not, if the consumer is new:
conf.set("auto.offset.reset", "earliest"); // If no offset stored for this group, read all messages from the start
If there is no offset stored or it is out of range, for that particular consumer group, the consumer will start consuming from the beginning (earliest), and if there is some offset stored then it should use the latest.
The log retention policy influences which offset values correspond to the earliest and latest configurations. Consider a scenario where a topic has a retention policy set to 1 hour. Initially, you produce 5 messages, and then, after an hour, you publish 5 more messages. In this case, the latest offset will remain unchanged from the previous example. However, due to Kafka removing the earlier messages, the earliest available offset will not be 0; instead, it will be 5.
4.9.3 - Schema and Formats
Schema inference and format-specific integration details.
4.9.3.1 - Inferring Schema from AvroConfluent Messages in Kafka for ClickHouse®
Learn how to define Kafka table structures in ClickHouse® by using Avro’s schema registry & sample message.
To consume messages from Kafka within ClickHouse®, you need to define the ENGINE=Kafka table structure with all the column names and types.
This task can be particularly challenging when dealing with complex Avro messages, as manually determining the exact schema for
ClickHouse is both tricky and time-consuming. This complexity is particularly frustrating in the case of Avro formats,
where the column names and their types are already clearly defined in the schema registry.
Although ClickHouse supports schema inference for files, it does not natively support this for Kafka streams.
Here’s a workaround to infer the schema using AvroConfluent messages:
Step 1: Capture and Store a Raw Kafka Message
First, create a table in ClickHouse to consume a raw message from Kafka and store it as a file:
CREATETABLEtest_kafka(rawString)ENGINE=KafkaSETTINGSkafka_broker_list='localhost:29092',kafka_topic_list='movies-raw',kafka_format='RawBLOB',-- Don't try to parse the message, return it 'as is'
kafka_group_name='tmp_test';-- Using some dummy consumer group here.
INSERTINTOFUNCTIONfile('./avro_raw_sample.avro','RawBLOB')SELECT*FROMtest_kafkaLIMIT1SETTINGSmax_block_size=1,stream_like_engine_allow_direct_select=1;DROPTABLEtest_kafka;
Step 2: Infer Schema Using the Stored File
Using the stored raw message, let ClickHouse infer the schema based on the AvroConfluent format and a specified schema registry URL:
This approach reduces manual schema definition efforts and enhances data integration workflows by utilizing the schema inference capabilities of ClickHouse for AvroConfluent messages.
Appendix
Avro is a binary serialization format used within Apache Kafka for efficiently serializing data with a compact binary format. It relies on schemas, which define the structure of the serialized data, to ensure robust data compatibility and type safety.
Schema Registry is a service that provides a centralized repository for Avro schemas. It helps manage and enforce schemas across applications, ensuring that the data exchanged between producers and consumers adheres to a predefined format, and facilitates schema evolution in a safe manner.
In ClickHouse, the Avro format is used for data that contains the schema embedded directly within the file or message. This means the structure of the data is defined and included with the data itself, allowing for self-describing messages. However, embedding the schema within every message is not optimal for streaming large volumes of data, as it increases the workload and network overhead. Repeatedly passing the same schema with each message can be inefficient, particularly in high-throughput environments.
On the other hand, the AvroConfluent format in ClickHouse is specifically designed to work with the Confluent Schema Registry. This format expects the schema to be managed externally in a schema registry rather than being embedded within each message. It retrieves schema information from the Schema Registry, which allows for centralized schema management and versioning, facilitating easier schema evolution and enforcement across different applications using Kafka.
4.9.4 - Operations and Troubleshooting
Runtime tuning, resource settings, and error diagnostics.
4.9.4.1 - Setting the background message broker schedule pool size
Guide to managing the background_message_broker_schedule_pool_size setting for Kafka, RabbitMQ, and NATS table engines in your database.
Overview
When using Kafka, RabbitMQ, or NATS table engines in ClickHouse®, you may encounter issues related to a saturated background thread pool. One common symptom is a warning similar to the following:
2025.03.14 08:44:26.725868 [ 344 ] {} <Warning> StorageKafka (events_kafka): [rdk:MAXPOLL] [thrd:main]: Application maximum poll interval (60000ms) exceeded by 159ms (adjust max.poll.interval.ms for long-running message processing): leaving group
This warning typically appears not because ClickHouse fails to poll, but because there are no available threads in the background pool to handle the polling in time. In rare cases, the same error might also be caused by long flushing operations to Materialized Views (MVs), especially if their logic is complex or chained.
To resolve this, you should monitor and, if needed, increase the value of the background_message_broker_schedule_pool_size setting.
Step 1: Check Thread Pool Utilization
Run the following SQL query to inspect the current status of your background message broker thread pool:
If free_threads is close to zero or negative, it means your thread pool is saturated and should be increased.
Step 2: Estimate Required Pool Size
To estimate a reasonable value for background_message_broker_schedule_pool_size, run the following query:
WITHtoUInt32OrDefault(extract(engine_full,'kafka_num_consumers\s*=\s*(\d+)'))askafka_num_consumers,extract(engine_full,'kafka_thread_per_consumer\s*=\s*(\d+|\'true\')')notin('','0')askafka_thread_per_consumer,multiIf(engine='Kafka',if(kafka_thread_per_consumerANDkafka_num_consumers>0,kafka_num_consumers,1),engine='RabbitMQ',3,engine='NATS',3,0/* should not happen */)asthreads_neededSELECTceil(sum(threads_needed)*1.25)FROMsystem.tablesWHEREenginein('Kafka','RabbitMQ','NATS')
This will return an estimate that includes a 25% buffer to accommodate spikes in load.
Step 3: Apply the New Setting
Create or update the following configuration file:
After applying the configuration, restart ClickHouse to apply the changes:
sudo systemctl restart clickhouse-server
Summary
A saturated background message broker thread pool can lead to missed Kafka polls and consumer group dropouts. Monitoring your metrics and adjusting background_message_broker_schedule_pool_size accordingly ensures stable operation of Kafka, RabbitMQ, and NATS integrations.
If the problem persists even after increasing the pool size, consider investigating slow MV chains or flushing logic as a potential bottleneck.
4.9.4.2 - Error handling
Error handling
Pre 21.6
There are couple options:
Certain formats which has schema in built in them (like JSONEachRow) could silently skip any unexpected fields after enabling setting input_format_skip_unknown_fields
It’s also possible to skip up to N malformed messages for each block, with used setting kafka_skip_broken_messages but it’s also does not support all possible formats.
After 21.6
It’s possible to stream messages which could not be parsed, this behavior could be enabled via setting: kafka_handle_error_mode='stream' and ClickHouse® wil write error and message from Kafka itself to two new virtual columns: _error, _raw_message.
So you can create another Materialized View which would collect to a separate table all errors happening while parsing with all important information like offset and content of message.
Allow to save unparsed records and errors in RabbitMQ:
NATS and FileLog engines. Add virtual columns _error and _raw_message (for NATS and RabbitMQ), _raw_record (for FileLog) that are filled when ClickHouse fails to parse new record.
The behaviour is controlled under storage settings nats_handle_error_mode for NATS, rabbitmq_handle_error_mode for RabbitMQ, handle_error_mode for FileLog similar to kafka_handle_error_mode.
If it’s set to default, en exception will be thrown when ClickHouse fails to parse a record, if it’s set to stream, error and raw record will be saved into virtual columns.
Closes #36035
and #55477
CREATETABLEIFNOTEXISTSrabbitmq.broker_errors_queue(exchange_nameString,channel_idString,delivery_tagUInt64,redeliveredUInt8,message_idString,timestampUInt64)engine=RabbitMQSETTINGSrabbitmq_host_port='localhost:5672',rabbitmq_exchange_name='exchange-test',-- required parameter even though this is done via the rabbitmq config
rabbitmq_queue_consume=true,rabbitmq_queue_base='test-errors',rabbitmq_format='JSONEachRow',rabbitmq_username='guest',rabbitmq_password='guest',rabbitmq_handle_error_mode='stream';CREATEMATERIALIZEDVIEWIFNOTEXISTSrabbitmq.broker_errors_mv(exchange_nameString,channel_idString,delivery_tagUInt64,redeliveredUInt8,message_idString,timestampUInt64raw_messageString,errorString)ENGINE=MergeTreeORDERBY(error)SETTINGSindex_granularity=8192ASSELECT_exchange_nameASexchange_name,_channel_idASchannel_id,_delivery_tagASdelivery_tag,_redeliveredASredelivered,_message_idASmessage_id,_timestampAStimestamp,_raw_messageASraw_message,_errorASerrorFROMrabbitmq.broker_errors_queueWHERElength(_error)>0
5 - Setup & maintenance
Learn how to set up, deploy, monitor, and backup ClickHouse® with step-by-step guides.
5.1 - S3 & object storage
S3 & object storage
5.1.1 - AWS S3 Recipes
AWS S3 Recipes
Using AWS IAM — Identity and Access Management roles
For EC2 instance, there is an option to configure an IAM role:
Role shall contain a policy with permissions like:
5.1.3 - How much data are written to S3 during mutations
Example of how much data ClickHouse® reads and writes to s3 during mutations.
Configuration
S3 disk with disabled merges
<clickhouse><storage_configuration><disks><s3disk><type>s3</type><endpoint>https://s3.us-east-1.amazonaws.com/mybucket/test/test/</endpoint><use_environment_credentials>1</use_environment_credentials><!-- use IAM AWS role --><!--access_key_id>xxxx</access_key_id>
<secret_access_key>xxx</secret_access_key--></s3disk></disks><policies><s3tiered><volumes><default><disk>default</disk></default><s3disk><disk>s3disk</disk><prefer_not_to_merge>true</prefer_not_to_merge></s3disk></volumes></s3tiered></policies></storage_configuration></clickhouse>
Let’s create a table and load some synthetic data.
altertabletest_s3modifyTTLD+interval10daytodisk's3disk';-- 10 minutes later
┌─disk_name─┬─partition──┬─sum(rows)─┬─size──────┬─part_count─┐│s3disk│2023-05-06│10000000│78.23MiB│5││s3disk│2023-05-07│10000000│78.31MiB│6││s3disk│2023-05-08│10000000│78.16MiB│5││s3disk│2023-05-09│10000000│78.21MiB│6││s3disk│2023-05-10│10000000│78.21MiB│6│...│s3disk│2023-07-02│10000000│78.22MiB│5│...│default│2023-07-11│10000000│78.20MiB│6││default│2023-07-12│10000000│78.21MiB│5││default│2023-07-13│10000000│78.23MiB│6││default│2023-07-14│10000000│77.40MiB│5│└───────────┴────────────┴───────────┴───────────┴────────────┘70rowsinset.Elapsed:0.007sec.
Sizes of a table on S3 and a size of each column
select sum(rows), formatReadableSize(sum(bytes_on_disk)) size
from system.parts where table= 'test_s3' and active and disk_name = 's3disk';
┌─sum(rows)─┬─size─────┐
│ 600000000 │ 4.58 GiB │
└───────────┴──────────┘
SELECT
database,
table,
column,
formatReadableSize(sum(column_data_compressed_bytes) AS size) AS compressed
FROM system.parts_columns
WHERE (active = 1) AND (database LIKE '%') AND (table LIKE 'test_s3') AND (disk_name = 's3disk')
GROUP BY
database,
table,
column
ORDER BY column ASC
┌─database─┬─table───┬─column─┬─compressed─┐
│ default │ test_s3 │ A │ 2.22 GiB │
│ default │ test_s3 │ D │ 5.09 MiB │
│ default │ test_s3 │ S │ 2.33 GiB │
└──────────┴─────────┴────────┴────────────┘
Select using fullscan of S column read only 2.36 GiB from S3, the whole S column (2.33 GiB) plus parts of A and D.
delete from test_s3 where A=100000000;
0 rows in set. Elapsed: 17.429 sec.
┌─q──┬─S3GetObject─┬─S3PutObject─┬─ReadBufferFromS3─┬─WriteBufferFromS3─┐
│ Q3 │ 2981 │ 6 │ 23.06 MiB │ 27.25 KiB │
└────┴─────────────┴─────────────┴──────────────────┴───────────────────┘
insert into test select 'Q3' q, event,value from system.events where event like '%S3%';
delete from test_s3 where S='100000001';
0 rows in set. Elapsed: 31.417 sec.
┌─q──┬─S3GetObject─┬─S3PutObject─┬─ReadBufferFromS3─┬─WriteBufferFromS3─┐
│ Q4 │ 4209 │ 6 │ 2.39 GiB │ 27.25 KiB │
└────┴─────────────┴─────────────┴──────────────────┴───────────────────┘
insert into test select 'Q4' q, event,value from system.events where event like '%S3%';
alter table test_s3 delete where A=110000000 settings mutations_sync=2;
0 rows in set. Elapsed: 19.521 sec.
┌─q──┬─S3GetObject─┬─S3PutObject─┬─ReadBufferFromS3─┬─WriteBufferFromS3─┐
│ Q5 │ 2986 │ 15 │ 42.27 MiB │ 41.72 MiB │
└────┴─────────────┴─────────────┴──────────────────┴───────────────────┘
insert into test select 'Q5' q, event,value from system.events where event like '%S3%';
alter table test_s3 delete where S='110000001' settings mutations_sync=2;
0 rows in set. Elapsed: 29.650 sec.
┌─q──┬─S3GetObject─┬─S3PutObject─┬─ReadBufferFromS3─┬─WriteBufferFromS3─┐
│ Q6 │ 4212 │ 15 │ 2.42 GiB │ 41.72 MiB │
└────┴─────────────┴─────────────┴──────────────────┴───────────────────┘
insert into test select 'Q6' q, event,value from system.events where event like '%S3%';
5.1.4 - Example of the table at s3 with cache
s3 disk and s3 cache.
Storage configuration
cat /etc/clickhouse-server/config.d/s3.xml
<clickhouse><storage_configuration><disks><s3disk><type>s3</type><endpoint>https://s3.us-east-1.amazonaws.com/mybucket/test/s3cached/</endpoint><use_environment_credentials>1</use_environment_credentials><!-- use IAM AWS role --><!--access_key_id>xxxx</access_key_id>
<secret_access_key>xxx</secret_access_key--></s3disk><cache><type>cache</type><disk>s3disk</disk><path>/var/lib/clickhouse/disks/s3_cache/</path><max_size>50Gi</max_size><!-- 50GB local cache to cache remote data --></cache></disks><policies><s3tiered><volumes><default><disk>default</disk><max_data_part_size_bytes>50000000000</max_data_part_size_bytes><!-- only for parts less than 50GB after they moved to s3 during merges --></default><s3cached><disk>cache</disk><!-- sandwich cache plus s3disk --><!-- prefer_not_to_merge>true</prefer_not_to_merge>
<perform_ttl_move_on_insert>false</perform_ttl_move_on_insert--></s3cached></volumes></s3tiered></policies></storage_configuration></clickhouse>
The mydata table is created without the explicitly defined storage_policy, it means that implicitly storage_policy=default / volume=default / disk=default.
selectdisk_name,partition,sum(rows),formatReadableSize(sum(bytes_on_disk))size,count()part_countfromsystem.partswheretable='mydata'andactivegroupbydisk_name,partitionorderbypartition;┌─disk_name─┬─partition─┬─sum(rows)─┬─size───────┬─part_count─┐│default│202201│516666677│4.01GiB│13││default│202202│466666657│3.64GiB│13││default│202203│16666666│138.36MiB│10││default│202301│516666677│4.01GiB│10││default│202302│466666657│3.64GiB│10││default│202303│16666666│138.36MiB│10│└───────────┴───────────┴───────────┴────────────┴────────────┘-- Let's change the storage policy, this command instant and changes only metadata of the table, and possible because the new storage policy and the old has the volume `default`.
altertablemydatamodifysettingstorage_policy='s3tiered';0rowsinset.Elapsed:0.057sec.
straightforward (heavy) approach
-- Let's add TTL, it's a heavy command and takes a lot time and creates the performance impact, because it reads `D` column and moves parts to s3.
altertablemydatamodifyTTLD+interval1yeartovolume's3cached';0rowsinset.Elapsed:140.661sec.┌─disk_name─┬─partition─┬─sum(rows)─┬─size───────┬─part_count─┐│s3disk│202201│516666677│4.01GiB│13││s3disk│202202│466666657│3.64GiB│13││s3disk│202203│16666666│138.36MiB│10││default│202301│516666677│4.01GiB│10││default│202302│466666657│3.64GiB│10││default│202303│16666666│138.36MiB│10│└───────────┴───────────┴───────────┴────────────┴────────────┘
gentle (manual) approach
-- alter modify TTL changes only metadata of the table and applied to only newly insterted data.
setmaterialize_ttl_after_modify=0;altertablemydatamodifyTTLD+interval1yeartovolume's3cached';0rowsinset.Elapsed:0.049sec.-- move data slowly partition by partition
altertablemydatamovepartitionid'202201'tovolume's3cached';0rowsinset.Elapsed:49.410sec.altertablemydatamovepartitionid'202202'tovolume's3cached';0rowsinset.Elapsed:36.952sec.altertablemydatamovepartitionid'202203'tovolume's3cached';0rowsinset.Elapsed:4.808sec.-- data can be optimized to reduce number of parts before moving it to s3
optimizetablemydatapartitionid'202301'final;0rowsinset.Elapsed:66.551sec.altertablemydatamovepartitionid'202301'tovolume's3cached';0rowsinset.Elapsed:33.332sec.┌─disk_name─┬─partition─┬─sum(rows)─┬─size───────┬─part_count─┐│s3disk│202201│516666677│4.01GiB│13││s3disk│202202│466666657│3.64GiB│13││s3disk│202203│16666666│138.36MiB│10││s3disk│202301│516666677│4.01GiB│1│-- optimized partition
│default│202302│466666657│3.64GiB│13││default│202303│16666666│138.36MiB│10│└───────────┴───────────┴───────────┴────────────┴────────────┘
S3 and ClickHouse® start time
Let’s create a table with 1000 parts and move them to s3.
CREATETABLEtest_s3(AInt64,SString,DDate)ENGINE=MergeTreePARTITIONBYDORDERBYASETTINGSstorage_policy='s3tiered';insertintotest_s3selectnumber,number,toDate('2000-01-01')+intDiv(number,1e6)fromnumbers(1e9);optimizetabletest_s3finalsettingsoptimize_skip_merged_partitions=1;selectdisk_name,sum(rows),formatReadableSize(sum(bytes_on_disk))size,count()part_countfromsystem.partswheretable='test_s3'andactivegroupbydisk_name;┌─disk_name─┬──sum(rows)─┬─size─────┬─part_count─┐│default│1000000000│7.64GiB│1000│└───────────┴────────────┴──────────┴────────────┘altertabletest_s3modifyttlD+interval1yeartodisk's3disk';selectdisk_name,sum(rows),formatReadableSize(sum(bytes_on_disk))size,count()part_countfromsystem.partswheretable='test_s3'andactivegroupbydisk_name;┌─disk_name─┬─sum(rows)─┬─size─────┬─part_count─┐│default│755000000│5.77GiB│755││s3disk│245000000│1.87GiB│245│└───────────┴───────────┴──────────┴────────────┘---- several minutes later ----
┌─disk_name─┬──sum(rows)─┬─size─────┬─part_count─┐│s3disk│1000000000│7.64GiB│1000│└───────────┴────────────┴──────────┴────────────┘
start time
:) select name, value from system.merge_tree_settings where name = 'max_part_loading_threads';
┌─name─────────────────────┬─value─────┐
│ max_part_loading_threads │ 'auto(4)' │
└──────────────────────────┴───────────┘
# systemctl stop clickhouse-server
# time systemctl start clickhouse-server / real 4m26.766s
# systemctl stop clickhouse-server
# time systemctl start clickhouse-server / real 4m24.263s
# cat /etc/clickhouse-server/config.d/max_part_loading_threads.xml
<?xml version="1.0"?>
<clickhouse>
<merge_tree>
<max_part_loading_threads>128</max_part_loading_threads>
</merge_tree>
</clickhouse>
# systemctl stop clickhouse-server
# time systemctl start clickhouse-server / real 0m11.225s
# systemctl stop clickhouse-server
# time systemctl start clickhouse-server / real 0m10.797s
<max_part_loading_threads>256</max_part_loading_threads>
# systemctl stop clickhouse-server
# time systemctl start clickhouse-server / real 0m8.474s
# systemctl stop clickhouse-server
# time systemctl start clickhouse-server / real 0m8.130s
skip_access_check — if true, it’s possible to use read only credentials with regular MergeTree table. But you would need to disable merges (prefer_not_to_merge setting) on s3 volume as well.
send_metadata — if true, ClickHouse® will populate s3 object with initial part & file path, which allow you to recover metadata from s3 and make debug easier.
Restore metadata from S3
Default
Limitations:
ClickHouse need RW access to this bucket
In order to restore metadata, you would need to create restore file in metadata_path/_s3_disk_name_ directory:
5.2 - AggregateFunction(uniq, UUID) doubled after ClickHouse® upgrade
What happened
After ClickHouse® upgrade from version pre 21.6 to version after 21.6, count of unique UUID in AggregatingMergeTree tables nearly doubled in case of merging of data which was generated in different ClickHouse versions.
Why happened
In pull request
which changed the internal representation of big integers data types (and UUID).
SipHash64 hash-function used for uniq aggregation function for UUID data type was replaced with intHash64, which leads to different result for the same UUID value across different ClickHouse versions.
Therefore, it results in doubling of counts, when uniqState created by different ClickHouse versions being merged together.
You need to replace any occurrence of uniqState(uuid) in MATERIALIZED VIEWs with uniqState(sipHash64(uuid)) and change data type for already saved data from AggregateFunction(uniq, UUID) to AggregateFunction(uniq, UInt64), because result data type of sipHash64 is UInt64.
-- On ClickHouse version 21.3
CREATETABLEuniq_state(`key`UInt32,`value`AggregateFunction(uniq,UUID))ENGINE=MergeTreeORDERBYkeyINSERTINTOuniq_stateSELECTnumber%10000ASkey,uniqState(reinterpretAsUUID(number))FROMnumbers(1000000)GROUPBYkeyOk.0rowsinset.Elapsed:0.404sec.Processed1.05millionrows,8.38MB(2.59millionrows/s.,20.74MB/s.)SELECTkey%20,uniqMerge(value)FROMuniq_stateGROUPBYkey%20┌─modulo(key,20)─┬─uniqMerge(value)─┐│0│50000││1│50000││2│50000││3│50000││4│50000││5│50000││6│49999││7│50000││8│49999││9│50000││10│50000││11│50000││12│50000││13│50000││14│50000││15│50000││16│50000││17│50000││18│50000││19│50000│└─────────────────┴──────────────────┘-- After upgrade of ClickHouse to 21.8
SELECTkey%20,uniqMerge(value)FROMuniq_stateGROUPBYkey%20┌─modulo(key,20)─┬─uniqMerge(value)─┐│0│50000││1│50000││2│50000││3│50000││4│50000││5│50000││6│49999││7│50000││8│49999││9│50000││10│50000││11│50000││12│50000││13│50000││14│50000││15│50000││16│50000││17│50000││18│50000││19│50000│└─────────────────┴──────────────────┘20rowsinset.Elapsed:0.240sec.Processed10.00thousandrows,1.16MB(41.72thousandrows/s.,4.86MB/s.)CREATETABLEuniq_state_2ENGINE=MergeTreeORDERBYkeyASSELECT*FROMuniq_stateOk.0rowsinset.Elapsed:0.128sec.Processed10.00thousandrows,1.16MB(78.30thousandrows/s.,9.12MB/s.)INSERTINTOuniq_state_2SELECTnumber%10000ASkey,uniqState(reinterpretAsUUID(number))FROMnumbers(1000000)GROUPBYkeyOk.0rowsinset.Elapsed:0.266sec.Processed1.05millionrows,8.38MB(3.93millionrows/s.,31.48MB/s.)SELECTkey%20,uniqMerge(value)FROMuniq_state_2GROUPBYkey%20┌─modulo(key,20)─┬─uniqMerge(value)─┐│0│99834│<-Countofuniquevaluesnearlydoubled.│1│100219││2│100128││3│100457││4│100272││5│100279││6│99372││7│99450││8│99974││9│99632││10│99562││11│100660││12│100439││13│100252││14│100650││15│99320││16│100095││17│99632││18│99540││19│100098│└─────────────────┴──────────────────┘20rowsinset.Elapsed:0.356sec.Processed20.00thousandrows,2.33MB(56.18thousandrows/s.,6.54MB/s.)CREATETABLEuniq_state_3ENGINE=MergeTreeORDERBYkeyASSELECT*FROMuniq_state0rowsinset.Elapsed:0.126sec.Processed10.00thousandrows,1.16MB(79.33thousandrows/s.,9.24MB/s.)-- Option 1, create separate column
ALTERTABLEuniq_state_3ADDCOLUMN`value_2`AggregateFunction(uniq,UInt64)DEFAULTunhex(hex(value));ALTERTABLEuniq_state_3UPDATEvalue_2=value_2WHERE1;SELECT*FROMsystem.mutationsWHEREis_done=0;Ok.0rowsinset.Elapsed:0.008sec.INSERTINTOuniq_state_3(key,value_2)SELECTnumber%10000ASkey,uniqState(sipHash64(reinterpretAsUUID(number)))FROMnumbers(1000000)GROUPBYkeyOk.0rowsinset.Elapsed:0.337sec.Processed1.05millionrows,8.38MB(3.11millionrows/s.,24.89MB/s.)SELECTkey%20,uniqMerge(value),uniqMerge(value_2)FROMuniq_state_3GROUPBYkey%20┌─modulo(key,20)─┬─uniqMerge(value)─┬─uniqMerge(value_2)─┐│0│50000│50000││1│50000│50000││2│50000│50000││3│50000│50000││4│50000│50000││5│50000│50000││6│49999│49999││7│50000│50000││8│49999│49999││9│50000│50000││10│50000│50000││11│50000│50000││12│50000│50000││13│50000│50000││14│50000│50000││15│50000│50000││16│50000│50000││17│50000│50000││18│50000│50000││19│50000│50000│└─────────────────┴──────────────────┴────────────────────┘20rowsinset.Elapsed:0.768sec.Processed20.00thousandrows,4.58MB(26.03thousandrows/s.,5.96MB/s.)-- Option 2, modify column in-place with String as intermediate data type.
ALTERTABLEuniq_state_3MODIFYCOLUMN`value`StringOk.0rowsinset.Elapsed:0.280sec.ALTERTABLEuniq_state_3MODIFYCOLUMN`value`AggregateFunction(uniq,UInt64)Ok.0rowsinset.Elapsed:0.254sec.INSERTINTOuniq_state_3(key,value)SELECTnumber%10000ASkey,uniqState(sipHash64(reinterpretAsUUID(number)))FROMnumbers(1000000)GROUPBYkeyOk.0rowsinset.Elapsed:0.554sec.Processed1.05millionrows,8.38MB(1.89millionrows/s.,15.15MB/s.)SELECTkey%20,uniqMerge(value),uniqMerge(value_2)FROMuniq_state_3GROUPBYkey%20┌─modulo(key,20)─┬─uniqMerge(value)─┬─uniqMerge(value_2)─┐│0│50000│50000││1│50000│50000││2│50000│50000││3│50000│50000││4│50000│50000││5│50000│50000││6│49999│49999││7│50000│50000││8│49999│49999││9│50000│50000││10│50000│50000││11│50000│50000││12│50000│50000││13│50000│50000││14│50000│50000││15│50000│50000││16│50000│50000││17│50000│50000││18│50000│50000││19│50000│50000│└─────────────────┴──────────────────┴────────────────────┘20rowsinset.Elapsed:0.589sec.Processed30.00thousandrows,6.87MB(50.93thousandrows/s.,11.66MB/s.)SHOWCREATETABLEuniq_state_3;CREATETABLEdefault.uniq_state_3(`key`UInt32,`value`AggregateFunction(uniq,UInt64),`value_2`AggregateFunction(uniq,UInt64)DEFAULTunhex(hex(value)))ENGINE=MergeTreeORDERBYkeySETTINGSindex_granularity=8192-- Option 3, CAST uniqState(UInt64) to String.
CREATETABLEuniq_state_4ENGINE=MergeTreeORDERBYkeyASSELECT*FROMuniq_stateOk.0rowsinset.Elapsed:0.146sec.Processed10.00thousandrows,1.16MB(68.50thousandrows/s.,7.98MB/s.)INSERTINTOuniq_state_4(key,value)SELECTnumber%10000ASkey,CAST(uniqState(sipHash64(reinterpretAsUUID(number))),'String')FROMnumbers(1000000)GROUPBYkeyOk.0rowsinset.Elapsed:0.476sec.Processed1.05millionrows,8.38MB(2.20millionrows/s.,17.63MB/s.)SELECTkey%20,uniqMerge(value)FROMuniq_state_4GROUPBYkey%20┌─modulo(key,20)─┬─uniqMerge(value)─┐│0│50000││1│50000││2│50000││3│50000││4│50000││5│50000││6│49999││7│50000││8│49999││9│50000││10│50000││11│50000││12│50000││13│50000││14│50000││15│50000││16│50000││17│50000││18│50000││19│50000│└─────────────────┴──────────────────┘20rowsinset.Elapsed:0.281sec.Processed20.00thousandrows,2.33MB(71.04thousandrows/s.,8.27MB/s.)SHOWCREATETABLEuniq_state_4;CREATETABLEdefault.uniq_state_4(`key`UInt32,`value`AggregateFunction(uniq,UUID))ENGINE=MergeTreeORDERBYkeySETTINGSindex_granularity=8192
5.3 - Can not connect to my ClickHouse® server
Can not connect to my ClickHouse® server.
Can not connect to my ClickHouse® server
Errors like
“Connection reset by peer, while reading from socket”
Ensure that the clickhouse-server is running
systemctl status clickhouse-server
If server was restarted recently and don’t accept the connections after the restart - most probably it still just starting.
During the startup sequence it need to iterate over all data folders in /var/lib/clickhouse-server
In case if you have a very high number of folders there (usually caused by a wrong partitioning, or a very high number of tables / databases)
that startup time can take a lot of time (same can happen if disk is very slow, for example NFS).
You can check that by looking for ‘Ready for connections’ line in /var/log/clickhouse-server/clickhouse-server.log (Information log level needed)
Ensure you use the proper port ip / interface?
Ensure you’re not trying to connect to secure port without tls / https or vice versa.
For clickhouse-client - pay attention on host / port / secure flags.
Ensure the interface you’re connecting to is the one which ClickHouse listens (by default ClickHouse listens only localhost).
Note: If you uncomment line <listen_host>0.0.0.0</listen_host> only - ClickHouse will listen only ipv4 interfaces,
while the localhost (used by clickhouse-client) may be resolved to ipv6 address. And clickhouse-client may be failing to connect.
How to check which interfaces / ports do ClickHouse listen?
ensure that server uses some certificate which can be validated by the client
OR disable certificate checks on the client (UNSECURE)
Check for errors in /var/log/clickhouse-server/clickhouse-server.err.log ?
Is ClickHouse able to serve some trivial tcp / http requests from localhost?
curl 127.0.0.1:9200
curl 127.0.0.1:8123
Check number of sockets opened by ClickHouse
sudo lsof -i -a -p $(pidof clickhouse-server)# or (adjust 9000 / 8123 ports if needed)netstat -tn 2>/dev/null | tail -n +3 | awk '{ printf("%s\t%s\t%s\t%s\t%s\t%s\n", $1, $2, $3, $4, $5, $6) }'| clickhouse-local -S "Proto String, RecvQ Int64, SendQ Int64, LocalAddress String, ForeignAddress String, State LowCardinality(String)" --query="SELECT * FROM table WHERE LocalAddress like '%:9000' FORMAT PrettyCompact"netstat -tn 2>/dev/null | tail -n +3 | awk '{ printf("%s\t%s\t%s\t%s\t%s\t%s\n", $1, $2, $3, $4, $5, $6) }'| clickhouse-local -S "Proto String, RecvQ Int64, SendQ Int64, LocalAddress String, ForeignAddress String, State LowCardinality(String)" --query="SELECT * FROM table WHERE LocalAddress like '%:8123' FORMAT PrettyCompact"
ClickHouse has a limit of number of open connections (4000 by default).
Check also:
# system overall support limited number of connections it can handlenetstat
# you can also be reaching of of the process ulimits (Max open files)cat /proc/$(pidof -s clickhouse-server)/limits
Check firewall / selinux rules (if used)
5.4 - cgroups and kubernetes cloud providers
cgroups and kubernetes cloud providers.
Why my ClickHouse® is slow after upgrade to version 22.2 and higher?
The probable reason is that ClickHouse 22.2 started to respect cgroups (Respect cgroups limits in max_threads autodetection. #33342
(JaySon
).
This makes ClickHouse to execute all queries with a single thread (normal behavior is half of available CPU cores, cores = 64, then ‘auto(32)’).
We observe this cgroups behavior with AWS EKS (Kubernetes) environment and Altinity
ClickHouse Operator
in case if requests.cpu and limits.cpu are not set for a resource.
Workaround
We suggest to set requests.cpu = half of available CPU cores, and limits.cpu = CPU cores.
5.5 - Transforming ClickHouse logs to ndjson using Vector.dev
Transforming ClickHouse logs to ndjson using Vector.dev
ClickHouse 22.8
Starting from 22.8 version, ClickHouse support writing logs in JSON format:
<?xml version="1.0"?>
<clickhouse>
<logger>
<!-- Structured log formatting:
You can specify log format(for now, JSON only). In that case, the console log will be printed
in specified format like JSON.
For example, as below:
{"date_time":"1650918987.180175","thread_name":"#1","thread_id":"254545","level":"Trace","query_id":"","logger_name":"BaseDaemon","message":"Received signal 2","source_file":"../base/daemon/BaseDaemon.cpp; virtual void SignalListener::run()","source_line":"192"}
To enable JSON logging support, just uncomment <formatting> tag below.
-->
<formatting>json</formatting>
</logger>
</clickhouse>
Transforming ClickHouse logs to ndjson using Vector.dev"
In general ClickHouse® should work with any POSIX-compatible filesystem.
hard links and soft links support is mandatory.
ClickHouse can use O_DIRECT mode to bypass the cache (and async io)
ClickHouse can use renameat2 command for some atomic operations (not all the filesystems support that).
depending on the schema and details of the usage the filesystem load can vary between the setup. The most natural load - is high throughput, with low or moderate IOPS.
data is compressed in ClickHouse (LZ4 by default), while indexes / marks / metadata files - no. Enabling disk-level compression can sometimes improve the compression, but can affect read / write speed.
ext4
no issues, fully supported.
The minimum kernel version required is 3.15 (newer are recommended)
XFS
Performance issues reported by users, use on own risk. Old kernels are not recommended (4.0 or newer is recommended).
According to the users’ feedback, XFS behaves worse with ClickHouse under heavy load.
We don’t have real proofs/benchmarks though, example reports:
Recently my colleague discovered that two of ClickHouse servers perform worse in a cluster than
others and they found that they accidentally set up those servers with XFS instead of Ext4.
system goes to 99% io kernel under load sometimes.
we have XFS, sometimes ClickHouse goes to “sleep” because XFS daemon is doing smth unknown
Maybe the above problem can be workaround by some tuning/settings, but so far we do not have a working and confirmed way to do this.
ZFS
Limitations exist, extra tuning may be needed, and having more RAM is recommended. Old kernels are not recommended.
Memory usage control - ZFS adaptive replacement cache (ARC) can take a lot of RAM. It can be the reason of out-of-memory issues when memory is also requested by the ClickHouse.
It seems that the most important thing is zfs_arc_max - you just need to limit the maximum size of the ARC so that the sum of the maximum size of the arc + the CH itself does not exceed the size of the available RAM. For example, we set a limit of 80% RAM for ClickHouse and 10% for ARC. 10% will remain for the system and other applications
examples of tuning ZFS for MySQL https://wiki.freebsd.org/ZFSTuningGuide
- perhaps some of this can also be useful (atime, recordsize) but everything needs to be carefully checked with benchmarks (I have no way).
important note: In versions before 2.2 ZFS does not support the renameat2 command, which is used by the Atomic database engine, and
therefore some of the Atomic functionality will not be available.
In old versions of ClickHouse, you can face issues with the O_DIRECT mode.
Also there is a well-known (and controversial) Linus Torvalds opinion: “Don’t Use ZFS on Linux” [1]
, [2]
, [3]
.
BTRFS
Not enough information. Some users report
performance improvement for their use case.
ReiserFS
Not enough information.
Lustre
There are reports that some people successfully use it in their setups.
A fast network is required.
There were some reports about data damage on the disks on older ClickHouse versions, which could be caused by the issues with O_DIRECT or async io support
on Lustre.
NFS (and EFS)
According to the reports - it works, throughput depends a lot on the network speed. IOPS / number of file operations per seconds can be super low (due to the locking mechanism).
<clickhouse><users><default> ....
</default><admin><!--
Password could be specified in plaintext or in SHA256 (in hex format).
If you want to specify password in plaintext (not recommended), place it in 'password' element.
Example: <password>qwerty</password>.
Password could be empty.
If you want to specify SHA256, place it in 'password_sha256_hex' element.
Example: <password_sha256_hex>65e84be33532fb784c48129675f9eff3a682b27168c0ea744b2cf58ee02337c5</password_sha256_hex>
Restrictions of SHA256: impossibility to connect to ClickHouse using MySQL JS client (as of July 2019).
If you want to specify double SHA1, place it in 'password_double_sha1_hex' element.
Example: <password_double_sha1_hex>e395796d6546b1b65db9d665cd43f0e858dd4303</password_double_sha1_hex>
--><password></password><networks><ip>::/0</ip></networks><!-- Settings profile for user. --><profile>default</profile><!-- Quota for user. --><quota>default</quota><!-- Set This parameter to Enable RBAC
Admin user can create other users and grant rights to them. --><access_management>1</access_management></admin>...
</clickhouse>
default user
As default is used for many internal and background operations, so it is not convenient to set it up with a password, because you would have to change it in many configs/parts. Best way to secure the default user is only allow localhost or trusted network connections like this in users.xml:
The replication user is defined by interserver_http_credential tag. It does not relate to a ClickHouse client credentials configuration. If this tag is ommited then authentication is not used during replication. Ports 9009 and 9010(tls) provide low-level data access between servers. This ports should not be accessible from untrusted networks. You can specify credentials for authentication between replicas. This is required when interserver_https_port is accessible from untrusted networks. You can do so by defining user and password to the interserver credentials. Then replication protocol will use basic access authentication when connecting by HTTP/HTTPS to other replicas:
Now we can setup users/roles using a generic best-practice approach for RBAC from other databases, like using roles, granting permissions to roles, creating users for different applications, etc…
createroledbaoncluster'{cluster}';grantallon*.*todbaoncluster'{cluster}';createuser`user1`identifiedby'pass1234'oncluster'{cluster}';grantdbatouser1oncluster'{cluster}';createroledashboard_rooncluster'{cluster}';grantselectondefault.*todashboard_rooncluster'{cluster}';grantdictGeton*.*todashboard_rooncluster'{cluster}';createsettingsprofileorreplaceprofile_dashboard_rooncluster'{cluster}'settingsmax_concurrent_queries_for_user=10READONLY,max_threads=16READONLY,max_memory_usage_for_user='30G'READONLY,max_memory_usage='30G'READONLY,max_execution_time=60READONLY,max_rows_to_read=1000000000READONLY,max_bytes_to_read='5000G'READONLYTOdashboard_ro;createuser`dash1`identifiedby'pass1234'oncluster'{cluster}';grantdashboard_rotodash1oncluster'{cluster}';createroleingester_rwoncluster'{cluster}';grantselect,insertondefault.*toingester_rwoncluster'{cluster}';createsettingsprofileorreplaceprofile_ingester_rwoncluster'{cluster}'settingsmax_concurrent_queries_for_user=40READONLY,-- user can run 40 queries (select, insert ...) simultaneously
max_threads=10READONLY,-- each query can use up to 10 cpu (READONLY means user cannot override a value)
max_memory_usage_for_user='30G'READONLY,-- all queries of the user can use up to 30G RAM
max_memory_usage='25G'READONLY,-- each query can use up to 25G RAM
max_execution_time=200READONLY,-- each query can executes no longer 200 seconds
max_rows_to_read=1000000000READONLY,-- each query can read up to 1 billion rows
max_bytes_to_read='5000G'READONLY-- each query can read up to 5 TB from a MergeTree
TOingester_rw;createuser`ingester_app1`identifiedby'pass1234'oncluster'{cluster}';grantingester_rwtoingester_app1oncluster'{cluster}';
check
$ clickhouse-client -u dash1 --password pass1234
create table test( A Int64)Engine=Log; DB::Exception: dash1: Not enough privileges
$ clickhouse-client -u user1 --password pass1234
create table test( A Int64)Engine=Log;Ok.
drop table test;Ok.
$ clickhouse-client -u ingester_app1 --password pass1234
select count() from system.numbers limit 1000000000000; DB::Exception: Received from localhost:9000. DB::Exception: Limit for rows or bytes to read exceeded, max rows: 1.00 billion
Timeout settings are related to the client, server, and network. They can be tuned to solve sporadic timeout issues.
It’s important to understand that network devices (routers, NATs, load balancers ) could have their own timeouts. Sometimes, they won’t respect TCP keep-alive and close the session due to inactivity. Only application-level keepalives could prevent TCP sessions from closing.
Below are the settings that will work only if you set them in the default user profile. The problem is that they should be applied before the connection happens. And if you send them with a query/connection, it’s already too late:
send_progress_in_http_headers will not be applied in this way because here we can configure the JDBC driver’s client options only (this
), but there is an option called custom_settings (this
) that will apply custom ch query settings for every query before the actual connection is created. The correct JDBC connection string will look like this:
http_send_timeout & send_timeout: The timeout for sending data to the socket. If the server takes longer than this value to send data, the connection will be terminated (i.e., when the server pushes data to the client, and the client is not reading that for some reason).
http_receive_timeout & receive_timeout: The timeout for receiving data from the socket. If the server takes longer than this value to receive the entire request from the client, the connection will be terminated. This setting ensures that the server is not kept waiting indefinitely for slow or unresponsive clients (i.e., the server tries to get some data from the client, but the client does not send anything).
http_connection_timeout & connect_timeout: Defines how long ClickHouse should wait when it connects to another server. If the connection cannot be established within this time frame, it will be terminated. This does not impact the clients which connect to ClickHouse using HTTP (it only matters when ClickHouse works as a TCP/HTTP client).
keep_alive_timeout: This is for ‘Connection: keep-alive’ in HTTP 1.1, only for HTTP. It defines how long ClickHouse can wait for the next request in the same connection to arrive after serving the previous one. It does not lead to any SOCKET_TIMEOUT exception, just closes the socket if the client doesn’t start a new request after that time.
sync_request_timeout – timeout for server ping. Defaults to 5 seconds.
In some cases, if the data sync request time out, it may be caused by many different reasons, basically it shouldn’t take more than 5 seconds for synchronous request-result protocol call (like Ping or TableStatus) in most of the normal circumstances, thus if time out setting too long, eg. 5 minutes or longer than that, then you will run into more overall performance issues. This is not good for any application on the server.
5.10 - Compatibility layer for the Altinity Kubernetes Operator for ClickHouse®
Page description for heading and indexes.
It’s possible to expose clickhouse-server metrics in the style used by the Altinity Kubernetes Operator for ClickHouse®. It’s for the clickhouse-operator grafana dashboard.
CREATEVIEWsystem.operator_compatible_metrics(`name`String,`value`Float64,`help`String,`labels`Map(String,String),`type`String)ASSELECTconcat('chi_clickhouse_event_',event)ASname,CAST(value,'Float64')ASvalue,descriptionAShelp,map('hostname',hostName())ASlabels,'counter'AStypeFROMsystem.eventsUNIONALLSELECTconcat('chi_clickhouse_metric_',metric)ASname,CAST(value,'Float64')ASvalue,descriptionAShelp,map('hostname',hostName())ASlabels,'gauge'AStypeFROMsystem.metricsUNIONALLSELECTconcat('chi_clickhouse_metric_',metric)ASname,value,''AShelp,map('hostname',hostName())ASlabels,'gauge'AStypeFROMsystem.asynchronous_metricsUNIONALLSELECT'chi_clickhouse_metric_MemoryDictionaryBytesAllocated'ASname,CAST(sum(bytes_allocated),'Float64')ASvalue,'Memory size allocated for dictionaries'AShelp,map('hostname',hostName())ASlabels,'gauge'AStypeFROMsystem.dictionariesUNIONALLSELECT'chi_clickhouse_metric_LongestRunningQuery'ASname,CAST(max(elapsed),'Float64')ASvalue,'Longest running query time'AShelp,map('hostname',hostName())ASlabels,'gauge'AStypeFROMsystem.processesUNIONALLWITH['chi_clickhouse_table_partitions','chi_clickhouse_table_parts','chi_clickhouse_table_parts_bytes','chi_clickhouse_table_parts_bytes_uncompressed','chi_clickhouse_table_parts_rows','chi_clickhouse_metric_DiskDataBytes','chi_clickhouse_metric_MemoryPrimaryKeyBytesAllocated']ASnames,[uniq(partition),count(),sum(bytes),sum(data_uncompressed_bytes),sum(rows),sum(bytes_on_disk),sum(primary_key_bytes_in_memory_allocated)]ASvalues,arrayJoin(arrayZip(names,values))AStplSELECTtpl.1ASname,CAST(tpl.2,'Float64')ASvalue,''AShelp,map('database',database,'table',table,'active',toString(active),'hostname',hostName())ASlabels,'gauge'AStypeFROMsystem.partsGROUPBYactive,database,tableUNIONALLWITH['chi_clickhouse_table_mutations','chi_clickhouse_table_mutations_parts_to_do']ASnames,[CAST(count(),'Float64'),CAST(sum(parts_to_do),'Float64')]ASvalues,arrayJoin(arrayZip(names,values))AStplSELECTtpl.1ASname,tpl.2ASvalue,''AShelp,map('database',database,'table',table,'hostname',hostName())ASlabels,'gauge'AStypeFROMsystem.mutationsWHEREis_done=0GROUPBYdatabase,tableUNIONALLWITHif(coalesce(reason,'unknown')='','detached_by_user',coalesce(reason,'unknown'))ASdetach_reasonSELECT'chi_clickhouse_metric_DetachedParts'ASname,CAST(count(),'Float64')ASvalue,''AShelp,map('database',database,'table',table,'disk',disk,'hostname',hostName())ASlabels,'gauge'AStypeFROMsystem.detached_partsGROUPBYdatabase,table,disk,reasonORDERBYnameASC
curl http://localhost:8123/metrics
# HELP chi_clickhouse_metric_Query Number of executing queries# TYPE chi_clickhouse_metric_Query gaugechi_clickhouse_metric_Query{hostname="LAPTOP"}1# HELP chi_clickhouse_metric_Merge Number of executing background merges# TYPE chi_clickhouse_metric_Merge gaugechi_clickhouse_metric_Merge{hostname="LAPTOP"}0# HELP chi_clickhouse_metric_PartMutation Number of mutations (ALTER DELETE/UPDATE)# TYPE chi_clickhouse_metric_PartMutation gaugechi_clickhouse_metric_PartMutation{hostname="LAPTOP"}0
5.11 - How to convert uniqExact states to approximate uniq functions states
A way to convert to uniqExactState to other uniqStates (like uniqCombinedState) in ClickHouse®
uniqExactState
uniqExactState is stored in two parts: a count of values in LEB128 format + list values without a delimiter.
Depending on the orignial datatype of the values to count, the datatype of the list values differ.
Numeric Values
In case of numeric values like UInt8, UInt64 etc. the representation of uniqExactState is just a simple array of the unique values encountered.
Therefore it is easy to recover the values from the state which have appeared:
In case of values of data type String, ClickHouse® applies a hashing algorithm before storing the values into the internal array, otherwise the amount of space needed could get enormous.
So, our task is to find how we can generate such values by ourself, speak what hash function is used.
In case of String data type, it is just the simple sipHash128 function.
The second task: now that we know how the state is formed, how can we demangle it and convert it into an Array of values.
Unfortunatelly it is not possible to get the original values back, as sipHash128 is a one way conversion, but at least we can try to get an Array of hashes.
Luckily for us, ClickHouse® use the exact same serialization (LEB128 + list of values) for Arrays (in this case if uniqExactState and Array are serialized into RowBinary format).
One way to “convert” the uniqExactState to an Array of hashes would be via an external helper
UDF function to do that conversion:
This way only works if you have direct access to your ClickHouse® installation.
However if you are on a managed platform like Altinity.Cloud installing executable UDFs is typically not supported for security reasons.
Luckily we know that the internal representation of sipHash128 is FixedString(16) which has exactly 128 bit. UInt128 also takes up exactly 128 bit.
Therefore we can consider the uniqExactState(String) as a representation of Array(UInt128).
Again, we can therefore convert our state to an Array:
As you can see the Array is identical to the one we created with the pipe function.
Full Example of Conversion
And here is the full example, how you can convert uniqExactState(string) to any approximate uniq function like uniqState(string) or uniqCombinedState(string) by reinterpret and arrayReduce('func', [..]).
-- Generate demo with random data, uniqs are stored as heavy uniqExact
CREATETABLEaggregates(`id`UInt32,`uniqExact`AggregateFunction(uniqExact,String))ENGINE=AggregatingMergeTreeORDERBYidasSELECTnumber%10000ASid,uniqExactState(toString(number))FROMnumbers(10000000)GROUPBYid;0rowsinset.Elapsed:2.042sec.Processed10.01millionrows,80.06MB(4.90millionrows/s.,39.21MB/s.)-- Let's add a new columns to store optimized, approximate uniq & uniqCombined
ALTERTABLEaggregatesADDCOLUMN`uniq`AggregateFunction(uniq,FixedString(16)),ADDCOLUMN`uniqCombined`AggregateFunction(uniqCombined,FixedString(16));-- Materialize values in the new columns
ALTERTABLEaggregatesUPDATEuniqCombined=arrayReduce('uniqCombinedState',arrayMap(x->reinterpretAsFixedString(x),finalizeAggregation(unhex(hex(uniqExact))::AggregateFunction(groupArray,UInt128)))),uniq=arrayReduce('uniqState',arrayMap(x->reinterpretAsFixedString(x),finalizeAggregation(unhex(hex(uniqExact))::AggregateFunction(groupArray,UInt128))))WHERE1SETTINGSmutations_sync=2;-- Check results, results are slighty different, because uniq & uniqCombined are approximate functions
SELECTid%20ASkey,uniqExactMerge(uniqExact),uniqCombinedMerge(uniqCombined),uniqMerge(uniq)FROMaggregatesGROUPBYkey┌─key─┬─uniqExactMerge(uniqExact)─┬─uniqCombinedMerge(uniqCombined)─┬─uniqMerge(uniq)─┐│0│500000│500195│500455││1│500000│502599│501549││2│500000│498058│504428││3│500000│499748│500195││4│500000│500791│500836││5│500000│502430│497558││6│500000│500262│501785││7│500000│501514│495758││8│500000│500121│498597││9│500000│502173│500455││10│500000│499144│498386││11│500000│500525│503139││12│500000│503624│497103││13│500000│499986│497992││14│500000│502027│494833││15│500000│498831│500983││16│500000│501103│500836││17│500000│499409│496791││18│500000│501641│502991││19│500000│500648│500881│└─────┴───────────────────────────┴─────────────────────────────────┴─────────────────┘20rowsinset.Elapsed:2.312sec.Processed10.00thousandrows,7.61MB(4.33thousandrows/s.,3.29MB/s.)
Now, lets repeat the same insert, but in that case we will also populate uniq & uniqCombined with values converted via sipHash128 function.
If we did everything right, uniq counts will not change, because we inserted the exact same values.
You can not use the custom settings in config file ‘as is’, because ClickHouse® don’t know which datatype should be used to parse it.
cat /etc/clickhouse-server/users.d/default_profile.xml
<?xml version="1.0"?><yandex><profiles><default><custom_data_version>1</custom_data_version><!-- will not work! see below --></default></profiles></yandex>
That will end up with the following error:
2021.09.24 12:50:37.369259 [ 264905 ] {} <Error> ConfigReloader: Error updating configuration from '/etc/clickhouse-server/users.xml' config.: Code: 536. DB::Exception: Couldn't restore Field from dump: 1: while parsing value '1' for setting 'custom_data_version'. (CANNOT_RESTORE_FROM_FIELD_DUMP), Stack trace (when copying this message, always include the lines below):
0. DB::Exception::Exception(std::__1::basic_string<char, std::__1::char_traits<char>, std::__1::allocator<char> > const&, int, bool) @ 0x9440eba in /usr/lib/debug/.build-id/ba/25f6646c3be7aa95f452ec85461e96178aa365.debug
1. DB::Field::restoreFromDump(std::__1::basic_string_view<char, std::__1::char_traits<char> > const&)::$_4::operator()() const @ 0x10449da0 in /usr/lib/debug/.build-id/ba/25f6646c3be7aa95f452ec85461e96178aa365.debug
2. DB::Field::restoreFromDump(std::__1::basic_string_view<char, std::__1::char_traits<char> > const&) @ 0x10449bf1 in /usr/lib/debug/.build-id/ba/25f6646c3be7aa95f452ec85461e96178aa365.debug
3. DB::BaseSettings<DB::SettingsTraits>::stringToValueUtil(std::__1::basic_string_view<char, std::__1::char_traits<char> > const&, std::__1::basic_string<char, std::__1::char_traits<char>, std::__1::allocator<char> > const&) @ 0x1042e2bf in /usr/lib/debug/.build-id/ba/25f6646c3be7aa95f452ec85461e96178aa365.debug
4. DB::UsersConfigAccessStorage::parseFromConfig(Poco::Util::AbstractConfiguration const&) @ 0x1041a097 in /usr/lib/debug/.build-id/ba/25f6646c3be7aa95f452ec85461e96178aa365.debug
5. void std::__1::__function::__policy_invoker<void (Poco::AutoPtr<Poco::Util::AbstractConfiguration>, bool)>::__call_impl<std::__1::__function::__default_alloc_func<DB::UsersConfigAccessStorage::load(std::__1::basic_string<char, std::__1::char_traits<char>, std::__1::allocator<char> > const&, std::__1::basic_string<char, std::__1::char_traits<char>, std::__1::allocator<char> > const&, std::__1::basic_string<char, std::__1::char_traits<char>, std::__1::allocator<char> > const&, std::__1::function<std::__1::shared_ptr<zkutil::ZooKeeper> ()> const&)::$_0, void (Poco::AutoPtr<Poco::Util::AbstractConfiguration>, bool)> >(std::__1::__function::__policy_storage const*, Poco::AutoPtr<Poco::Util::AbstractConfiguration>&&, bool) @ 0x1042e7ff in /usr/lib/debug/.build-id/ba/25f6646c3be7aa95f452ec85461e96178aa365.debug
6. DB::ConfigReloader::reloadIfNewer(bool, bool, bool, bool) @ 0x11caf54e in /usr/lib/debug/.build-id/ba/25f6646c3be7aa95f452ec85461e96178aa365.debug
7. DB::ConfigReloader::run() @ 0x11cb0f8f in /usr/lib/debug/.build-id/ba/25f6646c3be7aa95f452ec85461e96178aa365.debug
8. ThreadFromGlobalPool::ThreadFromGlobalPool<void (DB::ConfigReloader::*)(), DB::ConfigReloader*>(void (DB::ConfigReloader::*&&)(), DB::ConfigReloader*&&)::'lambda'()::operator()() @ 0x11cb19f1 in /usr/lib/debug/.build-id/ba/25f6646c3be7aa95f452ec85461e96178aa365.debug
9. ThreadPoolImpl<std::__1::thread>::worker(std::__1::__list_iterator<std::__1::thread, void*>) @ 0x9481f5f in /usr/lib/debug/.build-id/ba/25f6646c3be7aa95f452ec85461e96178aa365.debug
10. void* std::__1::__thread_proxy<std::__1::tuple<std::__1::unique_ptr<std::__1::__thread_struct, std::__1::default_delete<std::__1::__thread_struct> >, void ThreadPoolImpl<std::__1::thread>::scheduleImpl<void>(std::__1::function<void ()>, int, std::__1::optional<unsigned long>)::'lambda0'()> >(void*) @ 0x9485843 in /usr/lib/debug/.build-id/ba/25f6646c3be7aa95f452ec85461e96178aa365.debug
11. start_thread @ 0x9609 in /usr/lib/x86_64-linux-gnu/libpthread-2.31.so
12. __clone @ 0x122293 in /usr/lib/x86_64-linux-gnu/libc-2.31.so
(version 21.10.1.8002 (official build))
2021.09.29 11:36:07.722213 [ 2090 ] {} <Error> Application: DB::Exception: Couldn't restore Field from dump: 1: while parsing value '1' for setting 'custom_data_version'
To make it work you need to change it an the following way:
CompiledExpressionCacheCount -- number or compiled cached expression (if CompiledExpressionCache is enabled)
jemalloc -- parameters of jemalloc allocator, they are not very useful, and not interesting
MarkCacheBytes / MarkCacheFiles -- there are cache for .mrk files (default size is 5GB), you can see is it use all 5GB or not
MemoryCode -- how much memory allocated for ClickHouse® executable
MemoryDataAndStack -- virtual memory allocated for data and stack
MemoryResident -- real memory used by ClickHouse ( the same as top RES/RSS)
MemoryShared -- shared memory used by ClickHouse
MemoryVirtual -- virtual memory used by ClickHouse ( the same as top VIRT)
NumberOfDatabases
NumberOfTables
ReplicasMaxAbsoluteDelay -- important parameter - replica max absolute delay in seconds
ReplicasMaxRelativeDelay -- replica max relative delay (from other replicas) in seconds
ReplicasMaxInsertsInQueue -- max number of parts to fetch for a single Replicated table
ReplicasSumInsertsInQueue -- sum of parts to fetch for all Replicated tables
ReplicasMaxMergesInQueue -- max number of merges in queue for a single Replicated table
ReplicasSumMergesInQueue -- total number of merges in queue for all Replicated tables
ReplicasMaxQueueSize -- max number of tasks for a single Replicated table
ReplicasSumQueueSize -- total number of tasks in replication queue
UncompressedCacheBytes/UncompressedCacheCells -- allocated memory for uncompressed cache (disabled by default)
Uptime -- uptime seconds
5.14 - ClickHouse® data/disk encryption (at rest)
Example how to encrypt data in tables using storage policies.
Disaster Recovery configuration between two data centers
Clickhouse uses Keeper (or ZooKeeper) to inform other cluster nodes about changes. Clickhouse nodes then fetch new parts directly from other nodes in the cluster. The Keeper cluster is a key for building a DR schema. You can consider Keeper a “true” cluster while clickhouse-server nodes as storage access instruments.
To implement a disaster recovery (DR) setup for ClickHouse across two physically separated data centers (A and B), with only one side active at a time, you can create a single ClickHouse cluster spanning both data centers. This setup will address data synchronization, replication, and coordination needs.
Cluster Configuration
Create a single ClickHouse cluster with nodes in both data centers.
Configure the appropriate number of replicas and shards based on your performance and redundancy requirements.
Use ClickHouse Keeper or ZooKeeper for cluster coordination (see Keeper flavors discussion below).
Data Synchronization and Replication
ClickHouse replicas operate in a master-master configuration, eliminating the need for a separate slave approach.
Configure replicas across both data centers to ensure data synchronization.
While both DCs have active replicas, consider DC B replicas as “passive” from the application’s perspective.
Example Configuration:
<remote_servers><company_cluster><shard><replica><host>ch1.dc-a.company.com</host></replica><replica><host>ch2.dc-a.company.com</host></replica><replica><host>ch1.dc-b.company.com</host></replica><replica><host>ch2.dc-b.company.com</host></replica></shard><!-- Add more shards as needed --></company_cluster></remote_servers>
Keeper Setup
In the active data center (DC A):
Deploy 3 active Keeper nodes
In the passive data center (DC B):
Deploy 1 Keeper node in observer role
Failover Process:
In case of a failover:
Shut down the ClickHouse cluster in DC A completely
Manually switch Keeper in DC B from observer to active participant (restart needed).
Create two additional Keeper nodes (they will replicate the state automatically).
Add two additional Keeper nodes to clickhouse configs
ClickHouse Keeper vs. ZooKeeper
While ClickHouse Keeper is generally preferable for very high-load scenarios, ZooKeeper remains a viable option for many deployments.
Considerations:
ClickHouse Keeper is optimized for ClickHouse operations and can handle higher loads.
ZooKeeper is well-established and works well for many clients.
The choice between ClickHouse Keeper and ZooKeeper is more about the overall system architecture and load patterns.
Configuration Synchronization
To keep configurations in sync:
Use ON CLUSTER clause for DDL statements
Store RBAC objects in Keeper
Implement a configuration management system (e.g., Ansible, Puppet) to simultaneously apply changes to clickhouse configuration files in config.d
5.16 - How ALTERs work in ClickHouse®
How ALTERs work in ClickHouse®:
ADD (COLUMN/INDEX/PROJECTION)
Lightweight, will only change table metadata.
So new entity will be added in case of creation of new parts during INSERT’s OR during merges of old parts.
In case of COLUMN, ClickHouse will calculate column value on fly in query context.
CREATETABLEtest_materialization(`key`UInt32,`value`UInt32)ENGINE=MergeTreeORDERBYkey;INSERTINTOtest_materialization(key,value)SELECT1,1;INSERTINTOtest_materialization(key,value)SELECT2,2;ALTERTABLEtest_materializationADDCOLUMNinserted_atDateTimeDEFAULTnow();SELECTkey,inserted_atFROMtest_materialization;┌─key─┬─────────inserted_at─┐│1│2022-09-0103:28:58│└─────┴─────────────────────┘┌─key─┬─────────inserted_at─┐│2│2022-09-0103:28:58│└─────┴─────────────────────┘SELECTkey,inserted_atFROMtest_materialization;┌─key─┬─────────inserted_at─┐│1│2022-09-0103:29:11│└─────┴─────────────────────┘┌─key─┬─────────inserted_at─┐│2│2022-09-0103:29:11│└─────┴─────────────────────┘Eachquerywillreturndifferentinserted_atvalue,becauseeachtimenow()functionbeingexecuted.INSERTINTOtest_materialization(key,value)SELECT3,3;SELECTkey,inserted_atFROMtest_materialization;┌─key─┬─────────inserted_at─┐│3│2022-09-0103:29:36│-- < This value was materialized during ingestion, that's why it's smaller than value for keys 1 & 2
└─────┴─────────────────────┘┌─key─┬─────────inserted_at─┐│1│2022-09-0103:29:53│└─────┴─────────────────────┘┌─key─┬─────────inserted_at─┐│2│2022-09-0103:29:53│└─────┴─────────────────────┘OPTIMIZETABLEtest_materializationFINAL;SELECTkey,inserted_atFROMtest_materialization;┌─key─┬─────────inserted_at─┐│1│2022-09-0103:30:52││2│2022-09-0103:30:52││3│2022-09-0103:29:36│└─────┴─────────────────────┘SELECTkey,inserted_atFROMtest_materialization;┌─key─┬─────────inserted_at─┐│1│2022-09-0103:30:52││2│2022-09-0103:30:52││3│2022-09-0103:29:36│└─────┴─────────────────────┘So,datainsertedafteradditionofcolumncanhavelowerinserted_atvaluethenolddatawithoutmaterialization.
If you want to backpopulate data for old parts, you have multiple options:
Will trigger merge, which will lead to materialization of all entities in affected parts.
ALTER TABLE xxxx UPDATE column_name = column_name WHERE 1;
Will trigger mutation, which will materialize this column.
DROP (COLUMN/INDEX/PROJECTION)
Lightweight, it’s only about changing of table metadata and removing corresponding files from filesystem.
For Compact parts it will trigger merge, which can be heavy. issue
DROP DETACHED command
The DROP DETACHED command in ClickHouse® is used to remove parts or partitions that have previously been detached (i.e., moved to the detached directory and forgotten by the server). The syntax is:
Warning
Be careful before dropping any detached part or partition. Validate that data is no longer needed and keep a backup before running destructive commands.
$ jeprof --svg https://user:password@cluster.env.altinity.cloud:8443/pprof/heap > ./mem.svg
Fetching /pprof/heap profile from https://user:password@cluster.env.altinity.cloud:8443/pprof/heap to
/home/user/jeprof/clickhouse.1756728952.user.pprof.heap
Wrote profile to /home/user/jeprof/clickhouse.1756728952.user.pprof.heap
Dropping nodes with <= 90.7 MB; edges with <= 18.1 abs(MB)
$ jeprof --svg https://user:password@cluster.env.altinity.cloud:8443/pprof/heap --base /home/user/jeprof/clickhouse.1756728952.user.pprof.heap > ./mem_diff.svg
Fetching /pprof/heap profile from https://user:password@cluster.env.altinity.cloud:8443/pprof/heap to
/home/user/jeprof/clickhouse.1756729237.user.pprof.heap
Wrote profile to /home/user/jeprof/clickhouse.1756729237.user.pprof.heap
cluster :) SYSTEM JEMALLOC DISABLE PROFILE;
SYSTEM JEMALLOC DISABLE PROFILE
Ok.
0 rows in set. Elapsed: 0.271 sec.
5.20 - Keeper-Dependent Features in ClickHouse
Keeper-Dependent Features in ClickHouse
Keeper-Dependent Features in ClickHouse
This is a consolidated list of features that depend on ClickHouse Keeper (or ZooKeeper-compatible API).
Keeper below means either ClickHouse Keeper or Apache ZooKeeper, depending on deployment.
#
Feature
How configured
Default path / example
Keeper structure (brief)
1
Replicated tables (ReplicatedMergeTree family)
Use ENGINE = ReplicatedMergeTree(...), or omit args and rely on server defaults default_replica_path, default_replica_name.
Enable setting allow_experimental_kafka_offsets_storage_in_keeper=1 and set both kafka_keeper_path, kafka_replica_name.
No default keeper path (must be set), docs example: /clickhouse/{database}/{uuid}.
<kafka_keeper_path>/topics/<topic>/partitions, topic_partition_locks, replicas/<replica>, temporary dropped for drop coordination.
4
Distributed DDL queue (ON CLUSTER)
Server settings: distributed_ddl.path, distributed_ddl.replicas_path.
Defaults: /clickhouse/task_queue/ddl/ and /clickhouse/task_queue/replicas/.
Queue entries as query-XXXXXXXXXX nodes. Each entry has status dirs: active/<host_id>, finished/<host_id>, optional synced/<host_id>, shards/<shard>/.... Replicas liveness is tracked under <replicas_path>/<host_id>/active (ephemeral).
5
KeeperMap table engine
Server config must define keeper_map_path_prefix; table uses engine arg root_path.
No built-in default (disabled if prefix is absent). Common example: /keeper_map_tables.
<prefix>/<root_path>/metadata, metadata/tables/<table_unique_id>, data/<serialized_key>, drop/cleanup coordination nodes under metadata/....
6
Replicated databases (ENGINE=Replicated)
ENGINE = Replicated(zoo_path, shard, replica) or omit args and use DB-replicated defaults.
Configure user_directories with <replicated><zookeeper_path>...</zookeeper_path></replicated>.
No mandatory default; common example: /clickhouse/access.
<path>/uuid/<entity_uuid> stores entity payload. Type maps: U (users), R (roles), S (settings profiles), P (row policies), Q (quotas), M (masking policies), each mapping name -> UUID.
8
Replicated SQL UDFs (CREATE FUNCTION)
Set server config user_defined_zookeeper_path (otherwise disk storage is used).
No default keeper path; common example: /clickhouse/udf.
Root node plus one znode per function, e.g. function_<escaped_name>.sql containing CREATE FUNCTION text.
Operation roots like backup-<uuid> / restore-<uuid> with coordination subtrees: stage sync, replicated objects acquisition, file mapping, keeper-map coordination, etc.
13
AzureQueue
Same object-storage queue keeper model as S3Queue, with keeper_path setting.
Uses the same queue metadata path logic (s3queue_default_zookeeper_path prefix if no explicit path).
Same pattern as S3Queue: metadata, processed/failed/processing, registry, optional buckets in ordered mode.
14
generateSerialID() function
Server setting series_keeper_path.
Default: /clickhouse/series.
One node per series: <series_keeper_path>/<series_name>, value is current counter.
15
Experimental transactions
Configure transaction_log.zookeeper_path (and enable related experimental transaction settings).
Default: /clickhouse/txn.
<path>/tail_ptr and <path>/log/csn-* sequential nodes storing commit sequence and transaction IDs.
16
Shared database engine (Cloud)
ClickHouse Cloud managed behavior (not typically user-configured in self-managed OSS).
Internal/cloud-managed.
Shared catalog is Keeper-backed; low-level path layout is internal and not documented as a stable public contract.
How ON CLUSTER fits in (important)
ON CLUSTER itself relies on a Keeper-backed distributed DDL queue (see row 4).
Some of the features listed above already replicate via Keeper, which can make ON CLUSTER redundant:
Replicated database DDLs (row 6).
Replicated access entities (row 7).
Replicated UDFs (row 8).
Keeper-backed named collections (row 9).
ClickHouse has dedicated settings like ignore_on_cluster_for_replicated_* to control this behavior.
Notes
For many features, path names can be redirected to auxiliary Keeper clusters using <auxiliary_zookeepers> and the cluster_name:/path notation, where supported.
The metadata structure shown above reflects the stable conceptual layout from the current source tree; some minor subnodes may vary by version.
5.21 - Logging
Logging configuration and issues
Q. I get errors:
File not found: /var/log/clickhouse-server/clickhouse-server.log.0.
File not found: /var/log/clickhouse-server/clickhouse-server.log.8.gz.
...
File not found: /var/log/clickhouse-server/clickhouse-server.err.log.0, Stack trace (when copying this message, always include the lines below):
0. Poco::FileImpl::handleLastErrorImpl(std::__1::basic_string<char, std::__1::char_traits<char>, std::__1::allocator<char> > const&) @ 0x11c2b345 in /usr/bin/clickhouse
1. Poco::PurgeOneFileStrategy::purge(std::__1::basic_string<char, std::__1::char_traits<char>, std::__1::allocator<char> > const&) @ 0x11c84618 in /usr/bin/clickhouse
2. Poco::FileChannel::log(Poco::Message const&) @ 0x11c314cc in /usr/bin/clickhouse
3. DB::OwnFormattingChannel::logExtended(DB::ExtendedLogMessage const&) @ 0x8681402 in /usr/bin/clickhouse
4. DB::OwnSplitChannel::logSplit(Poco::Message const&) @ 0x8682fa8 in /usr/bin/clickhouse
5. DB::OwnSplitChannel::log(Poco::Message const&) @ 0x8682e41 in /usr/bin/clickhouse
A. Check if you have proper permission to a log files folder, and enough disk space (& inode numbers) on the block device used for logging.
5.22 - High Memory Usage During Merge in system.metric_log
Resolving excessive memory consumption during merges in the ClickHouse® system.metric_log table.
Overview
In recent versions of ClickHouse®, the merge process (part compaction) in the system.metric_log table can consume a large amount of memory.
The issue arises due to an unfortunate combination of settings, where:
the merge is already large enough to produce wide parts,
but not yet large enough to enable vertical merges.
This problem has become more pronounced in newer ClickHouse® versions because the system.metric_log table has expanded significantly — many new metrics were added, increasing the total number of columns.
Wide vs Compact — storage formats for table parts:
Wide — each column is stored in a separate file (more efficient for large datasets).
Compact — all data is stored in a single file (more efficient for small inserts).
Horizontal vs Vertical merge — algorithms for combining data during merges:
Horizontal merge reads and merges all columns at once — meaning all files are opened simultaneously, and buffers are allocated for each column and each part.
Vertical merge processes columns in batches — first merging only columns from ORDER BY, then the rest one by one. This approach significantly reduces memory usage.
The most memory-intensive scenario is a horizontal merge of wide parts in a table with a large number of columns.
Demonstrating the Problem
The issue can be reproduced easily by adjusting a few settings:
the threshold for enabling wide parts is configured in bytes (min_bytes_for_wide_part);
while the threshold for enabling vertical merges is configured in rows (vertical_merge_algorithm_min_rows_to_activate).
When a table contains very wide rows (many lightweight columns), this mismatch causes wide parts to appear too early, while vertical merges are triggered much later.
Default Settings
Parameter
Value
vertical_merge_algorithm_min_rows_to_activate
131072
vertical_merge_algorithm_min_bytes_to_activate
0
min_bytes_for_wide_part
10485760 (10 MB)
min_rows_for_wide_part
0
The average row size in metric_log is approximately 2.8 KB, meaning wide parts are created after roughly:
10485760 / 2800 ≈ 3744 rows
Meanwhile, the vertical merge algorithm activates only after 131 072 rows — much later.
Possible Solutions
Increase min_bytes_for_wide_part
For example, set it to at least 2800 * 131072 ≈ 350 MB.
This delays the switch to the wide format until vertical merges can also be used.
Switch to a row-based threshold
Use min_rows_for_wide_part instead of min_bytes_for_wide_part.
Lower the threshold for vertical merges
Reduce vertical_merge_algorithm_min_rows_to_activate,
or add a value for vertical_merge_algorithm_min_bytes_to_activate.
Example Local Fix for metric_log
Apply the configuration below, then restart ClickHouse® and drop the metric_log table (so it will be recreated with the updated settings):
<metric_logreplace="1"><database>system</database><table>metric_log</table><engine> ENGINE = MergeTree
PARTITION BY (event_date)
ORDER BY (event_time)
TTL event_date + INTERVAL 14 DAY DELETE
SETTINGS min_bytes_for_wide_part = 536870912;
</engine><flush_interval_milliseconds>7500</flush_interval_milliseconds></metric_log>
This configuration increases the threshold for wide parts to 512 MB, preventing premature switching to the wide format and reducing memory usage during merges.
In addition to metric_log, other tables may also be affected — particularly those with average row sizes greater than ~80 bytes and hundreds of columns.
<clickhouse><merge_tree><min_bytes_for_wide_part>0</min_bytes_for_wide_part><!-- disable size based threshold for wide part --><min_rows_for_wide_part>131072</min_rows_for_wide_part><!-- use row based instread, same value as vertical_merge_algorithm_min_rows_to_activate --></merge_tree></clickhouse>
These settings tell ClickHouse® to keep using compact parts longer
and to enable the vertical merge algorithm simultaneously with the switch to the wide format, preventing sudden spikes in memory usage.
Caution: the vertical merge directly from compact parts to wide part can be VERY slow.
⚠️ Potential Risks and Trade-offs
Raising min_bytes_for_wide_part globally keeps more data in compact parts, which can both help and hurt depending on workload. Compact parts store all columns in a single data.bin file — this makes inserts much faster, especially for tables with many columns, since fewer files are created per part. It’s also a big advantage when storing data on S3 or other object storage, where every extra file adds latency and increases API call counts.
The trade-off is that this layout makes reads less efficient for column-selective queries. Reading one or two columns from a large compact part means scanning and decompressing shared blocks instead of isolated files. It can also reduce cache locality, slightly worsen compression (different columns compressed together), and make mutations or ALTERs more expensive because each change rewrites the entire part.
Lowering thresholds for vertical merges further decreases merge memory but may make the first merges slower, as they process columns sequentially. This configuration works best for wide, append-only tables or S3-based storage, while analytical tables with frequent updates or narrow schemas may perform better with defaults. If merge memory or S3 request overhead is your main concern, applying it globally is reasonable — otherwise, start with specific wide tables like system.metric_log, verify performance improvements, and expand gradually.
Additionally the the vertical merge directly from compact parts to wide part can be VERY slow.
✅ Summary
The root issue is a mismatch between byte-based and row-based thresholds for wide parts and vertical merges.
Aligning these values — by adjusting one or both parameters — stabilizes memory usage and prevents excessive RAM consumption during merges in system.metric_log and similar tables.
5.23 - Precreate parts using clickhouse-local
Precreate parts using clickhouse-local.
Precreate parts using clickhouse-local
the code below were testes on 23.3
## 1. Imagine we want to process this file:
cat <<EOF > /tmp/data.csv
1,2020-01-01,"String"
2,2020-02-02,"Another string"
3,2020-03-03,"One more string"
4,2020-01-02,"String for first partition"
EOF
rm -rf /tmp/precreate_parts
mkdir -p /tmp/precreate_parts
cd /tmp/precreate_parts
## 2. that is the metadata for the table we want to fill
## schema should match the schema of the table from server
## (the easiest way is just to copy it from the server)
## I've added sleepEachRow(0.5) here just to mimic slow insert
clickhouse-local --path=. --query="CREATE DATABASE local"
clickhouse-local --path=. --query="CREATE TABLE local.test (id UInt64, d Date, s String, x MATERIALIZED sleepEachRow(0.5)) Engine=MergeTree ORDER BY id PARTITION BY toYYYYMM(d);"
## 3. we can insert the input file into that table in different manners:
## a) just plain insert
cat /tmp/data.csv | clickhouse-local --path=. --query="INSERT INTO local.test FORMAT CSV"
## b) use File on the top of stdin (allows to tune the types)
clickhouse-local --path=. --query="CREATE TABLE local.stdin (id UInt64, d Date, s String) Engine=File(CSV, stdin)"
cat /tmp/data.csv | clickhouse-local --path=. --query="INSERT INTO local.test SELECT * FROM local.stdin"
## c) Instead of stdin you can use file engine
clickhouse-local --path=. --query "CREATE TABLE local.data_csv (id UInt64, d Date, s String) Engine=File(CSV, '/tmp/data.csv')"
clickhouse-local --path=. --query "INSERT INTO local.test SELECT * FROM local.data_csv"
# 4. now we have already parts created
clickhouse-local --path=. --query "SELECT _part,* FROM local.test ORDER BY id"
ls -la data/local/test/
# if needed we can even preprocess them more agressively - by doing OPTIMIZE ON that
clickhouse-local --path=. --query "OPTIMIZE TABLE local.test FINAL"
# that works, but clickhouse will keep inactive parts (those 'unmerged') in place.
ls -la data/local/test/
# we can use a bit hacky way to force it to remove inactive parts them
clickhouse-local --path=. --query "ALTER TABLE local.test MODIFY SETTING old_parts_lifetime=0, cleanup_delay_period=0, cleanup_delay_period_random_add=0"
## needed to give background threads time to clean inactive parts (max_block_size allows to stop that quickly if needed)
clickhouse-local --path=. --query "SELECT count() FROM numbers(100) WHERE sleepEachRow(0.1) SETTINGS max_block_size=1"
ls -la data/local/test/
clickhouse-local --path=. --query "SELECT _part,* FROM local.test ORDER BY id"
5.24 - Recovery after complete data loss
When disaster strikes
Atomic & Ordinary databases.
srv1 – good replica
srv2 – lost replica / we will restore it from srv1
test data (3 tables (atomic & ordinary databases))
5.25 - How to Replicate ClickHouse RBAC Users and Grants with ZooKeeper/Keeper
Practical guide to configure Keeper-backed RBAC replication for users, roles, grants, policies, quotas, and profiles across ClickHouse nodes, including migration and troubleshooting.
How can I replicate CREATE USER and other RBAC commands automatically between servers?
This KB explains how to make SQL RBAC changes (CREATE USER, CREATE ROLE, GRANT, row policies, quotas, settings profiles, masking policies) automatically appear on all servers by storing access entities in ZooKeeper/ClickHouse Keeper.
Keeper below means either ClickHouse Keeper or ZooKeeper.
TL;DR:
By default, SQL RBAC changes (CREATE USER, GRANT, etc.) are local to each server.
Replicated access storage keeps RBAC entities in ZooKeeper/ClickHouse Keeper so changes automatically appear on all nodes.
This guide shows how to configure replicated RBAC, validate it, and migrate existing users safely.
Before diving into the details, the core concept is:
ClickHouse stores access entities in access storages configured by user_directories.
By default, following the shared-nothing concept, SQL RBAC objects are local (local_directory), so changes done on one node do not automatically appear on another node unless you run ... ON CLUSTER ....
With user_directories.replicated, ClickHouse stores the RBAC model in Keeper under a configured path (for example /clickhouse/access) and every node watches that path.
Each node maintains a local in-memory cache of replicated access entities and updates it via Keeper watch callbacks. As a result, access checks are fast and performed locally in memory, while RBAC modifications depend on Keeper availability and propagation.
The flow of this article:
Why this model helps.
How to configure it on a new cluster.
How to validate and operate it.
How to migrate existing RBAC safely.
Advanced troubleshooting and internals.
1. ON CLUSTER vs Keeper-backed RBAC: when to use which
ON CLUSTER executes DDL on hosts that exist at execution time.
In practice, it fans out the query through the distributed DDL queue (also Keeper/ZooKeeper-dependent) to currently known cluster nodes.
It does not automatically replay old RBAC DDL for replicas/shards added later.
Keeper-backed RBAC differences:
one shared RBAC state for the cluster;
new servers read the same RBAC state when they join;
no need to remember ON CLUSTER for every RBAC statement.
Mental model: Keeper-backed RBAC replicates access state, while ON CLUSTER fans out DDL to currently known nodes.
1.1 Pros and Cons of Keeper-backed RBAC
Pros:
Single source of truth for RBAC across nodes.
No manual file sync of users.xml / local access files.
Fast propagation through Keeper watch-driven refresh.
Writes depend on Keeper availability. CREATE/ALTER/DROP USER/ROLE and GRANT/REVOKE fail if Keeper is unavailable, while existing authentication/authorization may continue from already loaded cache until restart.
Operational complexity increases (Keeper health directly affects RBAC operations).
Keeper data loss or accidental Keeper path damage can remove replicated RBAC state, and users may lose access; keep regular RBAC backups and test restore procedures.
Can conflict with ON CLUSTER if both mechanisms are used without guard settings.
Invalid/corrupted payload in Keeper can be skipped or be startup-fatal, depending on throw_on_invalid_replicated_access_entities.
Very large RBAC sets (thousands of users/roles or very complex grants) can increase Keeper/watch pressure.
If Keeper is unavailable during server startup and replicated RBAC storage is configured, the server may fail to start.
2. Configure Keeper-backed RBAC on a new cluster
user_directories is the ClickHouse server configuration section that defines:
where access entities are read from (users.xml, local SQL access files, Keeper, LDAP, etc.),
and in which order those sources are checked (precedence).
In short: it is the access-storage routing configuration for users/roles/policies/profiles/quotas.
ClickHouse uses legacy settings (users_config and access_control_path).
In typical default deployments this means users_xml + local_directory.
If user_directoriesis specified:
ClickHouse uses storages from this section and ignores users_config / access_control_path paths for access storages.
Order in user_directories defines precedence for lookup/auth.
When several storages coexist:
reads/auth checks storages by precedence order;
CREATE USER/ROLE/... without explicit IN ... goes to the first writable target by that order (and may conflict with entities found in higher-precedence storages).
There is special syntax to target a storage explicitly:
CREATEUSERmy_userIDENTIFIEDBY'***'INreplicated;
This is supported, but for access control we usually do not recommend mixing storages intentionally.
For sensitive access rights, a single source of truth (typically replicated) is safer and easier to operate.
Save the output as SQL (for example rbac_dump.sql) in your repo/artifacts.
You can also export individual objects with SHOW CREATE USER/ROLE/... when needed.
Switch the configuration to replicated user_directories on the target cluster and restart/reload.
Replay the exported SQL on one node (without ON CLUSTER in replicated mode).
Validate from another node (SHOW CREATE USER ..., SHOW GRANTS FOR ...).
6.2 Migration with clickhouse-backup (--rbac-only)
# backup local RBAC users/roles/etc.clickhouse-backup create --rbac --rbac-only users_bkp_20260304
# restore (on node configured with replicated user directory)clickhouse-backup restore --rbac-only users_bkp_20260304
Important:
this applies to SQL/RBAC users (created with CREATE USER ..., CREATE ROLE ..., etc.);
if your users are in users.xml, those are config-based (--configs) and this is not an automatic local->replicated RBAC conversion.
run restore on one node only; entities will be replicated through Keeper.
If clickhouse-backup is configured with use_embedded_backup_restore: true, it delegates to SQL BACKUP/RESTORE and follows embedded rules. (see below).
6.3 Migration with embedded SQL BACKUP/RESTORE
BACKUPTABLEsystem.users,TABLEsystem.roles,TABLEsystem.row_policies,TABLEsystem.quotas,TABLEsystem.settings_profiles,TABLEsystem.masking_policiesTO<backup_destination>;-- after switching config
RESTORETABLEsystem.users,TABLEsystem.roles,TABLEsystem.row_policies,TABLEsystem.quotas,TABLEsystem.settings_profiles,TABLEsystem.masking_policiesFROM<backup_destination>;
allow_backup behavior for embedded SQL backup/restore:
Storage-level flag in user_directories (<replicated>, <local_directory>, <users_xml>) controls whether that storage participates in backup/restore.
Entity-level setting allow_backup (for users/roles/settings profiles) can exclude specific RBAC objects from backup.
Defaults in ClickHouse code:
users_xml: allow_backup = false by default.
local_directory: allow_backup = true by default.
replicated: allow_backup = true by default.
Operational implication:
If you disable allow_backup for replicated storage, embedded BACKUP TABLE system.users ... may skip those entities (or fail if no backup-allowed access storage remains).
7. Troubleshooting: common support issues
Symptom
Typical root cause
What to do
User created on node A is missing on node B
RBAC still stored in local_directory
Verify system.user_directories; ensure replicated is configured on all nodes and active
RBAC objects “disappeared” after config change/restart
zookeeper_path or storage source changed
Restore from backup or recreate RBAC in the new storage; keep path stable
New replica has no historical users/roles
Team used only ... ON CLUSTER ... before scaling
Enable Keeper-backed RBAC so new nodes load shared state
CREATE USER ... ON CLUSTER throws “already exists in replicated”
Query fan-out + replicated storage both applied
Remove ON CLUSTER for RBAC or enable ignore_on_cluster_for_replicated_access_entities_queries
CREATE USER/GRANT fails with Keeper/ZooKeeper error
Keeper unavailable or connection lost
Check system.zookeeper_connection, system.zookeeper_connection_log, and server logs
RBAC writes still go to local_directory even though replicated is configured
local_directory remains the first writable storage
Use user_directories replace="replace" and avoid writable local SQL storage in front of replicated
Server does not start when Keeper is down; no one can log in
Replicated access storage needs Keeper during initialization
Restore Keeper first, then restart; if needed use a temporary fallback config and keep a break-glass users.xml admin
Startup fails (or users are skipped) because of invalid RBAC payload in Keeper
Corrupted/invalid replicated entity and strict validation mode
Use throw_on_invalid_replicated_access_entities deliberately: true fail-fast, false skip+log; fix bad Keeper payload before re-enabling strict mode
Two independent clusters unexpectedly share the same users/roles
Both clusters point to the same Keeper ensemble and the same zookeeper_path
Use unique RBAC paths per cluster (recommended), or isolate with Keeper chroot (requires Keeper metadata repopulation/migration)
Cannot change RBAC keeper path with SQL at runtime
Not supported by design
Change config + controlled migration/restore
Trying to “sync” RBAC between independent clusters by pointing to another path
Wrong migration model
Use backup/restore or SQL export/import, not ad hoc path switching
Authentication errors from app/job, but local tests work
Network/IP/user mismatch, not replication itself
Check system.query_log and source IP; verify user host restrictions
Short window where user seems present/absent via load balancer
Propagation + node routing timing
Validate directly on each node; avoid assuming LB view is instantly consistent
Server fails after aggressive user_directories replacement
Required base users/profiles missing in config
Keep users_xml (or equivalent base definitions) intact
8. Operational guardrails for production
Keep the same user_directories config on all nodes.
Keep zookeeper_path unique per cluster/tenant.
Use a dedicated admin user for provisioning; avoid using default for automation.
Track configuration rollouts (who/when/what) to avoid hidden behavior changes.
Treat Keeper health as part of access-management SLO.
Plan RBAC backup/restore before changing storage path or cluster topology.
You can find feature-related lines in the log, by those patterns:
Access(replicated)
ZooKeeperReplicator
Can't have Replicated access without ZooKeeper
ON CLUSTER clause was ignored for query
9.3 Force RBAC reload
Force access reload:
SYSTEMRELOADUSERS;
10. Keeper path structure and semantics (advanced)
The following details are useful for advanced debugging or when inspecting Keeper paths manually.
If zookeeper_path=/clickhouse/access:
/clickhouse/access
/uuid/<entity_uuid> -> serialized ATTACH statements for one entity
/U/<escaped_name> -> user name -> UUID
/R/<escaped_name> -> role name -> UUID
/S/<escaped_name> -> settings profile name -> UUID
/P/<escaped_name> -> row policy name -> UUID
/Q/<escaped_name> -> quota name -> UUID
/M/<escaped_name> -> masking policy name -> UUID
When these paths are accessed:
startup/reconnect: ClickHouse syncs Keeper, creates roots if missing, loads all entities;
CREATE/ALTER/DROP RBAC SQL: updates uuid and type/name index nodes in Keeper transactions;
runtime: watch callbacks refresh changed entities into local in-memory mirror.
11. Low-level internals
Advanced note:
each ClickHouse node keeps a local in-memory cache of all replicated access entities;
cache is updated from Keeper watch notifications (list/entity watches), so auth/lookup paths use local memory and not direct Keeper reads on each request.
watch patterns used:
list watch on /uuid children for create/delete detection;
per-entity watch on /uuid/<id> for payload changes.
thread model:
dedicated watcher thread (runWatchingThread);
on errors: reset cached Keeper client, sleep, retry;
after refresh: send AccessChangesNotifier notifications.
higher-level caches in AccessControl (RoleCache, RowPolicyCache, QuotaCache, SettingsProfilesCache) are updated/invalidated via access change notifications.
Read path is memory-backed (MemoryAccessStorage mirror), not direct Keeper reads per query.
Write path requires Keeper availability; if Keeper is down, RBAC writes fail while some reads can continue from loaded state.
Insert target is selected by storage order and writeability in MultipleAccessStorage; this is why leftover local_directory can hijack SQL user creation.
ignore_on_cluster_for_replicated_access_entities_queries is implemented as AST rewrite that removes ON CLUSTER for access queries when replicated access storage is enabled.
5.26 - Replication: Can not resolve host of another ClickHouse® server
Symptom
When configuring Replication the ClickHouse® cluster nodes are experiencing communication issues, and an error message appears in the log that states that the ClickHouse host cannot be resolved.
<Error> DNSResolver: Cannot resolve host (xxxxx), error 0: DNS error.
auto DB::StorageReplicatedMergeTree::processQueueEntry(ReplicatedMergeTreeQueue::SelectedEntryPtr)::(anonymous class)::operator()(DB::StorageReplicatedMergeTree::LogEntryPtr &) const: Code: 198. DB::Exception: Not found address of host: xxxx. (DNS_ERROR),
Cause:
The error message indicates that the host name of the one of the nodes of the cluster cannot be resolved by other cluster members, causing communication issues between the nodes.
Each node in the replication setup pushes its Fully Qualified Domain Name (FQDN) to Zookeeper, and if other nodes cannot access it using its FQDN, this can cause issues.
Action:
There are two possible solutions to this problem:
Change the FQDN to allow other nodes to access it. This solution can also help to keep the environment more organized. To do this, use the following command to edit the hostname file:
sudo vim /etc/hostname
Or use the following command to change the hostname:
5.27 - source parts size is greater than the current maximum
source parts size (…) is greater than the current maximum (…)
Symptom
I see messages like: source parts size (...) is greater than the current maximum (...) in the logs and/or inside system.replication_queue
Cause
Usually that means that there are already few big merges running.
You can see the running merges using the query:
SELECT * FROM system.merges
That logic is needed to prevent picking a log of huge merges simultaneously
(otherwise they will take all available slots and ClickHouse® will not be
able to do smaller merges, which usually are important for keeping the
number of parts stable).
Action
It is normal to see those messages on some stale replicas. And it should be resolved
automatically after some time. So just wait & monitor system.merges &
system.replication_queue tables, it should be resolved by it’s own.
If it happens often or don’t resolves by it’s own during some longer period of time,
it could be caused by:
increased insert pressure
disk issues / high load (it works slow, not enough space etc.)
high CPU load (not enough CPU power to catch up with merges)
issue with table schemas leading to high merges pressure (high / increased number of tables / partitions / etc.)
Start from checking dmesg / system journals / ClickHouse monitoring to find the anomalies.
Start with creating a single table (the biggest one), use MergeTree engine. Create ‘some’ schema (most probably it will be far from optimal). Prefer denormalized approach for all immutable dimensions, for mutable dimensions - consider dictionaries.
Load some amount of data (at least 5 Gb, and 10 mln rows) - preferable the real one, or as close to real as possible. Usually the simplest options are either through CSV / TSV files (or insert into clickhouse_table select * FROM mysql(...) where ...)
Create several representative queries.
Check the columns cardinality, and appropriate types, use minimal needed type
If the performance of certain queries is not enough - consider using PREWHERE / skipping indexes
Repeat 2-9 for next big table(s). Avoid scenarios when you need to join big tables.
Pick the clients library for you programming language (the most mature are python / golang / java / c++), build some pipeline - for inserts (low QPS, lot of rows in singe insert, check acknowledgements & retry the same block on failures), ETLs if needed, some reporting layer (https://kb.altinity.com/altinity-kb-integrations/bi-tools/
)
Stage 1. Planning the production setup
Collect more data / estimate insert speed, estimate the column sizes per day / month.
Measure the speed of queries
Consider improvement using materialized views / projections / dictionaries.
Collect requirements (ha / number of simultaneous queries / insert pressure / ’exactly once’ etc)
skip_unavailable_shards is necessary to query a system with some nodes are down.
Script to create DB objects
clickhouse-client -q 'show tables from system'> list
for i in `cat list`;doecho"CREATE OR REPLACE VIEW sysall."$i" as select hostName() nodeHost, FQDN() nodeFQDN, * from clusterAllReplicas('{cluster}', system."$i") SETTINGS skip_unavailable_shards = 1;";done;
Timeout exceeded ... or executing longer than distributed_ddl_task_timeout during OPTIMIZE FINAL.
Timeout exceeded ... or executing longer than distributed_ddl_task_timeout during OPTIMIZE FINAL
Timeout may occur
due to the fact that the client reach timeout interval.
in case of TCP / native clients - you can change send_timeout / receive_timeout + tcp_keep_alive_timeout + driver timeout settings
in case of HTTP clients - you can change http_send_timeout / http_receive_timeout + tcp_keep_alive_timeout + driver timeout settings
(in the case of ON CLUSTER queries) due to the fact that the timeout for query execution by shards ends
see setting distributed_ddl_task_timeout
In the first case you additionally may get the misleading messages: Cancelling query. ... Query was cancelled.
In both cases, this does NOT stop the execution of the OPTIMIZE command. It continues to work even after
the client is disconnected. You can see the progress of that in system.processes / show processlist / system.merges / system.query_log.
The same applies to queries like:
INSERT ... SELECT
CREATE TABLE ... AS SELECT
CREATE MATERIALIZED VIEW ... POPULATE ...
It is possible to run a query with some special query_id and then poll the status from the processlist (in the case of a cluster, it can be a bit more complicated).
If you need to execute scheduled tasks, you can use an executable dictionary like it was a cron task.
Rationale
Imagine that we need to restart clickhouse-server every saturday at 10:00 AM. We can use an executable dictionary to do this. Here is the approach and code necessary to do this. It can be used for other operations like INSERT into tables or execute some other imaginative tasks that need an scheduled execution.
Let’s create a simple table to register all the restarts scheduled by this dictionary:
This is the ClickHouse configuration file we will be using for executable dictionaries. The dictionary is a dummy one (ignore the format and other stuff, we need format in the dict definition because if not it will fail loading), we don’t need it to do anything, just execute a script that has all the logic. The scheduled time is defined in the LIFETIME property of the dictionary (every 5 minutes dictionary will be refreshed and subsequently the script executed). Also for this case we need to load it on startup time setting lazy loading of dicts to false.
Now the restart logic (which can be different for other needs). In this case it will do nothing until the restart windows comes. During the restart window, we check if there has been a restart in the same window timeframe (if window is an hour the condition should be 1h). The script will issue a SYSTEM SHUTDOWN command to restart the server. The script will also insert a record in the restart_table to register the restart time.
#!/bin/bash
CLICKHOUSE_USER="admin"CLICKHOUSE_PASSWORD="xxxxxxxxx"# Check if today is Saturday and the time is 10:00 AM CET or later# Get current day of week (1-7, where 7 is Sunday)# reload time for dict is 300 secs / 10 minscurrent_day=$(date +%u)# Get current time in hours and minutescurrent_time=$(date +%H%M)# Check if today is Saturday (6) and the time is between 10:00 AM and 11:00 AMif[[$current_day -eq 6&&$current_time -ge 1000&&$current_time -lt 1100]];then# Get current date and time as timestampcurrent_timestamp=$(date +%s)last_restart_timestamp=$(clickhouse-client --user $CLICKHOUSE_USER --password $CLICKHOUSE_PASSWORD --query "SELECT max(toUnixTimestamp(restart_datetime)) FROM restart_table")# Check if the last restart timestamp is within last hour, if not then restartif[[$(( current_timestamp - last_restart_timestamp )) -ge 3600]];then# Push data to log table and restartecho$current_timestamp| clickhouse-client --user $CLICKHOUSE_USER --password $CLICKHOUSE_PASSWORD --query "INSERT INTO restart_table FORMAT TSVRaw" clickhouse-client --user $CLICKHOUSE_USER --password $CLICKHOUSE_PASSWORD --query "SYSTEM SHUTDOWN"fifi
Improvements
If the dictionary has a high frecuency refresh time, then clickhouse could end up executing that script multiple times using a lot of resources and creating processes that can look like ‘stuck’ ones.
To overcome this we can use the executable pool setting: https://clickhouse.com/docs/sql-reference/dictionaries#executable-pool
Executable pool will spawn a pool of processes (similar as a pool of connections) with the specified command and keep them running until they exit, which is useful for heavy scripts/python and reduces the initialization impact of those on clickhouse.
5.32 - Useful settings to turn on/Defaults that should be reconsidered
Useful settings to turn on.
Useful settings to turn on/Defaults that should be reconsidered
Might be you not expect that join will be filled with default values for missing columns (instead of classic NULLs) during JOIN.
Sets the type of JOIN behaviour. When merging tables, empty cells may appear. ClickHouse fills them differently based on this setting.
Possible values:
0 — The empty cells are filled with the default value of the corresponding field type.
1 — JOIN behaves the same way as in standard SQL. The type of the corresponding field is converted to Nullable, and empty cells are filled with NULL.
Q. I get “Zookeeper session has expired” once. What should i do? Should I worry?
Getting exceptions or lack of acknowledgement in distributed system from time to time is a normal situation.
Your client should do the retry. If that happened once and your client do retries correctly - nothing to worry about.
It it happens often, or with every retry - it may be a sign of some misconfiguration / issue in cluster (see below).
Q. we see a lot of these: Zookeeper session has expired. Switching to a new session
A. There is a single Zookeeper session per server. But there are many threads that can use Zookeeper simultaneously.
So the same event (we lose the single Zookeeper session we had), will be reported by all the threads/queries which were using that Zookeeper session.
Usually after loosing the Zookeeper session that exception is printed by all the thread which watch Zookeeper replication queues, and all the threads which had some in-flight Zookeeper operations (for example inserts, ON CLUSTER commands etc).
If you see a lot of those simultaneously - that just means you have a lot of threads talking to Zookeeper simultaneously (or may be you have many replicated tables?).
Typically after several hundreds (sometimes thousands) of replicated tables, the ClickHouse® server becomes unusable: it can’t do any other work, but only keeping replication housekeeping tasks. ‘ClickHouse-way’ is to have a few (maybe dozens) of very huge tables instead of having thousands of tiny tables. (Side note: the number of not-replicated tables can be scaled much better).
So again if during short period of time you see lot of those exceptions and that don’t happen anymore for a while - nothing to worry about. Just ensure your client is doing retries properly.
Q. We are wondering what is causing that session to “timeout” as the default looks like 30 seconds, and there’s certainly stuff happening much more frequently than every 30 seconds.
Typically that has nothing with an expiration/timeout - even if you do nothing there are heartbeat events in the Zookeeper protocol.
So internally inside ClickHouse:
we have a ‘zookeeper client’ which in practice is a single Zookeeper connection (TCP socket), with 2 threads - one serving reads, the seconds serving writes, and some API around.
while everything is ok Zookeeper client keeps a single logical ‘zookeeper session’ (also by sending heartbeats etc).
we may have hundreds of ‘users’ of that Zookeeper client - those are threads that do some housekeeping, serve queries etc.
Zookeeper client normally have dozen ‘in-flight’ requests (asked by different threads). And if something bad happens with that
(disconnect, some issue with Zookeeper server, some other failure), Zookeeper client needs to re-establish the connection and switch to the new session
so all those ‘in-flight’ requests will be terminated with a ‘session expired’ exception.
Q. That problem happens very often (all the time, every X minutes / hours / days).
Sometimes the real issue can be visible somewhere close to the first ‘session expired’ exception in the log. (i.e. Zookeeper client thread can
know & print to logs the real reason, while all ‘user’ threads just get ‘session expired’).
Also Zookeeper logs may ofter have a clue to that was the real problem.
Known issues which can lead to session termination by Zookeeper:
XID overflow. XID is a transaction counter in Zookeeper, if you do too many transactions the counter reaches maxint32, and to restart the counter Zookeeper closes all the connections. Usually, that happens rarely, and is not avoidable in Zookeeper (well in clickhouse-keeper that problem solved). There are some corner cases / some schemas which may end up with that XID overflow happening quite often. (a worst case we saw was once per 3 weeks).
Q. “Zookeeper session has expired” happens every time I try to start the mutation / do other ALTER on Replicated table.
During ALTERing replicated table ClickHouse need to create a record in Zookeeper listing all the parts which should be mutated (that usually means = list names of all parts of the table). If the size of list of parts exceeds maximum buffer size - Zookeeper drops the connection.
Parts name length can be different for different tables. In average with default jute.maxbuffer (1Mb) mutations start to fail for tables which have more than 5000 parts.
Solutions:
rethink partitioning, high number of parts in table is usually not recommended
Sometimes these Session expired and operation timeout are common, because of merges that read all the blocks in Zookeeper for a table and if there are many blocks (and partitions) read time can be longer than the 10 secs default operation timeout
.
When dropping a partition, ClickHouse never drops old block numbers from Zookeeper, so the list grows indefinitely. It is done as a precaution against race between DROP PARTITION and INSERT. It is safe to clean those old blocks manually
How to organize configuration files in ClickHouse® and how to manage changes
Сonfig management (recommended structure)
ClickHouse® server config consists of two parts server settings (config.xml) and users settings (users.xml).
By default they are stored in the folder /etc/clickhouse-server/ in two files config.xml & users.xml.
We suggest never change vendor config files and place your changes into separate .xml files in sub-folders. This way is easier to maintain and ease ClickHouse upgrades.
/etc/clickhouse-server/users.d – sub-folder for user settings
(derived from users.xml filename).
/etc/clickhouse-server/config.d – sub-folder for server settings (derived from config.xml filename).
/etc/clickhouse-server/conf.d – sub-folder for any (both) settings.
If the root config (xml or yaml) has a different name, such as keeper_config.xml or config_instance_66.xml, then the keeper_config.d and config_instance_66.d folders will be used. But conf.d is always used and processed last.
File names of your xml files can be arbitrary but they are applied in alphabetical order.
Settings can be appended to an XML tree (default behaviour) or replaced or removed.
Example how to delete tcp_port & http_port defined on higher level in the main config.xml (it disables open tcp & http ports if you configured secure ssl):
Most of user setting changes don’t require restart, but they get applied at the connect time, so existing connection may still use old user-level settings.
That means that that new setting will be applied to new sessions / after reconnect.
The list of user setting which require server restart:
See also select * from system.settings where description ilike '%start%'
Also there are several ’long-running’ user sessions which are almost never restarted and can keep the setting from the server start (it’s DDLWorker, Kafka
, and some other service things).
Dictionaries
We suggest to store each dictionary description in a separate (own) file in a /etc/clickhouse-server/dict sub-folder.
By default ClickHouse server configs are in /etc/clickhouse-server/ because clickhouse-server runs with a parameter –config-file /etc/clickhouse-server/config.xml
ClickHouse uses the path from config-file parameter as base folder and seeks for other configs by relative path. All sub-folders users.d / config.d are relative.
You can start multiple clickhouse-server each with own –config-file.
If you need to run multiple servers for CI purposes you can combine all settings in a single fat XML file and start ClickHouse without config folders/sub-folders.
ClickHouse server watches config files and folders. When you change, add or remove XML files ClickHouse immediately assembles XML files into a combined file. These combined files are stored in /var/lib/clickhouse/preprocessed_configs/ folders.
You can verify that your changes are valid by checking /var/lib/clickhouse/preprocessed_configs/config.xml, /var/lib/clickhouse/preprocessed_configs/users.xml.
If something wrong with with your settings e.g. unclosed XML element or typo you can see alerts about this mistakes in /var/log/clickhouse-server/clickhouse-server.log
If you see your changes in preprocessed_configs it does not mean that changes are applied on running server, check Settings and restart.
5.36 - Aggressive merges
Aggressive merges
Q: Is there any way I can dedicate more resources to the merging process when running ClickHouse® on pretty beefy machines (like 36 cores, 1TB of RAM, and large NVMe disks)?
A: Such things are done by increasing the level of parallelism:
1. background_pool_size - how many threads will actually be doing merges and mutations. If you can push most server resources toward merges, for example, in a controlled backlog-clearing window with little foreground traffic, you can raise it aggressively. If you use replicated tables, review max_replicated_merges_in_queue together with it.
2. background_merges_mutations_concurrency_ratio - how many merges and mutations may be assigned relative to background_pool_size. Sometimes the default (2) may work against you by favoring more smaller tasks, which is useful for continuous real-time inserts but less useful when you want a backlog-clearing merge window. In that case, trying 1 is reasonable.
number_of_free_entries_in_pool_to_lower_max_size_of_merge (merge_tree setting) should be changed together with background_pool_size (50-90% of that). “When there is less than a specified number of free entries in the pool (or replicated queue), start to lower the maximum size of the merge to process (or to put in the queue). This is to allow small merges to process - not filling the pool with long-running merges.” To make it really aggressive, try 90-95% of background_pool_size, for ex. 34 (so you will have 34 huge merges and 2 small ones).
Runtime vs restart semantics
background_pool_size and background_merges_mutations_concurrency_ratio can be increased at runtime, but lowering them requires a restart.
Merge scheduling tradeoffs
background_merges_mutations_scheduling_policy is an adjacent knob worth considering:
shortest_task_first helps clear small parts quickly, but can starve large merges if inserts keep producing small parts.
round_robin is safer when starvation of large merges is a concern.
Other settings to consider
control how large target parts may become via max_bytes_to_merge_at_max_space_in_pool if the backlog is dominated by many medium parts instead of tiny fragments.
review min_merge_bytes_to_use_direct_io if you suspect page-cache churn during very large merges. Direct I/O is workload-dependent, so benchmark it instead of assuming it is always better or worse.
on replicated tables with slow merges and a fast network, consider execute_merges_on_single_replica_time_threshold so one replica performs the merge and others can fetch the merged part instead of repeating the same work.
analyze whether Vertical or Horizontal merge is better for your schema. Vertical merges typically use less RAM and keep fewer files open, while Horizontal merges may be simpler and faster for some layouts.
if you have a lot of tables, review scheduler capacity as well: background_schedule_pool_size and background_common_pool_size.
review the schema, especially codecs/compression, because they reduce size but can materially change merge speed.
try to form bigger parts during inserts with min_insert_block_size_bytes, min_insert_block_size_rows, and max_insert_block_size.
check whether Wide or Compact parts are being created (system.parts). Part format is controlled by min_bytes_for_wide_part and min_rows_for_wide_part, so inspect those settings for your version instead of assuming a fixed default cutoff.
consider using recent ClickHouse releases, because mark compression improvements can reduce I/O overhead in merge-heavy workloads.
How to validate changes
All adjustments should be validated with a reproducible benchmark or controlled backlog-clearing test. Compare the before/after trend for merge backlog or part counts, then watch whether the system clears the backlog faster without harming foreground workload. Also monitor how system resources are used or saturated during the test, especially CPU, disk I/O, and for replicated tables network plus ClickHouse Keeper / ZooKeeper load.
Monitor or plot pool usage:
select * from system.metrics where metric like '%PoolTask'
If the relevant pool task counters stay near saturation while backlog does not improve, you are likely limited by another bottleneck such as disk bandwidth, network fetches, or insert shape rather than by merge thread count alone.
Do not use this template when…
the same nodes must sustain low-latency reads and writes continuously, with little room for merge-heavy maintenance windows;
the cluster is already constrained by disk bandwidth rather than merge thread count;
the workload is dominated by mutations, where number_of_free_entries_in_pool_to_execute_mutation may need separate treatment.
Only use the default profile layout if you are intentionally keeping an older configuration style or a compatibility path. See the version notes at the end of this article before copying it.
Through 23.2.x, ClickHouse read these pool settings from the main config and also fell back to profiles.default.* in Context.cpp. That older path covered not only background_pool_size and background_merges_mutations_concurrency_ratio, but also settings such as background_schedule_pool_size and background_common_pool_size.
Starting with 23.3.1.2823-lts, ClickHouse changed this area in PR #48055 (“Refactor reading the pool setting & from server config”). From that release forward, these settings were documented as server settings and the source marked background_pool_size and background_merges_mutations_concurrency_ratio as moved to server config.
For 23.3.1.2823-lts and later, prefer server config (config.xml / config.d) for background_* settings. This is the layout shown in the main example above.
background_pool_size and background_merges_mutations_concurrency_ratio still keep a backward-compatibility path from the default profile at server startup in current upstream source and docs. That is why the legacy profile-style example above is limited to those two settings.
This article intentionally does not show background_schedule_pool_size or background_common_pool_size in users.d. Older versions accepted that pattern, but current upstream docs do not document those settings as profile-based compatibility knobs. For current versions, keep them in server config.
$ sudo ./clickhouse-backup delete local bkp01 -c config.yml
2021/05/31 23:17:05 info delete 'bkp01'$ sudo ./clickhouse-backup delete remote bkp01 -c config.yml
5.38 - Altinity packaging compatibility >21.x and earlier
Altinity packaging compatibility >21.x and earlier
Working with Altinity & Yandex packaging together
Since ClickHouse® version 21.1 Altinity switches to the same packaging as used by Yandex. That is needed for syncing things and introduces several improvements (like adding systemd service file).
Unfortunately, that change leads to compatibility issues - automatic dependencies resolution gets confused by the conflicting package names: both when you update ClickHouse to the new version (the one which uses older packaging) and when you want to install older altinity packages (20.8 and older).
Installing old ClickHouse version (with old packaging schema)
When you try to install versions 20.8 or older from Altinity repo -
yum install clickhouse-client-${version} clickhouse-server-${version}Loaded plugins: fastestmirror, ovl
Loading mirror speeds from cached hostfile
* base: centos.hitme.net.pl
* extras: centos1.hti.pl
* updates: centos1.hti.pl
Altinity_clickhouse-altinity-stable/x86_64/signature |833 B 00:00:00
Altinity_clickhouse-altinity-stable/x86_64/signature | 1.0 kB 00:00:01 !!!
Altinity_clickhouse-altinity-stable-source/signature |833 B 00:00:00
Altinity_clickhouse-altinity-stable-source/signature |951 B 00:00:00 !!!
Resolving Dependencies
--> Running transaction check
---> Package clickhouse-client.x86_64 0:20.8.12.2-1.el7 will be installed
---> Package clickhouse-server.x86_64 0:20.8.12.2-1.el7 will be installed
--> Processing Dependency: clickhouse-server-common = 20.8.12.2-1.el7 for package: clickhouse-server-20.8.12.2-1.el7.x86_64
Package clickhouse-server-common is obsoleted by clickhouse-server, but obsoleting package does not provide for requirements
--> Processing Dependency: clickhouse-common-static = 20.8.12.2-1.el7 for package: clickhouse-server-20.8.12.2-1.el7.x86_64
--> Running transaction check
---> Package clickhouse-common-static.x86_64 0:20.8.12.2-1.el7 will be installed
---> Package clickhouse-server.x86_64 0:20.8.12.2-1.el7 will be installed
--> Processing Dependency: clickhouse-server-common = 20.8.12.2-1.el7 for package: clickhouse-server-20.8.12.2-1.el7.x86_64
Package clickhouse-server-common is obsoleted by clickhouse-server, but obsoleting package does not provide for requirements
--> Finished Dependency Resolution
Error: Package: clickhouse-server-20.8.12.2-1.el7.x86_64 (Altinity_clickhouse-altinity-stable) Requires: clickhouse-server-common = 20.8.12.2-1.el7
Available: clickhouse-server-common-1.1.54370-2.x86_64 (clickhouse-stable) clickhouse-server-common = 1.1.54370-2
Available: clickhouse-server-common-1.1.54378-2.x86_64 (clickhouse-stable) clickhouse-server-common = 1.1.54378-2
...
Available: clickhouse-server-common-20.8.11.17-1.el7.x86_64 (Altinity_clickhouse-altinity-stable) clickhouse-server-common = 20.8.11.17-1.el7
Available: clickhouse-server-common-20.8.12.2-1.el7.x86_64 (Altinity_clickhouse-altinity-stable) clickhouse-server-common = 20.8.12.2-1.el7
You could try using --skip-broken to work around the problem
You could try running: rpm -Va --nofiles --nodigest
As you can see yum has an issue with resolving clickhouse-server-common dependency, which marked as obsoleted by newer packages.
Loaded plugins: fastestmirror, ovl
Loading mirror speeds from cached hostfile
* base: ftp.agh.edu.pl
* extras: ftp.agh.edu.pl
* updates: centos.wielun.net
Resolving Dependencies
--> Running transaction check
---> Package clickhouse-client.x86_64 0:20.8.12.2-1.el7 will be a downgrade
---> Package clickhouse-client.noarch 0:21.1.7.1-2 will be erased
---> Package clickhouse-server.x86_64 0:20.8.12.2-1.el7 will be a downgrade
--> Processing Dependency: clickhouse-server-common = 20.8.12.2-1.el7 for package: clickhouse-server-20.8.12.2-1.el7.x86_64
Package clickhouse-server-common-20.8.12.2-1.el7.x86_64 is obsoleted by clickhouse-server-21.1.7.1-2.noarch which is already installed
--> Processing Dependency: clickhouse-common-static = 20.8.12.2-1.el7 for package: clickhouse-server-20.8.12.2-1.el7.x86_64
---> Package clickhouse-server.noarch 0:21.1.7.1-2 will be erased
--> Finished Dependency Resolution
Error: Package: clickhouse-server-20.8.12.2-1.el7.x86_64 (Altinity_clickhouse-altinity-stable) Requires: clickhouse-common-static = 20.8.12.2-1.el7
Installed: clickhouse-common-static-21.1.7.1-2.x86_64 (@clickhouse-stable) clickhouse-common-static = 21.1.7.1-2
Available: clickhouse-common-static-1.1.54378-2.x86_64 (clickhouse-stable) clickhouse-common-static = 1.1.54378-2
Error: Package: clickhouse-server-20.8.12.2-1.el7.x86_64 (Altinity_clickhouse-altinity-stable)...
Available: clickhouse-server-common-20.8.12.2-1.el7.x86_64 (Altinity_clickhouse-altinity-stable) clickhouse-server-common = 20.8.12.2-1.el7
You could try using --skip-broken to work around the problem
You could try running: rpm -Va --nofiles --nodigest
Solution With Downgrading
Remove packages first, then install older versions:
In usual conditions ClickHouse being limited by throughput of volumes and amount of provided IOPS doesn’t make any big difference for performance starting from a certain number. So the most native choice for ClickHouse is gp3 and gp2 volumes.
EC2 instances also have an EBS throughput limit, it depends on the size of the EC2 instance. That means if you would attach multiple volumes which would have high potential throughput, you would be limited by your EC2 instance, so usually there is no reason to have more than 1-3 GP3 volume or 4-5 GP2 volume per node.
It’s pretty straightforward to set up a ClickHouse for using multiple EBS volumes with jbod storage_policies.
It’s recommended option, as it allow you to have only one volume, for instances which have less than 10 Gbps EBS Bandwidth (nodes =<32 VCPU usually) and still have maximum performance.
For bigger instances, it make sense to look into option of having several GP3 volumes.
It’s a new type of volume, which is 20% cheaper than gp2 per GB-month and has lower free throughput: only 125 MiB/s vs 250 MiB/s. But you can buy additional throughput and IOPS for volume. It also works better if most of your queries read only one or several parts, because in that case you are not being limited by performance of a single EBS disk, as parts can be located only on one disk at once.
Because, you need to have less GP3 volumes compared to GP2 option, it’s suggested approach for now.
For best performance, it’s suggested to buy:
7000 IOPS
Throughput up to the limit of your EC2 instance (1000 MiB/s is safe option)
GP2
GP2 volumes have a hard limit of 250 MiB/s per volume (for volumes bigger than 334 GB), it usually makes sense to split one big volume in multiple smaller volumes larger than 334GB in order to have maximum possible throughput.
Throughput Optimized HDD volumes
ST1
Looks like a good candidate for cheap cold storage for old data with decent maximum throughput 500 MiB/s. But it achieved only for big volumes >5 TiB.
In 99.99% cases doesn’t give any benefit for ClickHouse compared to GP3 option and perform worse because maximum throughput is limited to 500 MiB/s per volume if you buy less than 32 000 IOPS, which is really expensive (compared to other options) and unneeded for ClickHouse. And if you have spare money, it’s better to spend them on better EC2 instance.
S3
Best option for cold data, it can give considerably good throughput and really good price, but latencies and IOPS much worse than EBS option.
Another interesting point is, for EC2 instance throughput limit for EBS and S3 calculated separately, so if you access your data both from EBS and S3, you can get double throughput.
It’s stated in AWS documentation, that S3 can fully utilize network capacity of EC2 instance. (up to 100 Gb/s)
Latencies or (first-byte-out) estimated to be 100-200 milliseconds withing single region.
It also recommended to enable gateway endpoint for s3
, it can push throughput even further (up to 800 Gb/s)
Works over NFSv4.1 version.
We have clients, which run their ClickHouse installations over NFS. It works considerably well as cold storage, so it’s recommended to have EBS disks for hot data. A fast network is required.
ClickHouse doesn’t have any native option to reuse the same data on durable network disk via several replicas. You either need to store the same data twice or build custom tooling around ClickHouse and use it without Replicated*MergeTree tables.
FSx
Lustre
We have several clients, who use Lustre (some of them use AWS FSx Lustre, another is self managed Lustre) without any big issue. Fast network is required.
There were known problems with data damage on older versions caused by issues with O_DIRECT or async IO
support on Lustre.
ClickHouse doesn’t have any native option to reuse the same data on durable network disk via several replicas. You either need to store the same data twice or build custom tooling around ClickHouse and use it without Replicated*MergeTree tables.
The following metrics should be collected / monitored
For Host Machine:
CPU: saturation, load average, and iowait
Memory: pressure and available memory
Network: throughput, packets, errors, and drops
Storage: latency, throughput, IOPS, and queue depth
Disk Space: free / used
For ClickHouse:
Query workload:
Connections and number of queries running
Query rate, query duration, and long-running queries
Read / Write / Return (bytes/rows)
Query read amplification: selected rows / bytes / marks / ranges / parts
Memory / cache / contention:
Cache hit rates: mark cache, query cache, and page / filesystem cache if used
Parts / background work:
Merges (queue length, memory used)
Mutations
Part growth, max parts per partition, and detached parts
Replication / distributed execution:
Replication queue length, lag, and failed fetch / check events
Read-only replicas
Keeper / ZooKeeper wait time on the ClickHouse® side
Keeper / ZooKeeper client metrics on the ClickHouse® side: in-flight requests, sessions / watches, operation rates by type, init / close churn, and exceptions
DDL queue length and Distributed tables backlog
Optional integrations:
S3 errors and remote-disk latency (if used)
Kafka consumer health (if used)
For ClickHouse® Keeper (if used):
Quorum / leader election stability, leader churn, and quorum uptime
Built-in ClickHouse® web dashboards are useful for local troubleshooting and ad hoc checks. Do not treat them as a replacement for production monitoring, alerting, retention, or access-control design. Do not expose these endpoints publicly.
Advanced dashboard: http://localhost:8123/dashboard. Current ClickHouse® docs describe it as a built-in dashboard for query rate, CPU, merges, reads, memory, inserts, and part counts. It is backed by rows from <code>system.dashboards</code>
and mostly charts history from system.metric_log and system.asynchronous_metric_log; if those logs are disabled or empty, many graphs will be empty. See the upstream monitoring docs
and advanced dashboard example
.
Custom dashboard definitions can be served by the same /dashboard page from any table with the same schema as system.dashboards. This is useful for local one-off panels, but keep long-term dashboards in your normal observability system.
ClickStack UI: starting with ClickHouse® 26.2, ClickStack / HyperDX is embedded in the ClickHouse® binary at http://localhost:8123/clickstack. Use it to explore local logs, traces, metrics, or ClickHouse® system tables. The embedded version is intended for local development and learning, not production deployments; it does not provide persistent state storage, alerting, or saved dashboard/query persistence. See Introducing ClickStack embedded in ClickHouse
.
Keeper dashboard: http://localhost:9182/dashboard, only when keeper_server.http_control.port is enabled. The same HTTP control interface exposes commands and storage APIs, so restrict it with network controls. See Keeper HTTP API and Dashboard
.
jemalloc UI: starting with ClickHouse® 26.2, http://localhost:8123/jemalloc shows allocator statistics and can fetch heap profiles. Use it for allocation and memory debugging, not steady-state monitoring; jemalloc profiling can add overhead. See allocation profiling
.
Prometheus + Grafana
Use Prometheus for production monitoring and alerting. Scrape ClickHouse® Server and ClickHouse® Keeper as separate targets when Keeper is used.
ClickHouse® Server: enable the built-in Prometheus endpoint
in clickhouse-server config. It can expose metrics from system.metrics, system.asynchronous_metrics, system.events, and system.errors; newer versions can also expose histograms and dimensional metrics through the Prometheus protocol handler
. Common dashboards: 14192
and 13500
.
ClickHouse® Keeper: starting with ClickHouse® 22.12, Keeper has its own Prometheus endpoint. Configure prometheus.port and prometheus.endpoint in the Keeper config and scrape every Keeper node; the release example uses port 9369 and /metrics. These are Keeper server metrics, not the same thing as ClickHouse® Server metrics about ZooKeeper / Keeper client activity. See the 22.12 release note
.
Altinity Kubernetes Operator: if ClickHouse® is deployed by the operator, use the operator-managed metrics exporter, dashboards, and alerts. See the operator Prometheus setup
, Grafana setup
, dashboard
, and alert rules
.
Legacy external exporter: clickhouse_exporter
with dashboard 882
exists, but is unmaintained. Prefer the built-in exporter or the operator exporter for new deployments.
Grafana dashboards querying ClickHouse® directly
Grafana can query ClickHouse® directly through a ClickHouse® datasource. This is useful for system.query_log analysis and ad hoc operational dashboards, but it is different from Prometheus monitoring: every refresh runs SQL on ClickHouse. Use a restricted read-only user, keep panels time-bounded, and avoid expensive high-cardinality queries on production clusters.
Altinity / Vertamedia datasource: prefer Altinity plugin for ClickHouse
for new direct-query dashboards. It was initially developed by Vertamedia and has been maintained by Altinity since 2020. For modern Grafana use current 3.x versions; old pre-3.x versions were Angular-based. You can use the operator queries dashboard
as a starting point.
Official Grafana ClickHouse® datasource: Grafana ClickHouse® datasource
is an alternative when your Grafana stack standardizes on Grafana-maintained datasource plugins or needs its logs, traces, alerting, and OpenTelemetry-oriented workflows. Current plugin docs also list built-in dashboards for query, data, cluster, and OpenTelemetry analysis: ClickHouse® datasource docs
.
Older direct-query dashboards: ClickHouse® Performance Monitor 13606
and ClickHouse® Queries 2515
query ClickHouse® directly. Treat them as import examples to review and adapt, not drop-in production defaults. Dashboard 13606 states it was built for ClickHouse® 20.8.7; dashboard 2515 depends on system.query_log.
Other monitoring integrations
These are secondary paths. Prefer Prometheus/Grafana for production monitoring and the Altinity Grafana datasource plugin for new direct-query dashboards unless your environment already standardizes on one of these tools.
Commercial monitoring platforms
These commercial platforms have ClickHouse® monitoring integrations or documented ClickHouse® monitoring workflows. Validate exact metric coverage, ClickHouse® version support, and ClickHouse® Keeper coverage before relying on a vendor dashboard as the only monitoring source.
Datadog
: provides a ClickHouse® integration for collecting service checks and metrics into Datadog.
Sematext
: provides a ClickHouse® integration for metrics, dashboards, and alerts in Sematext Cloud or Enterprise.
IBM Instana
: documents ClickHouse® monitoring in Instana Observability.
Site24x7
: provides a ClickHouse® plugin-based monitoring workflow.
Acceldata Pulse
: documents ClickHouse® monitoring workflows in Acceldata Pulse.
Grafana Cloud
: provides a ClickHouse® integration with prebuilt dashboards and alerts.
MetricFire
: documents ClickHouse® monitoring with MetricFire-managed metrics.
Other integrations
ClickStack / HyperDX: ClickStack
is a ClickHouse®-powered observability stack for OpenTelemetry logs, metrics, traces, session replay, dashboards, and alerts. It can use ClickHouse® as the observability backend, but still monitor the underlying ClickHouse® storage, ingestion, replication, and Keeper health separately.
Graphite-compatible pipelines: ClickHouse® can push system.metrics, system.events, and system.asynchronous_metrics to Graphite with <graphite> in config.xml; multiple <graphite> sections are supported for different intervals. See the ClickHouse® Graphite configuration
. Do not confuse this monitoring exporter with the GraphiteMergeTree
table engine, which stores Graphite time-series data in ClickHouse®.
InfluxDB / Telegraf: for InfluxDB stacks, prefer the Telegraf ClickHouse® input plugin
or scrape the ClickHouse® Prometheus endpoint through Telegraf. The old InfluxDB v1 Graphite protocol
path is mainly for legacy Graphite-compatible pipelines.
Nagios / Icinga: keep these checks coarse: /ping, /replicas_status, host checks, and a small number of thresholded SQL checks. If you write custom plugins, follow the standard Monitoring Plugins guidelines
for return codes, thresholds, timeouts, and one-line output. Do not rely on unmaintained ClickHouse®-specific plugins without reviewing them first.
“Build your own” ClickHouse® monitoring
Use custom checks for smoke tests, Nagios / Icinga-style checks, or legacy monitoring systems. They are not a replacement for Prometheus / Grafana metric retention, dashboards, and alerting.
The HTTP examples assume the default HTTP interface on port 8123; adjust the scheme, host, and port for HTTPS, load balancers, or non-default ports.
Enable rows for optional engines or Keeper-backed features only where those features are configured.
Check name
Shell or SQL command
Severity
ClickHouse® status
$ curl 'http://localhost:8123/' Ok.
Critical
Too many simultaneous queries. Maximum: 100 by default
SELECT value FROM system.metrics WHERE metric = 'Query'
Critical
Replication status
$ curl 'http://localhost:8123/replicas_status' Ok.
High
Read-only replicas, reflected by replicas_status as well
SELECT value FROM system.metrics WHERE metric = 'ReadonlyReplica'
High
Some replication tasks are stuck
SELECT count() FROM system.replication_queue WHERE num_tries > 100 OR num_postponed > 1000
High
ZooKeeper is available
SELECT count() FROM system.zookeeper WHERE path = '/'
Critical for writes
ZooKeeper exceptions
SELECT value FROM system.events WHERE event = 'ZooKeeperHardwareExceptions'
Medium
Other ClickHouse® nodes are available
$ for node in `echo "SELECT DISTINCT host_address FROM system.clusters WHERE host_name != 'localhost'" | curl 'http://localhost:8123/' --silent --data-binary @-`; do curl "http://$node:8123/" --silent; done | sort -u Ok.
High
All ClickHouse® clusters are available, meaning every configured cluster has enough replicas to serve queries
$ for cluster in `echo "SELECT DISTINCT cluster FROM system.clusters WHERE host_name != 'localhost'" | curl 'http://localhost:8123/' --silent --data-binary @-`; do clickhouse-client --query="SELECT '$cluster', 'OK' FROM cluster('$cluster', system, one)"; done
Critical
There are files in detached folders
$ find /var/lib/clickhouse/data/*/*/detached/* -type d | wc -l ClickHouse® 19.8+: SELECT count() FROM system.detached_parts
Medium
Too many parts: number of parts is growing, inserts are being delayed, or inserts are being rejected
SELECT value FROM system.asynchronous_metrics WHERE metric = 'MaxPartCountForPartition' SELECT value FROM system.metrics WHERE metric = 'DelayedInserts' SELECT value FROM system.events WHERE event = 'DelayedInserts' SELECT value FROM system.events WHERE event = 'RejectedInserts'
Critical
Dictionaries: exception
SELECT concat(name, ': ', last_exception) FROM system.dictionaries WHERE last_exception != ''
Medium
ClickHouse® has been restarted
SELECT uptime() SELECT value FROM system.asynchronous_metrics WHERE metric = 'Uptime'
DistributedFilesToInsert should not be always increasing
SELECT value FROM system.metrics WHERE metric = 'DistributedFilesToInsert'
Medium
A data part was lost
SELECT value FROM system.events WHERE event = 'ReplicatedDataLoss'
High
Data parts are not the same on different replicas
SELECT value FROM system.events WHERE event = 'DataAfterMergeDiffersFromReplica' SELECT value FROM system.events WHERE event = 'DataAfterMutationDiffersFromReplica'
Medium
For deeper dashboards or incident drill-downs, include these system tables as inspection sources:
<code>system.metrics</code>
: current counters for active server state, queues, background work, and integration-specific gauges.
Scraped metrics are not a complete history. Short-lived states between scrapes can be missed.
Interpret these tables by signal type:
system.metrics is a point-in-time view of current values. For example, Query is the number of queries running when the table is read.
system.asynchronous_metrics is also a snapshot, but values are calculated periodically in the background.
system.events contains cumulative counters since server start. Alert on deltas or rates between scrapes, not on the raw value alone, except for rare counters where any increase is meaningful.
If you need a full picture of query volume, latency, errors, or short-lived query spikes, use <code>system.query_log</code>
in addition to scraped metrics.
Monitoring ClickHouse® logs
ClickHouse® logs
can be another important source of information. There are 2 logs enabled by default
/var/log/clickhouse-server/clickhouse-server.err.log (error & warning, you may want to keep an eye on that or send it to some monitoring system)
/var/log/clickhouse-server/clickhouse-server.log (trace logs, very detailed, useful for debugging, usually too verbose to monitor).
The server log level is controlled by logger.level and optional per-output / per-logger overrides. In the upstream default config logger.level is trace, which is very verbose. system.text_log has its own <text_log><level> filter, but it only receives messages that already passed the server logger level. Setting <text_log><level>trace</level> will not recover trace / debug messages if the server logger is configured at information, warning, or another less verbose level. Valid levels include fatal, critical, error, warning, notice, information, debug, and trace. Allowing trace or debug in both places is useful for troubleshooting, but it can make system.text_log grow quickly.
Since ClickHouse® 24.8, the upstream default config enables system.text_log with <level>trace</level>. In older versions, or in custom packages/configs, you may still need to enable it manually. Ensure that you will not expose sensitive log messages to users who should not see them.
Warning
With the default trace level, system.text_log can grow quickly. If you keep it enabled in production, set an appropriate level, partition_by, order_by, and ttl. Without a TTL, system log table growth is not bounded by retention.
Check the current volume before using system.text_log for monitoring:
3 indicates a Feature Release. This is an increment where features are delivered.
10 is the bugfix / maintenance version. When that version is incremented it means that some bugs was fixed comparing to 21.3.9.
1 - build number, means nothing for end users.
lts - type of release. (long time support).
What is Altinity Stable version?
It is one of general / public version of ClickHouse which has passed some extra testings, the upgrade path and changelog was analyzed, known issues are documented, and at least few big companies use it on production. All those things take some time, so usually that means that Altinity Stable is always a ‘behind’ the main releases.
Altinity version - is an option for conservative users, who prefer bit older but better known things.
Usually there is no reason to use version older than Altinity Stable. If you see that new Altinity Version arrived and you still use some older version - you should for sure consider an upgrade.
Additionally for Altinity client we provide extra support for those version for a longer time (and we also support newer versions).
Which version should I use?
We recommend the following approach:
When you start using ClickHouse and before you go on production - pick the latest stable version.
If you already have ClickHouse running on production:
Check all the new queries / schemas on the staging first, especially if some new ClickHouse features are used.
Do minor (bugfix) upgrades regularly: monitor new maintenance releases of the feature release you use.
When considering upgrade - check Altinity Stable release docs
, if you want to use newer release - analyze changelog and known issues.
Check latest stable or test versions of ClickHouse on your staging environment regularly and pass the feedback to us or on the official ClickHouse github
.
ClickHouse development process goes in a very high pace and has already thousands of features. CI system doing tens of thousands of tests (including tests with different sanitizers) against every commit.
All core features are well-tested, and very stable, and code is high-quality. But as with any other software bad things may happen. Usually the most of bugs happens in the new, freshly added functionality, and in some complex combination of several features (of course all possible combinations of features just physically can’t be tested). Usually new features are adopted by the community and stabilize quickly.
What should I do if I found a bug in ClickHouse?
First of all: try to upgrade to the latest bugfix release Example: if you use v21.3.5.42-lts but you know that v21.3.10.1-lts already exists - start with upgrade to that. Upgrades to latest maintenance releases are smooth and safe.
Look for similar issues in github. Maybe the fix is on the way.
If you can reproduce the bug: try to isolate it - remove some pieces of query one-by-one / simplify the scenario until the issue still reproduces. This way you can figure out which part is responsible for that bug, and you can try to create minimal reproducible example
Once you have minimal reproducible example:
report it to github (or to Altinity Support)
check if it reproduces on newer ClickHouse versions
5.43 - Configure ClickHouse® for low memory environments
Configure ClickHouse® for low memory environments
While Clickhouse® it’s typically deployed on powerful servers with ample memory and CPU, it can be deployed in resource-constrained environments like a Raspberry Pi. Whether you’re working on edge computing, IoT data collection, or simply experimenting with ClickHouse in a small-scale setup, running it efficiently on low-memory hardware can be a rewarding challenge.
TLDR;
<!-- config.xml --><!-- These settinsg should allow to run clickhouse in nodes with 4GB/8GB RAM --><clickhouse><!-- disable some optional components/tables --><mysql_portremove="1"/><postgresql_portremove="1"/><query_thread_logremove="1"/><opentelemetry_span_logremove="1"/><processors_profile_logremove="1"/><!-- disable mlock, allowing binary pages to be unloaded from RAM, relying on Linux defaults --><mlock_executable>false</mlock_executable><!-- decrease the cache sizes --><mark_cache_size>268435456</mark_cache_size><!-- 256 MB --><index_mark_cache_size>67108864</index_mark_cache_size><!-- 64 MB --><uncompressed_cache_size>16777216</uncompressed_cache_size><!-- 16 MB --><!-- control the concurrency --><max_thread_pool_size>2000</max_thread_pool_size><max_connections>64</max_connections><max_concurrent_queries>8</max_concurrent_queries><max_server_memory_usage_to_ram_ratio>0.75</max_server_memory_usage_to_ram_ratio><!-- 75% of the RAM, leave more for the system --><max_server_memory_usage>0</max_server_memory_usage><!-- We leave the overcommiter to manage available ram for queries--><!-- reconfigure the main pool to limit the merges (those can create problems if the insert pressure is high) --><background_pool_size>2</background_pool_size><background_merges_mutations_concurrency_ratio>2</background_merges_mutations_concurrency_ratio><merge_tree><merge_max_block_size>1024</merge_max_block_size><max_bytes_to_merge_at_max_space_in_pool>1073741824</max_bytes_to_merge_at_max_space_in_pool><!-- 1 GB max part--><number_of_free_entries_in_pool_to_lower_max_size_of_merge>2</number_of_free_entries_in_pool_to_lower_max_size_of_merge><number_of_free_entries_in_pool_to_execute_mutation>2</number_of_free_entries_in_pool_to_execute_mutation><number_of_free_entries_in_pool_to_execute_optimize_entire_partition>2</number_of_free_entries_in_pool_to_execute_optimize_entire_partition><!-- Reduces memory usage during merges in system.metric_log table (enabled by default) by setting min_bytes_for_wide_part and vertical_merge_algorithm_min_bytes_to_activate to 128MB --><min_bytes_for_wide_part>134217728</min_bytes_for_wide_part><vertical_merge_algorithm_min_bytes_to_activate>134217728</vertical_merge_algorithm_min_bytes_to_activate></merge_tree><!-- shrink all pools to minimum--><background_buffer_flush_schedule_pool_size>1</background_buffer_flush_schedule_pool_size><background_merges_mutations_scheduling_policy>round_robin</background_merges_mutations_scheduling_policy><background_move_pool_size>1</background_move_pool_size><background_fetches_pool_size>1</background_fetches_pool_size><background_common_pool_size>2</background_common_pool_size><background_schedule_pool_size>8</background_schedule_pool_size><background_message_broker_schedule_pool_size>1</background_message_broker_schedule_pool_size><background_distributed_schedule_pool_size>1</background_distributed_schedule_pool_size><tables_loader_foreground_pool_size>0</tables_loader_foreground_pool_size><tables_loader_background_pool_size>0</tables_loader_background_pool_size></clickhouse>
Disabling both postgres/mysql interfaces will release some CPU/memory resources.
Disabling some system tables like processor_profile_log, opentelemetry_span_log, or query_thread_log will help reducing write amplification. Those tables write a lot of data very frequently. In a Raspi4 with 4 GB of RAM and a simple USB3.1 storage they can spend some needed resources.
Decrease mark caches. Defaults are 5GB and they are loaded into RAM (in newer versions this behavior of loading them completely in RAM can be tuned with a prewarm setting https://github.com/ClickHouse/ClickHouse/pull/71053
) so better to reserve a reasonable amount of space in line with the total amount of RAM. For example for 4/8GB 256MB is a good value.
Tune server memory and leave 25% for OS ops (max_server_memory_usage_to_ram_ratio)
Tune the thread pools and queues for merges and mutations:
merge_max_block_size will reduce the number of rows per block when merging. Default is 8192 and this will reduce the memory usage of merges.
The number_of_free_entries_in_pool settings are very nice to tune how much concurrent merges are allowed in the queue. When there is less than specified number of free entries in pool , start to lower maximum size of merge to process (or to put in queue) or do not execute part mutations to leave free threads for regular merges . This is to allow small merges to process - not filling the pool with long running merges or multiple mutations. You can check clickhouse documentation to get more insights.
Reduce the background pools and be conservative. In a Raspi4 with 4 cores and 4 GB or ram, background pool should be not bigger than the number of cores and even less if possible.
Tune some profile settings to enable disk spilling (max_bytes_before_external_group_by and max_bytes_before_external_sort) and reduce the number of threads per query plus enable queuing of queries (queue_max_wait_ms) if the max_concurrent_queries limit is exceeded. Also max_block_size is not usually touched but in this case we can lower it ro reduce RAM usage.
5.44 - Converting MergeTree to Replicated
Adding replication to a table
To enable replication in a table that uses the MergeTree engine, you need to convert the engine to ReplicatedMergeTree. Options here are:
UseINSERT INTO foo_replicated SELECT * FROM foo. (suitable for small tables)
Create table aside and attach all partition from the existing table then drop original table (uses hard links don’t require extra disk space). ALTER TABLE foo_replicated ATTACH PARTITION ID 'bar' FROM 'foo' You can easily auto generate those commands using a query like: SELECT DISTINCT 'ALTER TABLE foo_replicated ATTACH PARTITION ID \'' || partition_id || '\' FROM foo;' from system.parts WHERE table = 'foo'; See the example below
for details.
Note: ATTACH PARTITION ID 'bar' FROM 'foo' is practically free from a compute and disk space perspective. This feature utilizes filesystem hard-links and the fact that files are immutable in ClickHouse® (it’s the core of the ClickHouse design, filesystem hard-links and such file manipulations are widely used).
createtablefoo(AInt64,DDate,SString)EngineMergeTreepartitionbytoYYYYMM(D)orderbyA;insertintofooselectnumber,today(),''fromnumbers(1e8);insertintofooselectnumber,today()-60,''fromnumbers(1e8);selectcount()fromfoo;┌───count()─┐│200000000│└───────────┘createtablefoo_replicatedasfooEngineReplicatedMergeTree('/clickhouse/{cluster}/tables/{database}/{table}/{shard}','{replica}')partitionbytoYYYYMM(D)orderbyA;SYSTEMSTOPMERGES;SELECTDISTINCT'ALTER TABLE foo_replicated ATTACH PARTITION ID \'' || partition_id || '\' FROM foo;'fromsystem.partsWHEREtable='foo'ANDactive;┌─concat('ALTER TABLE foo_replicated ATTACH PARTITION ID \'', partition_id, '\' FROM foo;')─┐│ALTERTABLEfoo_replicatedATTACHPARTITIONID'202111'FROMfoo;││ALTERTABLEfoo_replicatedATTACHPARTITIONID'202201'FROMfoo;│└───────────────────────────────────────────────────────────────────────────────────────────┘clickhouse-client-q"SELECT DISTINCT 'ALTER TABLE foo_replicated ATTACH PARTITION ID \'' || partition_id || '\' FROM foo;' from system.parts WHERE table = 'foo' format TabSeparatedRaw"|clickhouse-client-mnSYSTEMSTARTMERGES;SELECTcount()FROMfoo_replicated;┌───count()─┐│200000000│└───────────┘renametablefootofoo_old,foo_replicatedtofoo;-- you can drop foo_old any time later, it's kinda a cheap backup,
-- it cost nothing until you insert a lot of additional data into foo_replicated
5.45 - Data Migration
Data Migration
Export & Import into common data formats
Pros:
Data can be inserted into any DBMS.
Cons:
Decoding & encoding of common data formats may be slower / require more CPU
The data size is usually bigger than ClickHouse® formats.
Some of the common data formats have limitations.
Info
The best approach to do that is using clickhouse-client, in that case, encoding/decoding of format happens client-side, while client and server speak clickhouse Native format (columnar & compressed).
In contrast: when you use HTTP protocol, the server do encoding/decoding and more data is passed between client and server.
remote/remoteSecure or cluster/Distributed table
Pros:
Simple to run.
It’s possible to change the schema and distribution of data between shards.
How to pipe data to ClickHouse® from bcp export tool for MSSQL database
Prepare tables
LAPTOP.localdomain :) CREATE TABLE tbl(key UInt32)ENGINE=MergeTree ORDER BY key;root@LAPTOP:/home/user# sqlcmd -U sa -P Password78
1> WITH t0(i) AS (SELECT 0 UNION ALL SELECT 0), t1(i) AS (SELECT 0 FROM t0 a, t0 b), t2(i) AS (SELECT 0 FROM t1 a, t1 b), t3(i) AS (SELECT 0 FROM t2 a, t2 b), t4(i) AS (SELECT 0 FROM t3 a, t3 b), t5(i) AS (SELECT 0 FROM t4 a, t3 b),n(i) AS (SELECT ROW_NUMBER() OVER(ORDER BY (SELECT 0)) FROM t5) SELECT i INTO tbl FROM n WHERE i BETWEEN 1 AND 167772162> GO
(16777216 rows affected)root@LAPTOP:/home/user# sqlcmd -U sa -P Password78 -Q "SELECT count(*) FROM tbl"-----------
16777216(1 rows affected)
Piping
root@LAPTOP:/home/user# mkfifo import_pipe
root@LAPTOP:/home/user# bcp "SELECT * FROM tbl" queryout import_pipe -t, -c -b 200000 -U sa -P Password78 -S localhost &[1]6038root@LAPTOP:/home/user#
Starting copy...
1000 rows successfully bulk-copied to host-file. Total received: 10001000 rows successfully bulk-copied to host-file. Total received: 20001000 rows successfully bulk-copied to host-file. Total received: 30001000 rows successfully bulk-copied to host-file. Total received: 40001000 rows successfully bulk-copied to host-file. Total received: 50001000 rows successfully bulk-copied to host-file. Total received: 60001000 rows successfully bulk-copied to host-file. Total received: 70001000 rows successfully bulk-copied to host-file. Total received: 80001000 rows successfully bulk-copied to host-file. Total received: 90001000 rows successfully bulk-copied to host-file. Total received: 100001000 rows successfully bulk-copied to host-file. Total received: 110001000 rows successfully bulk-copied to host-file. Total received: 120001000 rows successfully bulk-copied to host-file. Total received: 130001000 rows successfully bulk-copied to host-file. Total received: 140001000 rows successfully bulk-copied to host-file. Total received: 150001000 rows successfully bulk-copied to host-file. Total received: 160001000 rows successfully bulk-copied to host-file. Total received: 170001000 rows successfully bulk-copied to host-file. Total received: 180001000 rows successfully bulk-copied to host-file. Total received: 190001000 rows successfully bulk-copied to host-file. Total received: 200001000 rows successfully bulk-copied to host-file. Total received: 210001000 rows successfully bulk-copied to host-file. Total received: 220001000 rows successfully bulk-copied to host-file. Total received: 23000-- Enter
root@LAPTOP:/home/user# cat import_pipe | clickhouse-client --query "INSERT INTO tbl FORMAT CSV"&...
1000 rows successfully bulk-copied to host-file. Total received: 167690001000 rows successfully bulk-copied to host-file. Total received: 167700001000 rows successfully bulk-copied to host-file. Total received: 167710001000 rows successfully bulk-copied to host-file. Total received: 167720001000 rows successfully bulk-copied to host-file. Total received: 167730001000 rows successfully bulk-copied to host-file. Total received: 167740001000 rows successfully bulk-copied to host-file. Total received: 167750001000 rows successfully bulk-copied to host-file. Total received: 167760001000 rows successfully bulk-copied to host-file. Total received: 1677700016777216 rows copied.
Network packet size (bytes): 4096Clock Time (ms.) Total : 11540 Average : (1453831.5 rows per sec.)[1]- Done bcp "SELECT * FROM tbl" queryout import_pipe -t, -c -b 200000 -U sa -P Password78 -S localhost
[2]+ Done cat import_pipe | clickhouse-client --query "INSERT INTO tbl FORMAT CSV"
Another shell
root@LAPTOP:/home/user# for i in `seq 1 600`;do clickhouse-client -q "select count() from tbl";sleep 1;done0000001048545419418062912709436905115339951363108516777216167772161677721616777216
5.45.2 - Add/Remove a new replica to a ClickHouse® cluster
How to add/remove a new ClickHouse replica manually and using clickhouse-backup
ADD nodes/replicas to a ClickHouse® cluster
To add some ClickHouse® replicas to an existing cluster if -30TB then better to use replication:
don’t add the remote_servers.xml until replication is done.
Add these files and restart to limit bandwidth and avoid saturation (70% total bandwidth):
💡 Do the Gbps to Bps math correctly. For 10G —> 1250MB/s —> 1250000000 B/s. Change the max_replicated_* settings accordingly and add them to a file in /etc/clickhouse-server/config.d/ (e.g., config.d/replication-limits.xml) and restart ClickHouse:
Create tables manually and be sure macros in all replicas are aligned with the ZK path. If zk path uses {cluster} then this method won’t work. ZK path should use {shard} and {replica} or {uuid} (if databases are Atomic) only.
-- DDL for Databases
SELECTconcat('CREATE DATABASE "',name,'" ENGINE = ',engine_full,';')FROMsystem.databasesWHEREnameNOTIN('system','information_schema','INFORMATION_SCHEMA')INTOOUTFILE'/tmp/databases.sql'FORMATTSVRaw;-- DDL for tables and views
SELECTreplaceRegexpOne(replaceOne(concat(create_table_query,';'),'(','ON CLUSTER \'{cluster}\' ('),'CREATE (TABLE|DICTIONARY|VIEW|LIVE VIEW|WINDOW VIEW)','CREATE \\1 IF NOT EXISTS')FROMsystem.tablesWHEREengine!='MaterializedView'anddatabaseNOTIN('system','information_schema','INFORMATION_SCHEMA')ANDcreate_table_query!=''ANDnameNOTLIKE'.inner.%%'ANDnameNOTLIKE'.inner_id.%%'INTOOUTFILE'/tmp/schema.sql'ANDSTDOUTFORMATTSVRawSETTINGSshow_table_uuid_in_table_create_query_if_not_nil=1;--- DDL only for materialized views
SELECTreplaceRegexpOne(replaceOne(concat(create_table_query,';'),'TO','ON CLUSTER \'{cluster}\' TO'),'(CREATE MATERIALIZED VIEW)','\\1 IF NOT EXISTS')FROMsystem.tablesWHEREengine='MaterializedView'anddatabaseNOTIN('system','information_schema','INFORMATION_SCHEMA')ANDcreate_table_query!=''ANDnameNOTLIKE'.inner.%%'ANDnameNOTLIKE'.inner_id.%%'ANDas_select!=''INTOOUTFILE'/tmp/schema.sql'APPENDANDSTDOUTFORMATTSVRawSETTINGSshow_table_uuid_in_table_create_query_if_not_nil=1;
This will generate the UUIDs in the CREATE TABLE definition, something like this:
Before proceeding: check if you have restore_schema_on_cluster set; if it is, this procedure will drop tables with ON CLUSTER, which is not its intention! To verify:
$ sudo -u clickhouse clickhouse-backup create --schema --rbac --named-collections rbac_and_schema
# From the destination replica do this in 2 steps (for safety, keep --env=RESTORE_SCHEMA_ON_CLUSTER=):$ sudo -u clickhouse clickhouse-backup restore --env=RESTORE_SCHEMA_ON_CLUSTER= --rbac-only rbac_and_schema
$ sudo -u clickhouse clickhouse-backup restore --env=RESTORE_SCHEMA_ON_CLUSTER= --schema --named-collections rbac_and_schema
Using altinity operator
If there is at least one alive replica in the shard, you can remove PVCs and STS for affected nodes and trigger reconciliation. The operator will try to copy the schema from other replicas.
Check that schema migration was successful and node is replicating
To check that the schema migration has been successful query system.replicas:
then it is ok, the maximum replication slots are being used. Exceptions are not OK and should be investigated
If migration was successful and replication is working, then wait until the replication is finished. It may take some days, depending on how much data is being replicated. After this edit, the cluster configuration xml file for all replicas (remote_servers.xml), and add the new replica to the cluster.
There are new tables in v23 system.replicated_fetches and system.moves check it out for more info.
if needed just stop replication using SYSTEM STOP FETCHES from the replicating nodes
REMOVE nodes/Replicas from a Cluster
It is important to know which replica/node you want to remove to avoid problems. To check it you need to connect to a different replica/node that the one you want to remove. For instance we want to remove arg_t04, so we connected to replica arg_t01:
After that (make sure you’re connected to a replica different from the one that you want to remove, arg_tg01) and execute:
SYSTEMDROPREPLICA'arg_t04'
If by any chance you’re connected to the same replica you want to remove then SYSTEM DROP REPLICA will not work.
BTW SYSTEM DROP REPLICA does not drop any tables and does not remove any data or metadata from disk, it will only remove metadata from Zookeeper/Keeper
-- What happens if executing system drop replica in the local replica to remove.
SYSTEMDROPREPLICA'arg_t04'Elapsed:0.017sec.Receivedexceptionfromserver(version23.8.6):Code:305.DB::Exception:Receivedfromdnieto-zenbook.lan:9440.DB::Exception:Wecan't drop local replica, please use `DROP TABLE` if you want to clean the data and drop this replica. (TABLE_WAS_NOT_DROPPED)
After DROP REPLICA, we need to check that the replica is gone from the list or replicas:
SELECTDISTINCTarrayJoin(mapKeys(replica_is_active))ASreplica_nameFROMsystem.replicas┌─replica_name─┐│arg_t01││arg_t02││arg_t03│└──────────────┘-- We should see there is no replica arg_t04
Delete the replica in the cluster configuration: remote_servers.xml and shutdown the node/replica removed.
5.45.3 - clickhouse-copier
clickhouse-copier
The description of the utility and its parameters, as well as examples of the config files that you need to create for the copier are in the official repo for the ClickHouse® copier utility
The steps to run a task:
Create a config file for clickhouse-copier (zookeeper.xml)
Create a config file for the task (task1.xml)
Create the task in ZooKeeper and start an instance of clickhouse-copier
If you want to run another instance of clickhouse-copier for the same task, you need to copy the config file (zookeeper.xml) to another server, and run this command:
The number of simultaneously running instances is controlled be the max_workers parameter in your task configuration file. If you run more workers superfluous workers will sleep and log messages like this:
<Debug> ClusterCopier: Too many workers (1, maximum 1). Postpone processing
clickhouse-copier was created to move data between clusters.
It runs simple INSERT…SELECT queries and can copy data between tables with different engine parameters and between clusters with different number of shards.
In the task configuration file you need to describe the layout of the source and the target cluster, and list the tables that you need to copy. You can copy whole tables or specific partitions.
clickhouse-copier uses temporary distributed tables to select from the source cluster and insert into the target cluster.
The process is as follows
Process the configuration files.
Discover the list of partitions if not provided in the config.
Copy partitions one by one.
Drop the partition from the target table if it’s not empty
Copy data from source shards one by one.
Check if there is data for the partition on a source shard.
Check the status of the task in ZooKeeper.
Create target tables on all shards of the target cluster.
Insert the partition of data into the target table.
Mark the partition as completed in ZooKeeper.
If there are several workers running simultaneously, they will assign themselves to different source shards.
If a worker was interrupted, another worker can be started to continue the task. The next worker will drop incomplete partitions and resume the copying.
Configuring the engine of the target table
clickhouse-copier uses the engine from the task configuration file for these purposes:
to create target tables if they don’t exist.
PARTITION BY: to SELECT a partition of data from the source table, to DROP existing partitions from target tables.
clickhouse-copier does not support the old MergeTree format.
However, you can create the target tables manually and specify the engine in the task configuration file in the new format so that clickhouse-copier can parse it for its SELECT queries.
How to monitor the status of running tasks
clickhouse-copier uses ZooKeeper to keep track of the progress and to communicate between workers.
Here is a list of queries that you can use to see what’s happening.
--task-path /clickhouse/copier/task1
-- The task config
select*fromsystem.zookeeperwherepath='<task-path>'name|ctime|mtime----------------------------+---------------------+--------------------
description|2019-10-1815:40:00|2020-09-1116:01:14task_active_workers_version|2019-10-1816:00:09|2020-09-1116:07:08tables|2019-10-1816:00:25|2019-10-1816:00:25task_active_workers|2019-10-1816:00:09|2019-10-1816:00:09-- Running workers
select*fromsystem.zookeeperwherepath='<task-path>/task_active_workers'-- The list of processed tables
select*fromsystem.zookeeperwherepath='<task-path>/tables'-- The list of processed partitions
select*fromsystem.zookeeperwherepath='<task-path>/tables/<table>'name|ctime-------+--------------------
201909|2019-10-1818:24:18-- The status of a partition
select*fromsystem.zookeeperwherepath='<task-path>/tables/<table>/<partition>'name|ctime-------------------------+--------------------
shards|2019-10-1818:24:18partition_active_workers|2019-10-1818:24:18-- The status of source shards
select*fromsystem.zookeeperwherepath='<task-path>/tables/<table>/<partition>/shards'name|ctime|mtime-----+---------------------+--------------------
1|2019-10-1822:37:48|2019-10-1822:49:29
5.45.3.2 - clickhouse-copier 20.4 - 21.6
clickhouse-copier 20.4 - 21.6
clickhouse-copier was created to move data between clusters.
It runs simple INSERT…SELECT queries and can copy data between tables with different engine parameters and between clusters with different number of shards.
In the task configuration file you need to describe the layout of the source and the target cluster, and list the tables that you need to copy. You can copy whole tables or specific partitions.
clickhouse-copier uses temporary distributed tables to select from the source cluster and insert into the target cluster.
The behavior of clickhouse-copier was changed in 20.4:
Now clickhouse-copier inserts data into intermediate tables, and after the insert finishes successfully clickhouse-copier attaches the completed partition into the target table. This allows for incremental data copying, because the data in the target table is intact during the process. Important note: ATTACH PARTITION respects the max_partition_size_to_drop limit. Make sure the max_partition_size_to_drop limit is big enough (or set to zero) in the destination cluster. If clickhouse-copier is unable to attach a partition because of the limit, it will proceed to the next partition, and it will drop the intermediate table when the task is finished (if the intermediate table is less than the max_table_size_to_drop limit). Another important note: ATTACH PARTITION is replicated. The attached partition will need to be downloaded by the other replicas. This can create significant network traffic between ClickHouse nodes. If an attach takes a long time, clickhouse-copier will log a timeout and will proceed to the next step.
Now clickhouse-copier splits the source data into chunks and copies them one by one. This is useful for big source tables, when inserting one partition of data can take hours. If there is an error during the insert clickhouse-copier has to drop the whole partition and start again. The number_of_splits parameter lets you split your data into chunks so that in case of an exception clickhouse-copier has to re-insert only one chunk of the data.
Now clickhouse-copier runs OPTIMIZE target_table PARTITION ... DEDUPLICATE for non-Replicated MergeTree tables. Important note: This is a very strange feature that can do more harm than good. We recommend to disable it by configuring the engine of the target table as Replicated in the task configuration file, and create the target tables manually if they are not supposed to be replicated. Intermediate tables are always created as plain MergeTree.
The process is as follows
Process the configuration files.
Discover the list of partitions if not provided in the config.
Copy partitions one by one ** The metadata in ZooKeeper suggests the order described here.**
Copy chunks of data one by one.
Copy data from source shards one by one.
Create intermediate tables on all shards of the target cluster.
Check the status of the chunk in ZooKeeper.
Drop the partition from the intermediate table if the previous attempt was interrupted.
Insert the chunk of data into the intermediate tables.
Mark the shard as completed in ZooKeeper
Attach the chunks of the completed partition into the target table one by one
Attach a chunk into the target table.
non-Replicated: Run OPTIMIZE target_table DEDUPLICATE for the partition on the target table.
Drop intermediate tables (may not succeed if the tables are bigger than max_table_size_to_drop).
If there are several workers running simultaneously, they will assign themselves to different source shards.
If a worker was interrupted, another worker can be started to continue the task. The next worker will drop incomplete partitions and resume the copying.
Configuring the engine of the target table
clickhouse-copier uses the engine from the task configuration file for these purposes:
to create target and intermediate tables if they don’t exist.
PARTITION BY: to SELECT a partition of data from the source table, to ATTACH partitions into target tables, to DROP incomplete partitions from intermediate tables, to OPTIMIZE partitions after they are attached to the target.
ORDER BY: to SELECT a chunk of data from the source table.
Here is an example of SELECT that clickhouse-copier runs to get the sixth of ten chunks of data:
clickhouse-copier does not support the old MergeTree format.
However, you can create the intermediate tables manually with the same engine as the target tables (otherwise ATTACH will not work), and specify the engine in the task configuration file in the new format so that clickhouse-copier can parse it for SELECT, ATTACH PARTITION and DROP PARTITION queries.
Important note: always configure engine as Replicated to disable OPTIMIZE … DEDUPLICATE (unless you know why you need clickhouse-copier to run OPTIMIZE … DEDUPLICATE).
How to configure the number of chunks
The default value for number_of_splits is 10.
You can change this parameter in the table section of the task configuration file. We recommend setting it to 1 for smaller tables.
clickhouse-copier uses ZooKeeper to keep track of the progress and to communicate between workers.
Here is a list of queries that you can use to see what’s happening.
--task-path=/clickhouse/copier/task1
-- The task config
select*fromsystem.zookeeperwherepath='<task-path>'name|ctime|mtime----------------------------+---------------------+--------------------
description|2021-03-2213:15:48|2021-03-2213:25:28status|2021-03-2213:15:48|2021-03-2213:25:28task_active_workers_version|2021-03-2213:15:48|2021-03-2220:32:09tables|2021-03-2213:16:47|2021-03-2213:16:47task_active_workers|2021-03-2213:15:48|2021-03-2213:15:48-- Status
select*fromsystem.zookeeperwherepath='<task-path>/status'-- Running workers
select*fromsystem.zookeeperwherepath='<task-path>/task_active_workers'-- The list of processed tables
select*fromsystem.zookeeperwherepath='<task-path>/tables'-- The list of processed partitions
select*fromsystem.zookeeperwherepath='<task-path>/tables/<table>'name|ctime-------+--------------------
202103|2021-03-2213:16:47202102|2021-03-2213:18:31202101|2021-03-2213:27:36202012|2021-03-2214:05:08-- The status of a partition
select*fromsystem.zookeeperwherepath='<task-path>/tables/<table>/<partition>'name|ctime---------------+--------------------
piece_0|2021-03-2213:18:31attach_is_done|2021-03-2214:05:05-- The status of a piece
select*fromsystem.zookeeperwherepath='<task-path>/tables/<table>/<partition>/piece_N'name|ctime-------------------------------+--------------------
shards|2021-03-2213:18:31is_dirty|2021-03-2213:26:51partition_piece_active_workers|2021-03-2213:26:54clean_start|2021-03-2213:26:54-- The status of source shards
select*fromsystem.zookeeperwherepath='<task-path>/tables/<table>/<partition>/piece_N/shards'name|ctime|mtime-----+---------------------+--------------------
1|2021-03-2213:26:54|2021-03-2214:05:05
5.45.3.3 - Kubernetes job for clickhouse-copier
Kubernetes job for clickhouse-copier
clickhouse-copier deployment in kubernetes
clickhouse-copier can be deployed in a kubernetes environment to automate some simple backups or copy fresh data between clusters.
The task01.xml file has many parameters to take into account explained in the repo for clickhouse-copier
. Important to note that it is needed a FQDN for the Zookeeper nodes and ClickHouse® server that are valid for the cluster. As the deployment creates a new namespace, it is recommended to use a FQDN linked to a service. For example zookeeper01.svc.cluster.local. This file should be adapted to both clusters topologies and to the needs of the user.
The zookeeper.xml file is pretty straightforward with a simple 3 node ensemble configuration.
3) Create the job:
Basically the job will download the official ClickHouse image and will create a pod with 2 containers:
clickhouse-copier: This container will run the clickhouse-copier utility.
sidecar-logging: This container will be used to read the logs of the clickhouse-copier container for different runs (this part can be improved):
This table lives in the source cluster and all INSERTS go there. In order to shift all INSERTS in the source cluster to destination cluster we can create a Distributed table that points to another ReplicatedMergeTree in the destination cluster:
All the hostnames/FQDN from each replica/node must be accessible from both clusters. Also the remote_servers.xml from the source cluster should read like this:
<clickhouse><remote_servers><source><shard><replica><host>host03</host><port>9000</port></replica><replica><host>host04</host><port>9000</port></replica></shard></source><destination><shard><replica><host>host01</host><port>9000</port></replica><replica><host>host02</host><port>9000</port></replica></shard></destination><!-- If using a LB to shift inserts you need to use user and password and create MT destination table in an all-replicated cluster config --><destination_with_lb><shard><replica><host>load_balancer.xxxx.com</host><port>9440</port><secure>1</secure><username>user</username><password>pass</password></replica></shard></destination_with_lb></remote_servers></clickhouse>
Configuration settings
Depending on your use case you can set the the distributed INSERTs to sync or async mode
. This example is for async mode:
Put this config settings on the default profile. Check for more info about the possible modes:
<clickhouse> ....
<profiles><default><!-- StorageDistributed DirectoryMonitors try to batch individual inserts into bigger ones to increase performance --><distributed_directory_monitor_batch_inserts>1</distributed_directory_monitor_batch_inserts><!-- StorageDistributed DirectoryMonitors try to split batch into smaller in case of failures --><distributed_directory_monitor_split_batch_on_failure>1</distributed_directory_monitor_split_batch_on_failure></default> .....
</profiles></clickhouse>
5.45.5 - Fetch Alter Table
Fetch Alter Table
FETCH Parts from Zookeeper
This is a detailed explanation on how to move data by fetching partitions or parts between replicas
This query will return all the partitions and parts stored in this node for the databases and their tables.
Fetch the partitions:
Prior starting with the fetching process it is recommended to check the system.detached_parts table of the destination node. There is a chance that detached folders already contain some old parts, and you will have to remove them all before starting moving data. Otherwise you will attach those old parts together with the fetched parts. Also you could run into issues if there are detached folders with the same names as the ones you are fetching (not very probable, put possible). Simply delete the detached parts and continue with the process.
will attach the partitions to a table. Again and because the process is manual, it is recommended to check that the fetched partitions are attached correctly and that there are no detached parts left. Check both system.parts and system.detached_parts tables.
Detach tables and delete replicas:
If needed, after moving the data and checking that everything is sound, you can detach the tables and delete the replicas.
-- Required for DROP REPLICA
DETACHTABLE<table_name>;-- This will remove everything from /table_path_in_z/replicas/replica_name
-- but not the data. You could reattach the table again and
-- restore the replica if needed. Get the zookeeper_path and replica_name from system.replicas
SYSTEMDROPREPLICA'replica_name'FROMZKPATH'/table_path_in_zk/';
Query to generate all the DDL:
With this query you can generate the DDL script that will do the fetch and attach operations for each table and partition.
You could add an ORDER BY to manually make the list in the order you need, or use ORDER BY rand() to randomize it. You will then need to split the commands between the shards.
5.45.6 - Remote table function
Remote table function
remote(…) table function
Suitable for moving up to hundreds of gigabytes of data.
With bigger tables recommended approach is to slice the original data by some WHERE condition, ideally - apply the condition on partitioning key, to avoid writing data to many partitions at once.
Q. Can it create a bigger load on the source system?
Yes, it may use disk read & network write bandwidth. But typically write speed is worse than the read speed, so most probably the receiver side will be a bottleneck, and the sender side will not be overloaded.
While of course it should be checked, every case is different.
Q. Can I tune INSERT speed to make it faster?
Yes, by the cost of extra memory usage (on the receiver side).
ClickHouse® tries to form blocks of data in memory and while one of limit: min_insert_block_size_rows or min_insert_block_size_bytes being hit, ClickHouse dump this block on disk. If ClickHouse tries to execute insert in parallel (max_insert_threads > 1), it would form multiple blocks at one time. So maximum memory usage can be calculated like this: max_insert_threads * first(min_insert_block_size_rows OR min_insert_block_size_bytes)
Using remote(…) table function with secure TCP port (default values is 9440). There is remoteSecure() function for that.
High (>50ms) ping between servers, values for connect_timeout_with_failover_ms,connect_timeout_with_failover_secure_ms need’s to be adjusted accordingly.
#!/bin/bash
table='...'
database='bvt'
local='...'
remote='...'
CH="clickhouse-client" # you may add auth here
settings=" max_insert_threads=20,
max_threads=20,
min_insert_block_size_bytes = 536870912,
min_insert_block_size_rows = 16777216,
max_insert_block_size = 16777216,
optimize_on_insert=0";
# need it to create temp table with same structure (suitable for attach)
params=$($CH -h $remote -q "select partition_key,sorting_key,primary_key from system.tables where table='$table' and database = '$database' " -f TSV)
IFS=$'\t' read -r partition_key sorting_key primary_key <<< $params
$CH -h $local \ # get list of source partitions
-q "select distinct partition from system.parts where table='$table' and database = '$database' "
while read -r partition; do
# check that the partition is already copied
if [ `$CH -h $remote -q " select count() from system.parts table='$table' and database = '$database' and partition='$partition'"` -eq 0 ] ; then
$CH -n -h $remote -q "
create temporary table temp as $database.$table engine=MergeTree -- 23.3 required for temporary table
partition by ($partition_key) primary key ($primary_key) order by ($sorting_key);
-- SYSTEM STOP MERGES temp; -- maybe....
set $settings;
insert into temp select * from remote($local,$database.$table) where _partition='$partition'
-- order by ($sorting_key) -- maybe....
;
alter table $database.$table attach partition $partition from temp
"
fi
done
5.45.7 - Moving ClickHouse to Another Server
Copying Multi-Terabyte Live ClickHouse to Another Server
When migrating a large, live ClickHouse cluster (multi-terabyte scale) to a new server or cluster, the goal is to minimize downtime while ensuring data consistency. A practical method is to use incremental rsync in multiple passes, combined with ClickHouse’s replication features.
Prepare the new cluster
Ensure the new cluster is set up with its own ZooKeeper (or Keeper).
Configure ClickHouse but keep it stopped initially.
For clickhouse-operator instances, you can stop all pods by CHI definition:
spec:
stop: "true"
and attach volumes (PVC) to a service pod.
Initial data sync
Run a full recursive sync of the data directory from the old server to the new one:
W: copy whole files instead of using rsync’s delta algorithm (faster for large DB files).
–delete: remove files from the destination that don’t exist on the source.
If you plan to run several replicas on a new cluster, rsync data to all of them. To save the performance of production servers, you can copy data to 1 new replica and then use it as a source for others. You can start with a single replica and add more after switching, but it will take more time afterward, as additional replicas need to pull all the data.
Add –bwlimit=100000 to preserve the performance of the production cluster while copying a lot of data.
Consider shards as independent clusters.
Incremental re-syncs
Repeat the rsync step multiple times while the old cluster is live.
Each subsequent run will copy only changes and reduce the final sync time.
Restore replication metadata
Start the new ClickHouse node(s).
Run SYSTEM RESTORE REPLICA table_name to rebuild replication metadata in ZooKeeper.
Test the application
Point your test environment to the new cluster.
Validate queries, schema consistency, and application behavior.
Final sync and switchover
Stop ClickHouse on the old cluster.
Immediately run a final incremental rsync to catch last-minute changes.
Run SYSTEM RESTORE REPLICA table_name to rebuild replication metadata in ZooKeeper again.
Start ClickHouse on the new cluster and switch production traffic.
add more replicas as needed
NOTES:
To restore metadata on all cluster nodes by a single command, use ON CLUSTER modifier for the RESTORE REPLICA command.
You can build a script to run restore replica commands over all replicated tables by query:
select 'SYSTEM RESTORE REPLICA ' || database || '.' || table || ' ON CLUSTER {cluster} ;'
from system.tables
where engine ilike 'Replicated%'
If you are using a mount point that differs from /var/lib/clickhouse/data, adjust the rsync command accordingly to point to the correct location. For example, suppose you reconfigure the storage path as follows in /etc/clickhouse-server/config.d/config.xml.
<clickhouse>
<!-- Path to data directory, with trailing slash. -->
<path>/data1/clickhouse/</path>
...
</clickhouse>
You’ll need to use /data1/clickhouse instead of /var/lib/clickhouse in the rsync paths.
ClickHouse Docker container image does not have rsync installed. Add it using apt-get or run sidecar in k8s or run a service pod with volumes attached.
If you running rsync to multiple replicas or planning to use same (Zoo)Keeper ensemble for source and destination ClickHouse servers, you need to remove server uuid file after syncing data with rsync.
rm /var/lib/clickhouse/uuid
Otherwise, it can lead to hard-to-debug replication issues. Replicas will break each other’s sessions with (Zoo)Keeper.
5.46 - DDLWorker and DDL queue problems
Finding and troubleshooting problems in the distributed_ddl_queue
DDLWorker is a subprocess (thread) of clickhouse-server that executes ON CLUSTER tasks at the node.
When you execute a DDL query with ON CLUSTER mycluster section, the query executor at the current node reads the cluster mycluster definition (remote_servers / system.clusters) and places tasks into Zookeeper znode task_queue/ddl/... for members of the cluster mycluster.
DDLWorker at all ClickHouse® nodes constantly check this task_queue for their tasks, executes them locally, and reports about the results back into task_queue.
The common issue is the different hostnames/IPAddresses in the cluster definition and locally.
So if the initiator node puts tasks for a host named Host1. But the Host1 thinks about own name as localhost or xdgt634678d (internal docker hostname) and never sees tasks for the Host1 because is looking tasks for xdgt634678d. The same with internal VS external IP addresses.
DDLWorker thread crashed
That causes ClickHouse to stop executing ON CLUSTER tasks.
cleanup_delay_period = 60 seconds – Sets how often to start cleanup to remove outdated data.
task_max_lifetime = 7 * 24 * 60 * 60 (in seconds = week) – Delete task if its age is greater than that.
max_tasks_in_queue = 1000 – How many tasks could be in the queue.
pool_size = 1 - How many ON CLUSTER queries can be run simultaneously.
Too intensive stream of ON CLUSTER command
Generally, it’s a bad design, but you can increase pool_size setting
Stuck DDL tasks in the distributed_ddl_queue
Sometimes DDL tasks
(the ones that use ON CLUSTER) can get stuck in the distributed_ddl_queue because the replicas can overload if multiple DDLs (thousands of CREATE/DROP/ALTER) are executed at the same time. This is very normal in heavy ETL jobs.This can be detected by checking the distributed_ddl_queue table and see if there are tasks that are not moving or are stuck for a long time.
If these DDLs are completed in some replicas but failed in others, the simplest way to solve this is to execute the failed command in the missed replicas without ON CLUSTER. If most of the DDLs failed, then check the number of unfinished records in distributed_ddl_queue on the other nodes, because most probably it will be as high as thousands.
First, backup the distributed_ddl_queue into a table so you will have a snapshot of the table with the states of the tasks. You can do this with the following command:
After this, we need to check from the backup table which tasks are not finished and execute them manually in the missed replicas, and review the pipeline which do ON CLUSTER command and does not abuse them. There is a new CREATE TEMPORARY TABLE command that can be used to avoid the ON CLUSTER command in some cases, where you need an intermediate table to do some operations and after that you can INSERT INTO the final table or do ALTER TABLE final ATTACH PARTITION FROM TABLE temp and this temp table will be dropped automatically after the session is closed.
5.46.1 - There are N unfinished hosts (0 of them are currently active).
There are N unfinished hosts (0 of them are currently active).
Sometimes your Distributed DDL queries are being stuck, and not executing on all or subset of nodes, there are a lot of possible reasons for that kind of behavior, so it would take some time and effort to investigate.
Possible reasons
ClickHouse® node can’t recognize itself
SELECT*FROMsystem.clusters;-- check is_local column, it should have 1 for itself
getent hosts clickhouse.local.net # or other name which should be localhostname --fqdn
cat /etc/hosts
cat /etc/hostname
Debian / Ubuntu
There is an issue in Debian based images, when hostname being mapped to 127.0.1.1 address which doesn’t literally match network interface and ClickHouse fails to detect this address as local.
In that case, you can just wait completion of previous task.
Previous task is stuck because of some error
In that case, the first step is to understand which exact task is stuck and why. There are some queries which can help with that.
-- list of all distributed ddl queries, path can be different in your installation
SELECT*FROMsystem.zookeeperWHEREpath='/clickhouse/task_queue/ddl/';-- information about specific task.
SELECT*FROMsystem.zookeeperWHEREpath='/clickhouse/task_queue/ddl/query-0000001000/';SELECT*FROMsystem.zookeeperWHEREpath='/clickhouse/task_queue/ddl/'ANDname='query-0000001000';-- 22.3
SELECT*FROMsystem.zookeeperWHEREpathlike'/clickhouse/task_queue/ddl/query-0000001000/%'ORDERBYctime,pathSETTINGSallow_unrestricted_reads_from_keeper='true'-- 22.6
SELECTpath,name,value,ctime,mtimeFROMsystem.zookeeperWHEREpathlike'/clickhouse/task_queue/ddl/query-0000001000/%'ORDERBYctime,pathSETTINGSallow_unrestricted_reads_from_keeper='true'-- How many nodes executed this task
SELECTname,numChildrenasfinished_nodesFROMsystem.zookeeperWHEREpath='/clickhouse/task_queue/ddl/query-0000001000/'ANDname='finished';┌─name─────┬─finished_nodes─┐│finished│0│└──────────┴────────────────┘-- The nodes that are running the task
SELECTname,value,ctime,mtimeFROMsystem.zookeeperWHEREpath='/clickhouse/task_queue/ddl/query-0000001000/active/';-- What was the result for the finished nodes
SELECTname,value,ctime,mtimeFROMsystem.zookeeperWHEREpath='/clickhouse/task_queue/ddl/query-0000001000/finished/';-- Latest successfull executed tasks from query_log.
SELECTqueryFROMsystem.query_logWHEREqueryLIKE'%ddl_entry%'ANDtype=2ORDERBYevent_timeDESCLIMIT5;SELECTFQDN(),*FROMclusterAllReplicas('cluster',system.metrics)WHEREmetricLIKE'%MaxDDLEntryID%'┌─FQDN()───────────────────┬─metric────────┬─value─┬─description───────────────────────────┐│chi-ab.svc.cluster.local│MaxDDLEntryID│1468│MaxprocessedDDLentryofDDLWorker.│└──────────────────────────┴───────────────┴───────┴───────────────────────────────────────┘┌─FQDN()───────────────────┬─metric────────┬─value─┬─description───────────────────────────┐│chi-ab.svc.cluster.local│MaxDDLEntryID│1468│MaxprocessedDDLentryofDDLWorker.│└──────────────────────────┴───────────────┴───────┴───────────────────────────────────────┘┌─FQDN()───────────────────┬─metric────────┬─value─┬─description───────────────────────────┐│chi-ab.svc.cluster.local│MaxDDLEntryID│1468│MaxprocessedDDLentryofDDLWorker.│└──────────────────────────┴───────────────┴───────┴───────────────────────────────────────┘-- Information about task execution from logs.
grep-C40"ddl_entry"/var/log/clickhouse-server/clickhouse-server*.log
Task were removed from DDL queue, but left in Replicated*MergeTree table queue.
grep -C 40"ddl_entry" /var/log/clickhouse-server/clickhouse-server*.log
/var/log/clickhouse-server/clickhouse-server.log:2021.05.04 12:41:28.956888 [599]{} <Debug> DDLWorker: Processing task query-0000211211 (ALTER TABLE db.table_local ON CLUSTER `all-replicated` DELETE WHERE id= 1)/var/log/clickhouse-server/clickhouse-server.log:2021.05.04 12:41:29.053555 [599]{} <Error> DDLWorker: ZooKeeper error: Code: 999, e.displayText()= Coordination::Exception: No node, Stack trace (when copying this message, always include the lines below):
/var/log/clickhouse-server/clickhouse-server.log-
/var/log/clickhouse-server/clickhouse-server.log-0. Coordination::Exception::Exception(std::__1::basic_string<char, std::__1::char_traits<char>, std::__1::allocator<char> > const&, Coordination::Error, int) @ 0xfb2f6b3 in /usr/bin/clickhouse
/var/log/clickhouse-server/clickhouse-server.log-1. Coordination::Exception::Exception(Coordination::Error) @ 0xfb2fb56 in /usr/bin/clickhouse
/var/log/clickhouse-server/clickhouse-server.log:2. DB::DDLWorker::createStatusDirs(std::__1::basic_string<char, std::__1::char_traits<char>, std::__1::allocator<char> > const&, std::__1::shared_ptr<zkutil::ZooKeeper> const&) @ 0xeb3127a in /usr/bin/clickhouse
/var/log/clickhouse-server/clickhouse-server.log:3. DB::DDLWorker::processTask(DB::DDLTask&) @ 0xeb36c96 in /usr/bin/clickhouse
/var/log/clickhouse-server/clickhouse-server.log:4. DB::DDLWorker::enqueueTask(std::__1::unique_ptr<DB::DDLTask, std::__1::default_delete<DB::DDLTask> >) @ 0xeb35f22 in /usr/bin/clickhouse
/var/log/clickhouse-server/clickhouse-server.log-5. ? @ 0xeb47aed in /usr/bin/clickhouse
/var/log/clickhouse-server/clickhouse-server.log-6. ThreadPoolImpl<ThreadFromGlobalPool>::worker(std::__1::__list_iterator<ThreadFromGlobalPool, void*>) @ 0x8633bcd in /usr/bin/clickhouse
/var/log/clickhouse-server/clickhouse-server.log-7. ThreadFromGlobalPool::ThreadFromGlobalPool<void ThreadPoolImpl<ThreadFromGlobalPool>::scheduleImpl<void>(std::__1::function<void ()>, int, std::__1::optional<unsigned long>)::'lambda1'()>(void&&, void ThreadPoolImpl<ThreadFromGlobalPool>::scheduleImpl<void>(std::__1::function<void ()>, int, std::__1::optional<unsigned long>)::'lambda1'()&&...)::'lambda'()::operator()() @ 0x863612f in /usr/bin/clickhouse
/var/log/clickhouse-server/clickhouse-server.log-8. ThreadPoolImpl<std::__1::thread>::worker(std::__1::__list_iterator<std::__1::thread, void*>) @ 0x8630ffd in /usr/bin/clickhouse
/var/log/clickhouse-server/clickhouse-server.log-9. ? @ 0x8634bb3 in /usr/bin/clickhouse
/var/log/clickhouse-server/clickhouse-server.log-10. start_thread @ 0x9609 in /usr/lib/x86_64-linux-gnu/libpthread-2.31.so
/var/log/clickhouse-server/clickhouse-server.log-11. __clone @ 0x122293 in /usr/lib/x86_64-linux-gnu/libc-2.31.so
/var/log/clickhouse-server/clickhouse-server.log- (version 21.1.8.30 (official build))/var/log/clickhouse-server/clickhouse-server.log:2021.05.04 12:41:29.053951 [599]{} <Debug> DDLWorker: Processing task query-0000211211 (ALTER TABLE db.table_local ON CLUSTER `all-replicated` DELETE WHERE id= 1)
Context of this problem is:
Constant pressure of cheap ON CLUSTER DELETE queries.
One replica was down for a long amount of time (multiple days).
Because of pressure on the DDL queue, it purged old records due to the task_max_lifetime setting.
When a lagging replica comes up, it’s fail’s execute old queries from DDL queue, because at this point they were purged from it.
Solution:
Reload/Restore this replica from scratch.
DDL path was changed in Zookeeper without restarting ClickHouse
Changing the DDL queue path in Zookeeper without restarting ClickHouse will make ClickHouse confused. If you need to do this ensure that you restart ClickHouse before submitting additional distributed DDL commands. Here’s an example.
-- Path before change:
SELECT*FROMsystem.zookeeperWHEREpath='/clickhouse/clickhouse101/task_queue'┌─name─┬─value─┬─path─────────────────────────────────┐│ddl││/clickhouse/clickhouse101/task_queue│└──────┴───────┴──────────────────────────────────────┘-- Path after change
SELECT*FROMsystem.zookeeperWHEREpath='/clickhouse/clickhouse101/task_queue'┌─name─┬─value─┬─path─────────────────────────────────┐│ddl2││/clickhouse/clickhouse101/task_queue│└──────┴───────┴──────────────────────────────────────┘
The reason is that ClickHouse will not “see” this change and will continue to look for tasks in the old path. Altering paths in Zookeeper should be avoided if at all possible. If necessary it must be done very carefully.
5.47 - Merge Shards
Marge many Shards to one
(draft, not tested)
ClickHouse migration plan: merge 11 shards into 1 using clickhouse-backup
Your migration approach is workable with one important pattern:
restore schema once
restore local-table data shard by shard into detached
run ALTER TABLE ... ATTACH PART to attach restored parts
recreate or adjust Distributed tables for the new 1-shard topology
This plan assumes:
all 11 shards use schema-compatible local tables
all backups are taken from a consistent point in time
the target cluster is already built as a 1-shard environment
Distributed tables are treated as routing/query objects, not as the physical data source
SELECTconcat('ALTER TABLE `',database,'`.`',table,'` ATTACH PART ',quoteString(name),';')ASattach_sqlFROMsystem.detached_partsWHEREdatabaseIN('db1','db2')ANDifNull(reason,'')=''ORDERBYdatabase,table,partition_id,min_block_number,max_block_number,name;
Bash script template
This is a production-style skeleton you can adapt.
#!/usr/bin/env bash
set -euo pipefail
CH_CLIENT="${CH_CLIENT:-clickhouse-client --multiquery}"
CH_BACKUP="${CH_BACKUP:-clickhouse-backup}"
# Backups from 11 source shards
BACKUPS=(
shard01_20260319_full
shard02_20260319_full
shard03_20260319_full
shard04_20260319_full
shard05_20260319_full
shard06_20260319_full
shard07_20260319_full
shard08_20260319_full
shard09_20260319_full
shard10_20260319_full
shard11_20260319_full
)
# Databases to migrate
DATABASES=(
db1
db2
)
# Local tables only.
# Keep Distributed tables out of this list.
LOCAL_TABLE_PATTERNS=(
"db1.*_local"
"db2.*_local"
)
join_by_comma() {
local IFS=","
echo "$*"
}
LOCAL_TABLES_CSV="$(join_by_comma "${LOCAL_TABLE_PATTERNS[@]}")"
echo "== Step 1: restore schema once from first shard backup =="
${CH_BACKUP} restore_remote --schema "${BACKUPS[0]}"
echo "== Step 2: process shard backups one by one =="
for backup in "${BACKUPS[@]}"; do
echo "---- restoring data to detached from backup: ${backup}"
${CH_BACKUP} restore_remote \
--data \
--tables="${LOCAL_TABLES_CSV}" \
--replicated-copy-to-detached \
"${backup}"
echo "---- attaching detached parts created by ${backup}"
${CH_CLIENT} --query "
SELECT concat(
'ALTER TABLE `', database, '`.`', table,
'` ATTACH PART ', quoteString(name), ';'
)
FROM system.detached_parts
WHERE database IN ('db1', 'db2')
AND ifNull(reason, '') = ''
ORDER BY database, table, partition_id, min_block_number, max_block_number, name
FORMAT TSVRaw
" | while IFS= read -r stmt; do
echo "${stmt}"
${CH_CLIENT} --query "${stmt}"
done
echo "---- post-attach detached inventory"
${CH_CLIENT} --query "
SELECT
database,
table,
reason,
count() AS parts
FROM system.detached_parts
WHERE database IN ('db1', 'db2')
GROUP BY database, table, reason
ORDER BY database, table, reason
"
done
echo "== Step 3: final validation =="
${CH_CLIENT} --query "
SELECT database, table, sum(rows) AS rows, formatReadableSize(sum(bytes_on_disk)) AS bytes
FROM system.parts
WHERE active
AND database IN ('db1', 'db2')
GROUP BY database, table
ORDER BY database, table
"
echo "Migration load phase completed."
5.48 - differential backups using clickhouse-backup
In general, it is a NORMAL situation for ClickHouse® that while processing a huge dataset it can use a lot of (or all of) the server resources. It is ‘by design’ - just to make the answers faster.
The main directions to reduce the CPU usage is to review the schema / queries to limit the amount of the data which need to be processed, and to plan the resources in a way when single running query will not impact the others.
Any attempts to reduce the CPU usage will end up with slower queries!
How to slow down queries to reduce the CPU usage
If it is acceptable for you - please check the following options for limiting the CPU usage:
setting max_threads: reducing the number of threads that are allowed to use one request. Fewer threads = more free cores for other requests. By default, it’s allowed to take half of the available CPU cores, adjust only when needed. So if if you have 10 cores then max_threads = 10 will work about twice faster than max_threads=5, but will take 100% or CPU. (max_threads=5 will use half of CPUs so 50%).
setting os_thread_priority: increasing niceness for selected requests. In this case, the operating system, when choosing which of the running processes to allocate processor time, will prefer processes with lower niceness. 0 is the default niceness. The higher the niceness, the lower the priority of the process. The maximum niceness value is 19.
These are custom settings that can be tweaked in several ways:
by specifying them when connecting a client, for example
clickhouse-client --os_thread_priority=19 -q 'SELECT max (number) from numbers (100000000)'echo'SELECT max(number) from numbers(100000000)'| curl 'http://localhost:8123/?os_thread_priority=19' --data-binary @-
via dedicated API / connection parameters in client libraries
using the SQL command SET (works only within the session)
using different profiles of settings for different users. Something like
<?xml version="1.0"?><yandex><profiles><default> ...
</default><lowcpu><os_thread_priority>19</os_thread_priority><max_threads>4</max_threads></lowcpu></profiles><!-- Users and ACL. --><users><!-- If user name was not specified, 'default' user is used. --><limited_user><password>123</password><networks><ip>::/0</ip></networks><profile>lowcpu</profile><!-- Quota for user. --><quota>default</quota></limited_user></users></yandex>
There are also plans to introduce a system of more flexible control over the assignment of resources to different requests.
Also, if these are manually created queries, then you can try to discipline users by adding quotas to them (they can be formulated as “you can read no more than 100GB of data per hour” or “no more than 10 queries”, etc.)
If these are automatically generated queries, it may make sense to check if there is no way to write them in a more efficient way.
5.50 - Load balancers
Load balancers
In general - one of the simplest option to do load balancing is to implement it on the client side.
I.e. list several endpoints for ClickHouse® connections and add some logic to pick one of the nodes.
Many client libraries support that.
ClickHouse native protocol (port 9000)
Currently there are no protocol-aware proxies for ClickHouse protocol, so the proxy / load balancer can work only on TCP level.
One of the best option for TCP load balancer is haproxy, also nginx can work in that mode.
Haproxy will pick one upstream when connection is established, and after that it will keep it connected to the same server until the client or server will disconnect (or some timeout will happen).
It can’t send different queries coming via a single connection to different servers, as he knows nothing about ClickHouse protocol and doesn’t know when one query ends and another start, it just sees the binary stream.
So for native protocol, there are only 3 possibilities:
close connection after each query client-side
close connection after each query server-side (currently there is only one setting for that - idle_connection_timeout=0, which is not exact what you need, but similar).
use a ClickHouse server with Distributed table as a proxy.
HTTP protocol (port 8123)
There are many more options and you can use haproxy / nginx / chproxy, etc.
chproxy give some extra ClickHouse-specific features, you can find a list of them at https://chproxy.org
5.51 - memory configuration settings
memory configuration settings
max_memory_usage. Single query memory usage
max_memory_usage - the maximum amount of memory allowed for a single query to take. By default, it’s 10Gb. The default value is good, don’t adjust it in advance.
There are scenarios when you need to relax the limit for particular queries (if you hit ‘Memory limit (for query) exceeded’), or use a lower limit if you need to discipline the users or increase the number of simultaneous queries.
Server memory usage
Server memory usage = constant memory footprint (used by different caches, dictionaries, etc) + sum of memory temporary used by running queries (a theoretical limit is a number of simultaneous queries multiplied by max_memory_usage).
Since 20.4 you can set up a global limit using the max_server_memory_usage setting. If something will hit that limit you will see ‘Memory limit (total) exceeded’ in random places.
Enable Memory overcommiter instead of ussing max_memory_usage per query
Memory Overcommiter
From version 22.2+ ClickHouse® was updated with enhanced Memory overcommit capabilities
. In the past, queries were constrained by the max_memory_usage setting, imposing a rigid limitation. Users had the option to increase this limit, but it came at the potential expense of impacting other users during a single query. With the introduction of Memory overcommit, more memory-intensive queries can now execute, granted there are ample resources available. When the server reaches its maximum memory limit
, ClickHouse identifies the most overcommitted queries and attempts to terminate them. It’s important to note that the terminated query might not be the one causing the condition. If it’s not, the query will undergo a waiting period to allow the termination of the high-memory query before resuming its execution. This setup ensures that low-memory queries always have the opportunity to run, while more resource-intensive queries can execute during server idle times when resources are abundant. Users have the flexibility to fine-tune this behavior at both the server and user levels.
If the memory overcommitter is not being used you’ll get something like this:
Received exception from server (version 22.8.20):
Code: 241. DB::Exception: Received from altinity.cloud:9440. DB::Exception: Received from chi-replica1-2-0:9000. DB::Exception: Memory limit (for query) exceeded: would use 5.00 GiB (attempt to allocate chunk of 4196736 bytes), maximum: 5.00 GiB. OvercommitTracker decision: Memory overcommit isn't used. OvercommitTracker isn't set.: (avg_value_size_hint= 0, avg_chars_size= 1, limit= 8192): while receiving packet from chi-replica1-1-0:9000: While executing Remote. (MEMORY_LIMIT_EXCEEDED)
So to enable Memory Overcommit you need to get rid of the max_memory_usage and max_memory_usage_for_user (set them to 0) and configure overcommit specific settings (usually defaults are ok, so read carefully the documentation)
memory_overcommit_ratio_denominator: It represents soft memory limit on the user level. This value is used to compute query overcommit ratio.
memory_overcommit_ratio_denominator_for_user: It represents soft memory limit on the global level. This value is used to compute query overcommit ratio.
memory_usage_overcommit_max_wait_microseconds: Maximum time thread will wait for memory to be freed in the case of memory overcommit. If timeout is reached and memory is not freed, exception is thrown
Also you will check/need to configure global memory server setting. These are by default:
<clickhouse><!-- when max_server_memory_usage is set to non-zero, max_server_memory_usage_to_ram_ratio is ignored--><max_server_memory_usage>0</max_server_memory_usage><max_server_memory_usage_to_ram_ratio>0.8</max_server_memory_usage_to_ram_ratio></clickhouse>
With these set, now if you execute some queries with bigger memory needs than your max_server_memory_usage you’ll get something like this:
Received exception from server (version 22.8.20):
Code: 241. DB::Exception: Received from altinity.cloud:9440. DB::Exception: Received from chi-test1-2-0:9000. DB::Exception: Memory limit (total) exceeded: would use 12.60 GiB (attempt to allocate chunk of 4280448 bytes), maximum: 12.60 GiB. OvercommitTracker decision: Query was selected to stop by OvercommitTracker.: while receiving packet from chi-replica1-2-0:9000: While executing Remote. (MEMORY_LIMIT_EXCEEDED)
This will allow you to know that the Overcommit memory tracker is set and working.
Also to note that maybe you don’t need the Memory Overcommit system because with max_memory_usage per query you’re ok.
The good thing about memory overcommit is that you let ClickHouse handle the memory limitations instead of doing it manually, but there may be some scenarios where you don’t want to use it and using max_memory_usage or max_memory_usage_for_user is a better fit. For example, if your workload has a lot of small/medium queries that are not memory intensive and you need to run few memory intensive queries for some users with a fixed memory limit. This is a common scenario for dbt or other ETL tools that usually run big memory intensive queries.
5.53 - Moving a table to another device
Moving a table to another device.
Suppose we mount a new device at path /mnt/disk_1 and want to move table_4 to it.
Create directory on new device for ClickHouse® data. /in shell mkdir /mnt/disk_1/clickhouse
Change ownership of created directory to ClickHouse user. /in shell chown -R clickhouse:clickhouse /mnt/disk_1/clickhouse
Create a special storage policy which should include both disks: old and new. /in shell
nano /etc/clickhouse-server/config.d/storage.xml
###################/etc/clickhouse-server/config.d/storage.xml###########################
<yandex>
<storage_configuration>
<disks>
<!--
default disk is special, it always
exists even if not explicitly
configured here, but you can't change
it's path here (you should use <path>
on top level config instead)
-->
<default>
<!--
You can reserve some amount of free space
on any disk (including default) by adding
keep_free_space_bytes tag
-->
</default>
<disk_1> <!-- disk name -->
<path>/mnt/disk_1/clickhouse/</path>
</disk_1>
</disks>
<policies>
<move_from_default_to_disk_1> <!-- name for new storage policy -->
<volumes>
<default>
<disk>default</disk>
<max_data_part_size_bytes>10000000</max_data_part_size_bytes>
</default>
<disk_1_vol> <!-- name of volume -->
<!--
we have only one disk in that volume
and we reference here the name of disk
as configured above in <disks> section
-->
<disk>disk_1</disk>
</disk_1_vol>
</volumes>
<move_factor>0.99</move_factor>
</move_from_default_to_disk_1>
</policies>
</storage_configuration>
</yandex>
#########################################################################################
Update storage_policy setting of tables to new policy.
Remove ‘default’ disk from new storage policy. In server shell:
nano /etc/clickhouse-server/config.d/storage.xml
###################/etc/clickhouse-server/config.d/storage.xml###########################
<yandex>
<storage_configuration>
<disks>
<!--
default disk is special, it always
exists even if not explicitly
configured here, but you can't change
it's path here (you should use <path>
on top level config instead)
-->
<default>
<!--
You can reserve some amount of free space
on any disk (including default) by adding
keep_free_space_bytes tag
-->
</default>
<disk_1> <!-- disk name -->
<path>/mnt/disk_1/clickhouse/</path>
</disk_1>
</disks>
<policies>
<move_from_default_to_disk_1> <!-- name for new storage policy -->
<volumes>
<disk_1_vol> <!-- name of volume -->
<!--
we have only one disk in that volume
and we reference here the name of disk
as configured above in <disks> section
-->
<disk>disk_1</disk>
</disk_1_vol>
</volumes>
<move_factor>0.99</move_factor>
</move_from_default_to_disk_1>
</policies>
</storage_configuration>
</yandex>
#########################################################################################
ClickHouse wouldn’t auto reload config, because we removed some disks from storage policy, so we need to restart it by hand.
Restart ClickHouse server.
Make sure that storage policy uses the right disks.
ClickHouse provides two options to balance an insert across disks in a volume with more than one disk: round_robin and least_used .
Round Robin (Default):
ClickHouse selects the next disk in a round robin manner to write a part.
This is the default setting and is most effective when parts created on insert are roughly the same size.
Drawbacks: may lead to disk skew
Least Used:
ClickHouse selects the disk with the most available space and writes to that disk.
Changing to least_used when even disk space consumption is desirable or when you have a JBOD volume with differing disk sizes. To prevent hot-spots, it is best to set this policy on a fresh volume or on a volume that has already been (re)balanced.
Drawbacks: may lead to hot-spots
Configurations
Configurations that can affect disk selected:
storage policy volume configuration: least_used_ttl_ms. Only applies to least_used policy, 60s default.
disk setting: keep_free_space_bytes , keep_free_space_ratio
Configuration to assist rebalancing:
The MergeTree setting min_bytes_to_rebalance_partition_over_jbod does not control where data is written during inserts. Instead, it governs how parts are redistributed across disks within the same volume during merge operations.
Note: setting min_bytes_to_rebalance_partition_over_jbod does not guarantee balanced partitions and balanced disk usage.
Following query will select large parts in target_tables and target_databases that can be candidates to move to another disk. Disk chosen should comply with the following requirements:
Should only select valid moves for the same storage_policy used by that table
storage_policy must be JBODs type
moves to other disks in the same volume
select a different disk, i.e not the same disk as the one that part is in
select the disk to move the part to by order of largest free_space on that disk
Set target_tables and target_databases based on requirements.
WITH'%'AStarget_tables,'%'AStarget_databasesSELECTsub.qFROM(SELECT'ALTER TABLE '||parts.database||'.'||parts.`table`||' MOVE PART \'' || parts.name ||'\' TO DISK \'' || other_disk_candidate || '\';'asq,parts.databaseasdb,parts.`table`ast,parts.nameaspart_name,parts.disk_nameaspart_disk_name,parts.bytes_on_diskASpart_bytes_on_disk,sp.storage_policyaspart_storage_policy,arrayJoin(arrayRemove(v.disks,parts.disk_name))ASother_disk_candidate,candidate_disks.free_spaceAScandidate_disk_free_spaceFROMsystem.partsASpartsINNERJOIN(SELECTdatabase,`table`,storage_policyFROMsystem.tableswhere(nameLIKEtarget_tables)AND(databaseLIKEtarget_databases)groupby1,2,3)ASspONsp.`table`=parts.`table`ANDsp.database=parts.databaseINNERJOIN(SELECTpolicy_name,volume_name,disksASdisksFROMsystem.storage_policiesWHEREvolume_type=0)ASvONsp.storage_policy=v.policy_nameINNERJOIN(SELECTname,free_spaceFROMsystem.disksORDERBYfree_spaceDESC)AScandidate_disksONcandidate_disks.name=other_disk_candidateWHEREparts.active=1AND(parts.bytes_on_disk>=10737418240)--10GB prioritize larger parts
AND(parts.`table`LIKEtarget_tables)AND(parts.databaseLIKEtarget_databases)ANDcandidate_disks.free_space>parts.bytes_on_disk*2-- 2x buffer
ORDERBYparts.bytes_on_diskDESC,candidate_disk_free_spaceDESCLIMIT1BYdb,t,part_name)assubFORMATTSVRaw
Moving from a single ClickHouse® server to a clustered format provides several benefits:
Replication guarantees data integrity.
Provides redundancy.
Failover by being able to restart half of the nodes without encountering downtime.
Moving from an unsharded ClickHouse environment to a sharded cluster requires redesign of schema and queries. Starting with a sharded cluster from the beginning makes it easier in the future to scale the cluster up.
Setting up a ClickHouse cluster for a production environment requires the following stages:
Hardware Requirements
Network Configuration
Create Host Names
Monitoring Considerations
Configuration Steps
Setting Up Backups
Staging Plans
Upgrading The Cluster
5.56.1 - Backups
Backups
ClickHouse® is currently at the design stage of creating some universal backup solution. Some custom backup strategies are:
Always add the full contents of the metadata subfolder that contains the current DB schema and ClickHouse configs to your backup.
For a second replica, it’s enough to copy metadata and configuration.
Data in ClickHouse is already compressed with lz4, backup can be compressed bit better, but avoid using cpu-heavy compression algorithms like gzip, use something like zstd instead.
Check the settings in config.xml. Verify that the connection can connect on both IPV4 and IPV6.
5.56.3 - Cluster Configuration Process
Cluster Configuration Process
So you set up 3 nodes with zookeeper (zookeeper1, zookeeper2, zookeeper3 - How to install zookeeper?
), and and 4 nodes with ClickHouse® (clickhouse-sh1r1,clickhouse-sh1r2,clickhouse-sh2r1,clickhouse-sh2r2 - how to install ClickHouse?
). Now we need to make them work together.
Use ansible/puppet/salt or other systems to control the servers’ configurations.
Configure ClickHouse access to Zookeeper by adding the file zookeeper.xml in /etc/clickhouse-server/config.d/ folder. This file must be placed on all ClickHouse servers.
On each server put the file macros.xml in /etc/clickhouse-server/config.d/ folder.
<yandex>
<!--
That macros are defined per server,
and they can be used in DDL, to make the DB schema cluster/server neutral
-->
<macros>
<cluster>prod_cluster</cluster>
<shard>01</shard>
<replica>clickhouse-sh1r1</replica> <!-- better - use the same as hostname -->
</macros>
</yandex>
On each server place the file cluster.xml in /etc/clickhouse-server/config.d/ folder. Before 20.10 ClickHouse will use default user to connect to other nodes (configurable, other users can be used), since 20.10 we recommend to use passwordless intercluster authentication based on common secret (HMAC auth)
<yandex>
<remote_servers>
<prod_cluster> <!-- you need to give a some name for a cluster -->
<!--
<secret>some_random_string, same on all cluster nodes, keep it safe</secret>
-->
<shard>
<internal_replication>true</internal_replication>
<replica>
<host>clickhouse-sh1r1</host>
<port>9000</port>
</replica>
<replica>
<host>clickhouse-sh1r2</host>
<port>9000</port>
</replica>
</shard>
<shard>
<internal_replication>true</internal_replication>
<replica>
<host>clickhouse-sh2r1</host>
<port>9000</port>
</replica>
<replica>
<host>clickhouse-sh2r2</host>
<port>9000</port>
</replica>
</shard>
</prod_cluster>
</remote_servers>
</yandex>
A good practice is to create 2 additional cluster configurations similar to prod_cluster above with the following distinction: but listing all nodes of single shard (all are replicas) and as nodes of 6 different shards (no replicas)
all-replicated: All nodes are listed as replicas in a single shard.
all-sharded: All nodes are listed as separate shards with no replicas.
Once this is complete, other queries that span nodes can be performed. For example:
That will create a table on all servers in the cluster. You can insert data into this table and it will be replicated automatically to the other shards.To store the data or read the data from all shards at the same time, create a Distributed table that links to the replicatedMergeTree table.
Disable or add password for the default users default and readonly if your server is accessible from non-trusted networks.
If you add password to the default user, you will need to adjust cluster configuration, since the other servers need to know the default user’s should know the default user’s to connect to each other.
If you’re inside a trusted network, you can leave default user set to nothing to allow the ClickHouse nodes to communicate with each other.
Modified by a post [on GitHub by Mikhail Filimonov](https://github.com/ClickHouse/ClickHouse/issues/3607#issuecomment-440235298).
The following are recommended Best Practices when it comes to setting up a ClickHouse Cluster with Zookeeper:
Don’t edit/overwrite default configuration files. Sometimes a newer version of ClickHouse introduces some new settings or changes the defaults in config.xml and users.xml.
Set configurations via the extra files in conf.d directory. For example, to overwrite the interface save the file config.d/listen.xml, with the following:
Some parts of configuration will contain repeated elements (like allowed ips for all the users). To avoid repeating that - use substitutions file. By default its /etc/metrika.xml, but you can change it for example to /etc/clickhouse-server/substitutions.xml with the <include_from> section of the main config. Put the repeated parts into substitutions file, like this:
These files can be common for all the servers inside the cluster or can be individualized per server. If you choose to use one substitutions file per cluster, not per node, you will also need to generate the file with macros, if macros are used.
This way you have full flexibility; you’re not limited to the settings described in the template. You can change any settings per server or data center just by assigning files with some settings to that server or server group. It becomes easy to navigate, edit, and assign files.
Other Configuration Recommendations
Other configurations that should be evaluated:
in config.xml: Determines which IP addresses and ports the ClickHouse servers listen for incoming communications.
<max_memory_..> and <max_bytes_before_external_…> in users.xml. These are part of the profile .
<max_execution_time>
<log_queries>
The following extra debug logs should be considered:
part_log
text_log
Understanding The Configuration
ClickHouse configuration stores most of its information in two files:
config.xml: Stores Server configuration parameters
. They are server wide, some are hierarchical , and most of them can’t be changed in runtime. The list of settings to apply without a restart changes from version to version. Some settings can be verified using system tables, for example:
macros (system.macros)
remote_servers (system.clusters)
users.xml: Configure users, and user level / session level settings
.
Each user can change these during their session by:
Using parameter in http query
By using parameter for clickhouse-client
Sending query like set allow_experimental_data_skipping_indices=1.
Those settings and their current values are visible in system.settings. You can make some settings global by editing default profile in users.xml, which does not need restart.
You can forbid users to change their settings by using readonly=2 for that user, or using setting constraints
.
Changes in users.xml are applied w/o restart.
For both config.xml and users.xml, it’s preferable to put adjustments in the config.d and users.d subfolders instead of editing config.xml and users.xml directly.
You can check if the config file was reread by checking /var/lib/clickhouse/preprocessed_configs/ folder.
5.56.4 - Hardware Requirements
Hardware Requirements
ClickHouse®
ClickHouse will use all available hardware to maximize performance. So the more hardware - the better. As of this publication, the hardware requirements are:
Minimum Hardware: 4-core CPU with support of SSE4.2, 16 Gb RAM, 1Tb HDD.
Recommended for development and staging environments.
SSE4.2 is required, and going below 4 Gb of RAM is not recommended.
Recommended Hardware: >=16-cores, >=64Gb RAM, HDD-raid or SSD.
For processing up to hundreds of millions / billions of rows.
For clouds: disk throughput is the more important factor compared to IOPS. Be aware of burst / baseline disk speed difference.
Zookeeper requires separate servers from those used for ClickHouse. Zookeeper has poor performance when installed on the same node as ClickHouse.
Hardware Requirements for Zookeeper:
Fast disk speed (ideally NVMe, 128Gb should be enough).
Any modern CPU (one core, better 2)
4Gb of RAM
For clouds - be careful with burstable network disks (like gp2 on aws): you may need up to 1000 IOPs on the disk for on a long run, so gp3 with 3000 IOPs baseline is a better choice.
The number of Zookeeper instances depends on the environment:
Production: 3 is an optimal number of zookeeper instances.
Development and Staging: 1 zookeeper instance is sufficient.
It’s better to find any performance issues before installing ClickHouse.
5.56.5 - Network Configuration
Network Configuration
Networking And Server Room Planning
The network used for your ClickHouse® cluster should be a fast network, ideally 10 Gbit or more.
ClickHouse nodes generate a lot of traffic to exchange the data between nodes (port 9009 for replication, and 9000 for distributed queries).
Zookeeper traffic in normal circumstances is moderate, but in some special cases can also be very significant.
For the zookeeper low latency is more important than bandwidth.
Keep the replicas isolated on the hardware level. This allows for cluster failover from possible outages.
For Physical Environments: Avoid placing 2 ClickHouse replicas on the same server rack. Ideally, they should be on isolated network switches and an isolated power supply.
For Clouds Environments: Use different availability zones between the ClickHouse replicas when possible (but be aware of the interzone traffic costs)
These considerations are the same as the Zookeeper nodes.
For example:
Rack
Server
Server
Server
Server
Rack 1
CH_SHARD1_R1
CH_SHARD2_R1
CH_SHARD3_R1
ZOO_1
Rack 2
CH_SHARD1_R2
CH_SHARD2_R2
CH_SHARD3_R2
ZOO_2
Rack 3
ZOO3
Network Ports And Firewall
ClickHouse listens the following ports:
9000: clickhouse-client, native clients, other clickhouse-servers connect to here.
8123: HTTP clients
9009: Other replicas will connect here to download data.
Hostnames configured on the server should not change. If you do need to change the host name, one reference to use is How to Change Hostname on Ubuntu 18.04
.
The server should be accessible to other servers in the cluster via it’s hostname. Otherwise you will need to configure interserver_hostname in your config.
Ensure that hostname --fqdn and getent hosts $(hostname --fqdn) return the correct name and ip.
5.57 - System tables ate my disk
When the ClickHouse® SYSTEM database gets out of hand
Note 1: System database stores virtual tables (parts, tables,columns, etc.) and *_log tables.
Virtual tables do not persist on disk. They reflect ClickHouse® memory (c++ structures). They cannot be changed or removed.
Log tables are named with postfix *_log and have the MergeTree engine
. ClickHouse does not use information stored in these tables, this data is for you only.
You can drop / rename / truncate *_log tables at any time. ClickHouse will recreate them in about 7 seconds (flush period).
Note 2: Log tables with numeric postfixes (_1 / 2 / 3 …) query_log_1 query_thread_log_3 are results of ClickHouse upgrades
(or other changes of schemas of these tables). When a new version of ClickHouse starts and discovers that a system log table’s schema is incompatible with a new schema, then ClickHouse renames the old *_log table to the name with the prefix and creates a table with the new schema. You can drop such tables if you don’t need such historic data.
You can disable all / any of them
Do not create log tables at all (a restart is needed for these changes to take effect).
Hint: z_log_disable.xml is named with z_ in the beginning, it means this config will be applied the last and will override all other config files with these sections (config are applied in alphabetical order).
We do not recommend removing query_log as it has very useful information for debugging, and logging can be easily turned off without a restart through user profiles:
$ cat /etc/clickhouse-server/users.d/z_log_queries.xml
<clickhouse>
<profiles>
<default>
<log_queries>0</log_queries> <!-- normally it's better to keep it turned on! -->
</default>
</profiles>
</clickhouse>
You can also configure these settings to reduce the amount of data in the system.query_log table:
name | value | description
----------------------------------+-------------+-------------------------------------------------------------------------------------------------------------------------------------------------------------------
log_queries_min_type | QUERY_START | Minimal type in query_log to log, possible values (from low to high): QUERY_START, QUERY_FINISH, EXCEPTION_BEFORE_START, EXCEPTION_WHILE_PROCESSING.
log_queries_min_query_duration_ms | 0 | Minimal time for the query to run, to get to the query_log/query_thread_log.
log_queries_cut_to_length | 100000 | If query length is greater than specified threshold (in bytes), then cut query when writing to query log. Also limit length of printed query in ordinary text log.
log_profile_events | 1 | Log query performance statistics into the query_log and query_thread_log.
log_query_settings | 1 | Log query settings into the query_log.
log_queries_probability | 1 | Log queries with the specified probabality.
The other system log tables that can be disabled in profiles are:
Example for query_log. It drops partitions with data older than 14 days:
$ cat /etc/clickhouse-server/config.d/query_log_ttl.xml
<?xml version="1.0"?>
<clickhouse>
<query_log replace="1">
<database>system</database>
<table>query_log</table>
<engine>ENGINE = MergeTree PARTITION BY (event_date)
ORDER BY (event_time)
TTL event_date + INTERVAL 14 DAY DELETE
</engine>
<flush_interval_milliseconds>7500</flush_interval_milliseconds>
</query_log>
</clickhouse>
After that you need to restart ClickHouse and if using old clickhouse versions like 20 or less, drop or rename the existing system.query_log table and then CH creates a new table with these settings. This is automatically done in newer versions 21+.
RENAMETABLEsystem.query_logTOsystem.query_log_1;
Important part here is a daily partitioning PARTITION BY (event_date) in this case TTL expression event_date + INTERVAL 14 DAY DELETE expires all rows at the same time. In this case ClickHouse drops whole partitions. Dropping of partitions is very easy operation for CPU / Disk I/O.
Usual TTL processing (when table partitioned by toYYYYMM and TTL by day) is heavy CPU / Disk I/O consuming operation which re-writes data parts without expired rows.
💡 For the clickhouse-operator
, the above method of using only the <engine> tag without <ttl> or <partition> is recommended, because of possible configuration clashes.
After that you need to restart ClickHouse and if using old clickhouse versions like 20 or less, drop or rename the existing system.query_log table and then CH creates a new table with these settings. This is automatically done in newer versions 21+.
5.58 - ClickHouse® Replication problems
Finding and troubleshooting problems in the replication_queue
Common problems & solutions
If the replication queue does not have any Exceptions only postponed reasons without exceptions just leave ClickHouse® do Merges/Mutations and it will eventually catch up and reduce the number of tasks in replication_queue. Number of concurrent merges and fetches can be tuned but if it is done without an analysis of your workload then you may end up in a worse situation. If Delay in queue is going up actions may be needed:
First simplest approach:
try to SYSTEM RESTART REPLICA db.table (This will DETACH/ATTACH table internally)
How to check for replication problems
Check system.replicas first, cluster-wide. It allows to check if the problem is local to some replica or global, and allows to see the exception.
allows to answer the following questions:
Are there any ReadOnly replicas?
Is there the connection to zookeeper active?
Is there the exception during table init? (Code: 999. Coordination::Exception: Transaction failed (No node): Op #1)
Check system.replication_queue.
How many tasks there / are they moving / are there some very old tasks there? (check created_time column, if tasks are 24h old, it is a sign of a problem):
Check if there are tasks with a high number of num_tries or num_postponed and postponed_reason this is a sign of stuck tasks.
Check the problematic parts affecting the stuck tasks. You can use columns new_part_name or parts_to_merge
Check which type is the task. If it is MUTATE_PART then it is a mutation task. If it is MERGE_PARTS then it is a merge task. These tasks can be deleted from the replication queue but GET_PARTS should not be deleted.
Check system.errors
Check system.mutations:
You can check that in the replication queue are stuck tasks of type MUTATE_PART, and that those mutations are still executing system.mutations using column is_done
Find the moment when the problem started and collect/analyze / preserve logs from that moment. It is usually during the first steps of a restart/crash
Use part_log and system.parts to gather information of the parts related with the stuck tasks in the replication queue:
Check if those parts exist and are active from system.parts (use partition_id, name as part and active columns to filter)
If there are no errors, just everything get slower - check the load (usual system metrics)
Some stuck replication task for a partition that was already removed or has no data
This can be easily detected because some exceptions will be in the replication queue that reference a part from a partition that do not exist. Here the most probable scenario is that the partition was dropped and some tasks were left in the queue.
drop the partition manually once again (it should remove the task)
If the partition exists but the part is missing (maybe because it is superseded by a newer merged part) then you can try to DETACH/ATTACH the partition.
Below DML generates the ALTER commands to do this:
This can happen if the mutation is finished and, for some reason, the task is not removed from the queue. This can be detected by checking system.mutations table and seeing if the mutation is done, but the task is still in the queue.
kill the mutation (again)
Replica is not starting because local set of files differs too much
Sometimes, due to crashes, zookeeper unavailability, slowness, or other reasons, some of the tables can be in Read-Only mode. This allows SELECTS but not INSERTS. So we need to do DROP / RESTORE replica procedure.
Just to be clear, this procedure will not delete any data, it will just re-create the metadata in zookeeper with the current state of the ClickHouse replica
.
How it works:
ALTERTABLEtable_nameDROPDETACHEDPARTITIONALL-- clean detached folder before operation. PARTITION ALL works only for the fresh clickhouse versions
DETACHTABLEtable_name;-- Required for DROP REPLICA
-- Use the zookeeper_path and replica_name from system.replicas.
SYSTEMDROPREPLICA'replica_name'FROMZKPATH'/table_path_in_zk';-- It will remove everything from the /table_path_in_zk/replicas/replica_name
ATTACHTABLEtable_name;-- Table will be in readonly mode, because there is no metadata in ZK and after that execute
SYSTEMRESTOREREPLICAtable_name;-- It will detach all partitions, re-create metadata in ZK (like it's new empty table), and then attach all partitions back
SYSTEMSYNCREPLICAtable_name;-- Not mandatory. It will Wait for replicas to synchronize parts. Also it's recommended to check `system.detached_parts` on all replicas after recovery is finished.
SELECTnameFROMsystem.detached_partsWHEREtable='table_name';-- check for leftovers. See the potential problems here https://altinity.com/blog/understanding-detached-parts-in-clickhouse
Starting from version 23, it’s possible to use syntax SYSTEM DROP REPLICA 'replica_name' FROM TABLE db.table
instead of the ZKPATH variant, but you need to execute the above command from a different replica than the one you want to drop, which is not convenient sometimes. We recommend using the above method because it works with any version and is more reliable.
Procedure to restore multiple tables in Read-Only mode per replica
It is better to make an approach per replica, because restoring a replica using ON CLUSTER could lead to race conditions that would cause errors and a big stress in zookeeper/keeper
SELECT'-- Table '||toString(row_num)||'\n'||'DETACH TABLE `'||database||'`.`'||table||'`;\n'||'SYSTEM DROP REPLICA '''||replica_name||''' FROM ZKPATH '''||zookeeper_path||''';\n'||'ATTACH TABLE `'||database||'`.`'||table||'`;\n'||'SYSTEM RESTORE REPLICA `'||database||'`.`'||table||'`;\n'FROM(SELECT*,rowNumberInAllBlocks()+1asrow_numFROM(SELECTdatabase,table,any(replica_name)asreplica_name,any(zookeeper_path)aszookeeper_pathFROMsystem.replicasWHEREis_readonlyGROUPBYdatabase,tableORDERBYdatabase,table)ORDERBYdatabase,table)FORMATTSVRaw;
This will generate the DDL statements to be executed per replica and generate an ouput that can be saved as an SQL file . It is important to execute the commands per replica in the sequence generated by the above DDL:
DETACH the table
DROP REPLICA
ATTACH the table
RESTORE REPLICA
If we do this in parallel a table could still be attaching while another query is dropping/restoring the replica in zookeeper, causing errors.
The following bash script will read the generated SQL file and execute the commands sequentially, asking for user input in case of errors. Simply save the generated SQL to a file (e.g. recovery_commands.sql) and run the script below (that you can name as clickhouse_replica_recovery.sh):
#!/bin/bash
# ClickHouse Replica Recovery Script# This script executes DETACH, DROP REPLICA, ATTACH, and RESTORE REPLICA commands sequentially# ConfigurationCLICKHOUSE_HOST="${CLICKHOUSE_HOST:-localhost}"CLICKHOUSE_PORT="${CLICKHOUSE_PORT:-9000}"CLICKHOUSE_USER="${CLICKHOUSE_USER:-clickhouse_operator}"CLICKHOUSE_PASSWORD="${CLICKHOUSE_PASSWORD:-xxxxxxxxx}"COMMANDS_FILE="${1:-recovery_commands.sql}"LOG_FILE="recovery_$(date +%Y%m%d_%H%M%S).log"# Colors for outputRED='\033[0;31m'GREEN='\033[0;32m'YELLOW='\033[1;33m'BLUE='\033[0;34m'MAGENTA='\033[0;35m'NC='\033[0m'# No Color# Function to log messageslog(){echo -e "[$(date '+%Y-%m-%d %H:%M:%S')] $1"| tee -a "$LOG_FILE"}# Function to execute a SQL statement with retry logicexecute_sql(){localsql="$1"localtable_num="$2"localstep_name="$3"while true;do log "${YELLOW}Executing command for Table $table_num - $step_name:${NC}" log "$sql"# Build clickhouse-client commandlocalch_cmd="clickhouse-client --host=$CLICKHOUSE_HOST --port=$CLICKHOUSE_PORT --user=$CLICKHOUSE_USER"if[ -n "$CLICKHOUSE_PASSWORD"];thench_cmd="$ch_cmd --password=$CLICKHOUSE_PASSWORD"fi# Execute the command and capture output and exit codelocal output
local exit_code
output=$(echo"$sql"|$ch_cmd 2>&1)exit_code=$?# Log the outputecho"$output"| tee -a "$LOG_FILE"if[$exit_code -eq 0];then log "${GREEN}✓ Successfully executed${NC}"return0else log "${RED}✗ Failed to execute (Exit code: $exit_code)${NC}" log "${RED}Error output: $output${NC}"# Ask user what to dowhile true;doecho"" log "${MAGENTA}========================================${NC}" log "${MAGENTA}Error occurred! Choose an option:${NC}" log "${MAGENTA}========================================${NC}"echo -e "${YELLOW}[R]${NC} - Retry this command"echo -e "${YELLOW}[I]${NC} - Ignore this error and continue to next command in this table"echo -e "${YELLOW}[S]${NC} - Skip this entire table and move to next table"echo -e "${YELLOW}[A]${NC} - Abort script execution"echo""echo -n "Enter your choice (R/I/S/A): "# Read from /dev/tty to get user input from terminalread -r response < /dev/tty
case"${response^^}" in
R|RETRY) log "${BLUE}Retrying command...${NC}"break# Break inner loop to retry;; I|IGNORE) log "${YELLOW}Ignoring error and continuing to next command...${NC}"return1# Return error but continue;; S|SKIP) log "${YELLOW}Skipping entire table $table_num...${NC}"return2# Return special code to skip table;; A|ABORT) log "${RED}Aborting script execution...${NC}"exit1;; *)echo -e "${RED}Invalid option '$response'. Please enter R, I, S, or A.${NC}";;esacdonefidone}# Main execution functionmain(){ log "${BLUE}========================================${NC}" log "${BLUE}ClickHouse Replica Recovery Script${NC}" log "${BLUE}========================================${NC}" log "Host: $CLICKHOUSE_HOST:$CLICKHOUSE_PORT" log "User: $CLICKHOUSE_USER" log "Commands file: $COMMANDS_FILE" log "Log file: $LOG_FILE"echo""# Check if commands file existsif[ ! -f "$COMMANDS_FILE"];then log "${RED}Error: Commands file '$COMMANDS_FILE' not found!${NC}"echo""echo"Usage: $0 [commands_file]"echo" commands_file: Path to SQL commands file (default: recovery_commands.sql)"echo""echo"Example: $0 my_commands.sql"exit1fi# Process SQL commands from filelocalcurrent_sql=""localtable_counter=0localstep_in_table=0localfailed_count=0localsuccess_count=0localignored_count=0localskipped_tables=()localskip_current_table=falsewhileIFS=read -r line ||[ -n "$line"];do# Skip empty linesif[[ -z "$line"]]||[["$line"=~ ^[[:space:]]*$ ]];thencontinuefi# Check if this is a comment line indicating a new tableif[["$line"=~ ^[[:space:]]*--[[:space:]]*Table[[:space:]]+([0-9]+)]];thentable_counter="${BASH_REMATCH[1]}"step_in_table=0skip_current_table=false log "" log "${BLUE}========================================${NC}" log "${BLUE}Processing Table $table_counter${NC}" log "${BLUE}========================================${NC}"continueelif[["$line"=~ ^[[:space:]]*-- ]];then# Skip other comment linescontinuefi# Skip if we're skipping this tableif["$skip_current_table"=true];then# Check if line ends with semicolon to count statementsif[["$line"=~ \;[[:space:]]*$ ]];thenstep_in_table=$((step_in_table +1))ficontinuefi# Accumulate the SQL statementcurrent_sql+="$line "# Check if we have a complete statement (ends with semicolon)if[["$line"=~ \;[[:space:]]*$ ]];thenstep_in_table=$((step_in_table +1))# Determine the step namelocalstep_name=""if[["$current_sql"=~ ^[[:space:]]*DETACH ]];thenstep_name="DETACH"elif[["$current_sql"=~ ^[[:space:]]*SYSTEM[[:space:]]+DROP[[:space:]]+REPLICA ]];thenstep_name="DROP REPLICA"elif[["$current_sql"=~ ^[[:space:]]*ATTACH ]];thenstep_name="ATTACH"elif[["$current_sql"=~ ^[[:space:]]*SYSTEM[[:space:]]+RESTORE[[:space:]]+REPLICA ]];thenstep_name="RESTORE REPLICA"fi log "" log "Step $step_in_table/4: $step_name"# Execute the statementlocal result
execute_sql "$current_sql""$table_counter""$step_name"result=$?if[$result -eq 0];thensuccess_count=$((success_count +1)) sleep 1# Small delay between commandselif[$result -eq 1];then# User chose to ignore this errorfailed_count=$((failed_count +1))ignored_count=$((ignored_count +1)) sleep 1elif[$result -eq 2];then# User chose to skip this tableskip_current_table=trueskipped_tables+=("$table_counter") log "${YELLOW}Skipping remaining commands for Table $table_counter${NC}"fi# Reset current_sql for next statementcurrent_sql=""fidone < "$COMMANDS_FILE"# Summary log "" log "${BLUE}========================================${NC}" log "${BLUE}Execution Summary${NC}" log "${BLUE}========================================${NC}" log "Total successful commands: ${GREEN}$success_count${NC}" log "Total failed commands: ${RED}$failed_count${NC}" log "Total ignored errors: ${YELLOW}$ignored_count${NC}" log "Total tables processed: $table_counter"if[${#skipped_tables[@]} -gt 0];then log "Skipped tables: ${YELLOW}${skipped_tables[*]}${NC}"fi log "Log file: $LOG_FILE"if[$failed_count -eq 0];then log "${GREEN}All commands executed successfully!${NC}"exit0else log "${YELLOW}Some commands failed or were ignored. Please check the log file.${NC}"exit1fi}# Run the main functionmain
migrate is a simple schema migration tool written in golang. No external dependencies are required (like interpreter, jre), only one platform-specific executable. golang-migrate/migrate
migrate supports several databases, including ClickHouse® (support was introduced by @kshvakov
).
To store information about migrations state migrate creates one additional table in target database, by default that table is called schema_migrations.
Install
download
the migrate executable for your platform and put it to the folder listed in your %PATH.
When running migrations migrate actually uses database from query settings and encapsulate database.table as table name: ``other_database.`database.table```
5.61 - Settings to adjust
Settings to adjust
query_log and other _log tables - set up TTL, or some other cleanup procedures.
cat /etc/clickhouse-server/config.d/query_log.xml
<clickhouse>
<query_log replace="1">
<database>system</database>
<table>query_log</table>
<flush_interval_milliseconds>7500</flush_interval_milliseconds>
<engine>
ENGINE = MergeTree
PARTITION BY event_date
ORDER BY (event_time)
TTL event_date + interval 90 day
SETTINGS ttl_only_drop_parts=1
</engine>
</query_log>
</clickhouse>
query_thread_log - typically is not too useful for end users, you can disable it (or set up TTL).
We do not recommend removing this table completely as you might need it for debug one day and the threads’ logging can be easily disabled/enabled without a restart through user profiles:
quite often you want to create more users with different limitations.
The most typical is <max_execution_time>
It’s actually also not a way to plan/share existing resources better, but it at least disciplines users.
You can find the preset example here
.
Also, force_index_by_date + force_primary_key can be a nice idea to avoid queries that ‘accidentally’ do full scans, max_concurrent_queries_for_user
merge_tree settings: max_bytes_to_merge_at_max_space_in_pool (may be reduced in some scenarios), inactive_parts_to_throw_insert - can be enabled, replicated_deduplication_window - can be extended if single insert create lot of parts , merge_with_ttl_timeout - when you use ttl
insert_distributed_sync - for small clusters you may sometimes want to enable it
when the durability is the main requirement (or server / storage is not stable) - you may want to enable fsync_* setting (impacts the write performance significantly!!), and insert_quorum
If you use FINAL queries - usually you want to enable do_not_merge_across_partitions_select_final
Run sync replica query in related shard replicas (others than the one you remove) via query:
SYSTEMSYNCREPLICAdb.table;
Shutdown server.
SYSTEM SHUTDOWN query by default doesn’t wait until query completion and tries to kill all queries immediately after receiving signal, if you want to change this behavior, you need to enable setting shutdown_wait_unfinished_queries.
ClickHouse doesn’t probe CA path which is default on CentOS and Amazon Linux.
ClickHouse client
cat /etc/clickhouse-client/conf.d/openssl-ca.xml
<config>
<openSSL>
<client> <!-- Used for connection to server's secure tcp port -->
<caConfig>/etc/ssl/certs</caConfig>
</client>
</openSSL>
</config>
ClickHouse server
cat /etc/clickhouse-server/conf.d/openssl-ca.xml
<config>
<openSSL>
<server> <!-- Used for https server AND secure tcp port -->
<caConfig>/etc/ssl/certs</caConfig>
</server>
<client> <!-- Used for connecting to https dictionary source and secured Zookeeper communication -->
<caConfig>/etc/ssl/certs</caConfig>
</client>
</openSSL>
</config>
clickhouse fails to start with a message DB::Exception: Suspiciously many broken parts to remove.
Cause:
That exception is just a safeguard check/circuit breaker, triggered when clickhouse detects a lot of broken parts during server startup.
Parts are considered broken if they have bad checksums or some files are missing or malformed. Usually, that means the data was corrupted on the disk.
Why data could be corrupted?
the most often reason is a hard restart of the system, leading to a loss of the data which was not fully flushed to disk from the system page cache. Please be aware that by default ClickHouse doesn’t do fsync, so data is considered inserted after it was passed to the Linux page cache. See fsync-related settings in ClickHouse.
it can also be caused by disk failures, maybe there are bad blocks on hard disk, or logical problems, or some raid issue. Check system journals, use fsck / mdadm and other standard tools to diagnose the disk problem.
other reasons: manual intervention/bugs etc, for example, the data files or folders are removed by mistake or moved to another folder.
Action:
If you are ok to accept the data loss
: set up force_restore_data flag and clickhouse will move the parts to detached. Data loss is possible if the issue is a result of misconfiguration (i.e. someone accidentally has fixed xml configs with incorrect shard/replica macros
, data will be moved to detached folder and can be recovered).
then restart clickhouse. the table will be attached, and the broken parts will be detached, which means the data from those parts will not be available for the selects. You can see the list of those parts in the system.detached_parts table and drop them if needed using ALTER TABLE ... DROP DETACHED PART ... commands.
If you are ok to tolerate bigger losses automatically you can change that safeguard configuration to be less sensitive by increasing max_suspicious_broken_parts setting:
If you can’t accept the data loss - you should recover data from backups / re-insert it once again etc.
If you don’t want to tolerate automatic detaching of broken parts, you can set max_suspicious_broken_parts_bytes and max_suspicious_broken_parts to 0.
Scenario illustrating / testing
Create table
create table t111(A UInt32) Engine=MergeTree order by A settings max_suspicious_broken_parts=1;
insert into t111 select number from numbers(100000);
Detach the table and make Data corruption
detach table t111;
cd /var/lib/clickhouse/data/default/t111/all_***
make data file corruption:
> data.bin
repeat for 2 or more data files.
Attach the table:
attach table t111;
Received exception from server (version 21.12.3):
Code: 231. DB::Exception: Received from localhost:9000. DB::Exception: Suspiciously many (2) broken parts to remove.. (TOO_MANY_UNEXPEC
setup force_restore_data flag
sudo -u clickhouse touch /var/lib/clickhouse/flags/force_restore_data
sudo service clickhouse-server restart
then the table t111 will be attached, losing the corrupted data.
Thread counts by type (using ps & clickhouse-local)
ps H -o 'tid comm'$(pidof -s clickhouse-server)| tail -n +2 | awk '{ printf("%s\t%s\n", $1, $2) }'| clickhouse-local -S "threadid UInt16, name String" -q "SELECT name, count() FROM table GROUP BY name WITH TOTALS ORDER BY count() DESC FORMAT PrettyCompact"
echo" Merges Processes PrimaryK TempTabs Dicts";\
for i in `seq 1 600`;do clickhouse-client --empty_result_for_aggregation_by_empty_set=0 -q "select \
(select leftPad(formatReadableSize(sum(memory_usage)),15, ' ') from system.merges)||
(select leftPad(formatReadableSize(sum(memory_usage)),15, ' ') from system.processes)||
(select leftPad(formatReadableSize(sum(primary_key_bytes_in_memory_allocated)),15, ' ') from system.parts)|| \
(select leftPad(formatReadableSize(sum(total_bytes)),15, ' ') from system.tables \
WHERE engine IN ('Memory','Set','Join'))||
(select leftPad(formatReadableSize(sum(bytes_allocated)),15, ' ') FROM system.dictionaries)
"; sleep 3;done Merges Processes PrimaryK TempTabs Dicts
0.00 B 0.00 B 21.36 MiB 1.58 GiB 911.07 MiB
0.00 B 0.00 B 21.36 MiB 1.58 GiB 911.07 MiB
0.00 B 0.00 B 21.35 MiB 1.58 GiB 911.07 MiB
0.00 B 0.00 B 21.36 MiB 1.58 GiB 911.07 MiB
retrospection analysis of the RAM usage based on query_log and part_log (shows peaks)
WITHnow()-INTERVAL24HOURASmin_time,-- you can adjust that
now()ASmax_time,-- you can adjust that
INTERVAL1HOURastime_frame_sizeSELECTtoStartOfInterval(event_timestamp,time_frame_size)astimeframe,formatReadableSize(max(mem_overall))aspeak_ram,formatReadableSize(maxIf(mem_by_type,event_type='Insert'))asinserts_ram,formatReadableSize(maxIf(mem_by_type,event_type='Select'))asselects_ram,formatReadableSize(maxIf(mem_by_type,event_type='MergeParts'))asmerge_ram,formatReadableSize(maxIf(mem_by_type,event_type='MutatePart'))asmutate_ram,formatReadableSize(maxIf(mem_by_type,event_type='Alter'))asalter_ram,formatReadableSize(maxIf(mem_by_type,event_type='Create'))ascreate_ram,formatReadableSize(maxIf(mem_by_type,event_typenotIN('Insert','Select','MergeParts','MutatePart','Alter','Create')))asother_types_ram,groupUniqArrayIf(event_type,event_typenotIN('Insert','Select','MergeParts','MutatePart','Alter','Create'))asother_typesFROM(SELECTtoDateTime(toUInt32(ts))asevent_timestamp,tasevent_type,SUM(mem)OVER(PARTITIONBYtORDERBYts)asmem_by_type,SUM(mem)OVER(ORDERBYts)asmem_overallFROM(WITHarrayJoin([(toFloat64(event_time_microseconds)-(duration_ms/1000),toInt64(peak_memory_usage)),(toFloat64(event_time_microseconds),-peak_memory_usage)])ASdataSELECTCAST(event_type,'LowCardinality(String)')ast,data.1asts,data.2asmemFROMsystem.part_logWHEREevent_timeBETWEENmin_timeANDmax_timeANDpeak_memory_usage!=0UNIONALLWITHarrayJoin([(toFloat64(query_start_time_microseconds),toInt64(memory_usage)),(toFloat64(event_time_microseconds),-memory_usage)])ASdataSELECTquery_kind,data.1asts,data.2asmemFROMsystem.query_logWHEREevent_timeBETWEENmin_timeANDmax_timeANDmemory_usage!=0UNIONALLWITHarrayJoin([(toFloat64(event_time_microseconds)-(view_duration_ms/1000),toInt64(peak_memory_usage)),(toFloat64(event_time_microseconds),-peak_memory_usage)])ASdataSELECTCAST(toString(view_type)||'View','LowCardinality(String)')ast,data.1asts,data.2asmemFROMsystem.query_views_logWHEREevent_timeBETWEENmin_timeANDmax_timeANDpeak_memory_usage!=0))GROUPBYtimeframeORDERBYtimeframeFORMATPrettyCompactMonoBlock;
retrospection analysis of trace_log
WITHnow()-INTERVAL24HOURASmin_time,-- you can adjust that
now()ASmax_time-- you can adjust that
SELECTtrace_type,count(),topK(20)(query_id)FROMsystem.trace_logWHEREevent_timeBETWEENmin_timeANDmax_timeGROUPBYtrace_type;SELECTt,count()ASqueries,formatReadableSize(sum(peak_size))ASsum_of_peaks,formatReadableSize(max(peak_size))ASbiggest_query_peak,argMax(query_id,peak_size)ASqueryFROM(SELECTtoStartOfInterval(event_time,toIntervalMinute(5))ASt,query_id,max(size)ASpeak_sizeFROMsystem.trace_logWHERE(trace_type='MemoryPeak')AND(event_time>(now()-toIntervalHour(24)))GROUPBYt,query_id)GROUPBYtORDERBYtASC;-- later on you can check particular query_ids in query_log
5.67 - X rows of Y total rows in filesystem are suspicious
X rows of Y total rows in filesystem are suspicious
Warning
The local set of parts of table doesn’t look like the set of parts in ZooKeeper. 100.00 rows of 150.00 total rows in filesystem are suspicious. There are 1 unexpected parts with 100 rows (1 of them is not just-written with 100 rows), 0 missing parts (with 0 blocks).: Cannot attach table.
ClickHouse has a registry of parts in ZooKeeper.
And during the start ClickHouse compares that list of parts on a local disk is consistent with a list in ZooKeeper. If the lists are too different ClickHouse denies to start because it could be an issue with settings, wrong Shard or wrong Replica macros. But this safe-limiter throws an exception if the difference is more 50% (in rows).
In your case the table is very small and the difference >50% ( 100.00 vs 150.00 ) is only a single part mismatch, which can be the result of hard restart.
After manipulation with storage_policies and disks
When storage policy changes (one disk was removed from it), ClickHouse compared parts on disk and this replica state in ZooKeeper and found out that a lot of parts (from removed disk) disappeared. So ClickHouse removed them from the replica state in ZooKeeper and scheduled to fetch them from other replicas.
After we add the removed disk to storage_policy back, ClickHouse finds missing parts, but at this moment they are not registered for that replica.
ClickHouse produce error message like this:
Warning
Application: DB::Exception: The local set of parts of table default.tbl doesn’t look like the set of parts in ZooKeeper: 14.96 billion rows of 16.24 billion total rows in filesystem are suspicious. There are 45 unexpected parts with 14960302620 rows (43 of them is not just-written with 14959824636 rows), 0 missing parts (with 0 blocks).: Cannot attach table default.tbl from metadata file /var/lib/clickhouse/metadata/default/tbl.sql from query ATTACH TABLE default.tbl … ENGINE=ReplicatedMergeTree(’/clickhouse/tables/0/default/tbl’, ‘replica-0’)… SETTINGS index_granularity = 1024, storage_policy = ’ebs_hot_and_cold’: while loading database default from path /var/lib/clickhouse/metadata/data
At this point, it’s possible to either tune setting replicated_max_ratio_of_wrong_parts or do force restore, but it will end up downloading all “missing” parts from other replicas, which can take a lot of time for big tables.
ClickHouse 21.7+
Rename table SQL attach script in order to prevent ClickHouse from attaching it at startup.
SYSTEM DROP REPLICA 'replica-0' FROM ZKPATH '/clickhouse/tables/0/default/tbl';
SELECT * FROM system.zookeeper WHERE path = '/clickhouse/tables/0/default/tbl/replicas';
Rename table SQL attach script back to normal name.
Side note:
in many cases, the slowness of the zookeeper is actually a symptom of some issue with ClickHouse® schema/usage pattern (the most typical issues: an enormous number of partitions/tables/databases with real-time inserts, tiny & frequent inserts).
Here are some common problems you can avoid by configuring ZooKeeper correctly:
inconsistent lists of servers : The list of ZooKeeper servers used by the clients must match the list of ZooKeeper servers that each ZooKeeper server has. Things work okay if the client list is a subset of the real list, but things will really act strange if clients have a list of ZooKeeper servers that are in different ZooKeeper clusters. Also, the server lists in each Zookeeper server configuration file should be consistent with one another.
incorrect placement of transaction log : The most performance critical part of ZooKeeper is the transaction log. ZooKeeper syncs transactions to media before it returns a response. A dedicated transaction log device is key to consistent good performance. Putting the log on a busy device will adversely affect performance. If you only have one storage device, increase the snapCount so that snapshot files are generated less often; it does not eliminate the problem, but it makes more resources available for the transaction log.
incorrect Java heap size : You should take special care to set your Java max heap size correctly. In particular, you should not create a situation in which ZooKeeper swaps to disk. The disk is death to ZooKeeper. Everything is ordered, so if processing one request swaps the disk, all other queued requests will probably do the same. the disk. DON’T SWAP. Be conservative in your estimates: if you have 4G of RAM, do not set the Java max heap size to 6G or even 4G. For example, it is more likely you would use a 3G heap for a 4G machine, as the operating system and the cache also need memory. The best and only recommend practice for estimating the heap size your system needs is to run load tests, and then make sure you are well below the usage limit that would cause the system to swap.
Publicly accessible deployment : A ZooKeeper ensemble is expected to operate in a trusted computing environment. It is thus recommended to deploy ZooKeeper behind a firewall.
An init.d script for clickhouse-keeper.
This example is based on zkServer.sh
#!/bin/bash
### BEGIN INIT INFO# Provides: clickhouse-keeper# Default-Start: 2 3 4 5# Default-Stop: 0 1 6# Required-Start:# Required-Stop:# Short-Description: Start keeper daemon# Description: Start keeper daemon### END INIT INFONAME=clickhouse-keeper
ZOOCFGDIR=/etc/$NAMEZOOCFG="$ZOOCFGDIR/keeper.xml"ZOO_LOG_DIR=/var/log/$NAMEUSER=clickhouse
GROUP=clickhouse
ZOOPIDDIR=/var/run/$NAMEZOOPIDFILE=$ZOOPIDDIR/$NAME.pid
SCRIPTNAME=/etc/init.d/$NAME#echo "Using config: $ZOOCFG" >&2ZOOCMD="clickhouse-keeper -C ${ZOOCFG} start --daemon"# ensure PIDDIR exists, otw stop will failmkdir -p "$(dirname "$ZOOPIDFILE")"if[ ! -w "$ZOO_LOG_DIR"];thenmkdir -p "$ZOO_LOG_DIR"ficase$1 in
start)echo -n "Starting keeper ... "if[ -f "$ZOOPIDFILE"];thenifkill -0 `cat "$ZOOPIDFILE"` > /dev/null 2>&1;thenecho already running as process `cat "$ZOOPIDFILE"`.
exit0fifi sudo -u clickhouse `echo"$ZOOCMD"`if[$? -eq 0]then pgrep -f "$ZOOCMD" > "$ZOOPIDFILE"echo"PID:"`cat $ZOOPIDFILE`if[$? -eq 0];then sleep 1echo STARTED
elseecho FAILED TO WRITE PID
exit1fielseecho SERVER DID NOT START
exit1fi;;start-foreground) sudo -u clickhouse clickhouse-keeper -C "$ZOOCFG" start
;;print-cmd)echo"sudo -u clickhouse ${ZOOCMD}";;stop)echo -n "Stopping keeper ... "if[ ! -f "$ZOOPIDFILE"]thenecho"no keeper to stop (could not find file $ZOOPIDFILE)"elseZOOPID=$(cat "$ZOOPIDFILE")echo$ZOOPIDkill$ZOOPIDwhile true;do sleep 3ifkill -0 $ZOOPID > /dev/null 2>&1;thenecho$ZOOPID is still running
elsebreakfidone rm "$ZOOPIDFILE"echo STOPPED
fiexit0;;restart)shift"$0" stop ${@} sleep 3"$0" start ${@};;status)clientPortAddress="localhost"clientPort=2181STAT=`echo srvr | nc $clientPortAddress$clientPort 2> /dev/null | grep Mode`if["x$STAT"="x"]thenecho"Error contacting service. It is probably not running."exit1elseecho$STATexit0fi;;*)echo"Usage: $0 {start|start-foreground|stop|restart|status|print-cmd}" >&2esac
5.68.2 - clickhouse-keeper-service
clickhouse-keeper-service
clickhouse-keeper-service
installation
Need to install clickhouse-common-static + clickhouse-keeper OR clickhouse-common-static + clickhouse-server.
Both OK, use the first if you don’t need ClickHouse® server locally.
cat /etc/clickhouse-keeper/config.xml
<?xml version="1.0"?>
<clickhouse>
<logger>
<!-- Possible levels [1]:
- none (turns off logging)
- fatal
- critical
- error
- warning
- notice
- information
- debug
- trace
- test (not for production usage)
[1]: https://github.com/pocoproject/poco/blob/poco-1.9.4-release/Foundation/include/Poco/Logger.h#L105-L114
-->
<level>trace</level>
<log>/var/log/clickhouse-keeper/clickhouse-keeper.log</log>
<errorlog>/var/log/clickhouse-keeper/clickhouse-keeper.err.log</errorlog>
<!-- Rotation policy
See https://github.com/pocoproject/poco/blob/poco-1.9.4-release/Foundation/include/Poco/FileChannel.h#L54-L85
-->
<size>1000M</size>
<count>10</count>
<!-- <console>1</console> --> <!-- Default behavior is autodetection (log to console if not daemon mode and is tty) -->
<!-- Per level overrides (legacy):
For example to suppress logging of the ConfigReloader you can use:
NOTE: levels.logger is reserved, see below.
-->
<!--
<levels>
<ConfigReloader>none</ConfigReloader>
</levels>
-->
<!-- Per level overrides:
For example to suppress logging of the RBAC for default user you can use:
(But please note that the logger name maybe changed from version to version, even after minor upgrade)
-->
<!--
<levels>
<logger>
<name>ContextAccess (default)</name>
<level>none</level>
</logger>
<logger>
<name>DatabaseOrdinary (test)</name>
<level>none</level>
</logger>
</levels>
-->
<!-- Structured log formatting:
You can specify log format(for now, JSON only). In that case, the console log will be printed
in specified format like JSON.
For example, as below:
{"date_time":"1650918987.180175","thread_name":"#1","thread_id":"254545","level":"Trace","query_id":"","logger_name":"BaseDaemon","message":"Received signal 2","source_file":"../base/daemon/BaseDaemon.cpp; virtual void SignalListener::run()","source_line":"192"}
To enable JSON logging support, just uncomment <formatting> tag below.
-->
<!-- <formatting>json</formatting> -->
</logger>
<!-- Listen specified address.
Use :: (wildcard IPv6 address), if you want to accept connections both with IPv4 and IPv6 from everywhere.
Notes:
If you open connections from wildcard address, make sure that at least one of the following measures applied:
- server is protected by firewall and not accessible from untrusted networks;
- all users are restricted to subset of network addresses (see users.xml);
- all users have strong passwords, only secure (TLS) interfaces are accessible, or connections are only made via TLS interfaces.
- users without password have readonly access.
See also: https://www.shodan.io/search?query=clickhouse
-->
<!-- <listen_host>::</listen_host> -->
<!-- Same for hosts without support for IPv6: -->
<!-- <listen_host>0.0.0.0</listen_host> -->
<!-- Default values - try listen localhost on IPv4 and IPv6. -->
<!--
<listen_host>::1</listen_host>
<listen_host>127.0.0.1</listen_host>
-->
<!-- <interserver_listen_host>::</interserver_listen_host> -->
<!-- Listen host for communication between replicas. Used for data exchange -->
<!-- Default values - equal to listen_host -->
<!-- Don't exit if IPv6 or IPv4 networks are unavailable while trying to listen. -->
<!-- <listen_try>0</listen_try> -->
<!-- Allow multiple servers to listen on the same address:port. This is not recommended.
-->
<!-- <listen_reuse_port>0</listen_reuse_port> -->
<!-- <listen_backlog>4096</listen_backlog> -->
<path>/var/lib/clickhouse-keeper/</path>
<core_path>/var/lib/clickhouse-keeper/cores</core_path>
<keeper_server>
<tcp_port>2181</tcp_port>
<server_id>1</server_id>
<log_storage_path>/var/lib/clickhouse-keeper/coordination/log</log_storage_path>
<snapshot_storage_path>/var/lib/clickhouse-keeper/coordination/snapshots</snapshot_storage_path>
<coordination_settings>
<operation_timeout_ms>10000</operation_timeout_ms>
<session_timeout_ms>30000</session_timeout_ms>
<raft_logs_level>trace</raft_logs_level>
<rotate_log_storage_interval>10000</rotate_log_storage_interval>
</coordination_settings>
<raft_configuration>
<server>
<id>1</id>
<hostname>localhost</hostname>
<port>9444</port>
</server>
</raft_configuration>
</keeper_server>
</clickhouse>
cat /lib/systemd/system/clickhouse-keeper.service
[Unit]
Description=ClickHouse Keeper (analytic DBMS for big data)
Requires=network-online.target
# NOTE: that After/Wants=time-sync.target is not enough, you need to ensure
# that the time was adjusted already, if you use systemd-timesyncd you are
# safe, but if you use ntp or some other daemon, you should configure it
# additionaly.
After=time-sync.target network-online.target
Wants=time-sync.target
[Service]
Type=simple
User=clickhouse
Group=clickhouse
Restart=always
RestartSec=30
RuntimeDirectory=clickhouse-keeper
ExecStart=/usr/bin/clickhouse-keeper --config=/etc/clickhouse-keeper/config.xml --pid-file=/run/clickhouse-keeper/clickhouse-keeper.pid
# Minus means that this file is optional.
EnvironmentFile=-/etc/default/clickhouse
LimitCORE=infinity
LimitNOFILE=500000
CapabilityBoundingSet=CAP_NET_ADMIN CAP_IPC_LOCK CAP_SYS_NICE CAP_NET_BIND_SERVICE
[Install]
# ClickHouse should not start from the rescue shell (rescue.target).
WantedBy=multi-user.target
systemctl daemon-reload
systemctl status clickhouse-keeper
systemctl start clickhouse-keeper
debug start without service (as foreground application)
ZooKeeper runs as in JVM. Depending on version different garbage collectors are available.
Recent JVM versions (starting from 10) use G1 garbage collector by default (should work fine).
On JVM 13-14 using ZGC or Shenandoah garbage collector may reduce pauses.
On older JVM version (before 10) you may want to make some tuning to decrease pauses, ParNew + CMS garbage collectors (like in Yandex config) is one of the best options.
One of the most important setting for JVM application is heap size. A heap size of >1 GB is recommended for most use cases and monitoring heap usage to ensure no delays are caused by garbage collection. We recommend to use at least 4Gb of RAM for zookeeper nodes (8Gb is better, that will make difference only when zookeeper is heavily loaded).
Set the Java heap size smaller than available RAM size on the node. This is very important to avoid swapping, which will seriously degrade ZooKeeper performance. Be conservative - use a maximum heap size of 3GB for a 4GB machine.
Add XX:+AlwaysPreTouch flag as well to load the memory pages into memory at the start of the zookeeper.
Set min (Xms) heap size to the values like 512Mb, or even to the same value as max (Xmx) to avoid resizing and returning the RAM to OS. Add XX:+AlwaysPreTouch flag as well to load the memory pages into memory at the start of the zookeeper.
MaxGCPauseMillis=50 (by default 200) - the ’target’ acceptable pause for garbage collection (milliseconds)
jute.maxbuffer limits the maximum size of znode content. By default it’s 1Mb. In some usecases (lot of partitions in table) ClickHouse® may need to create bigger znodes.
USE DEDICATED FAST DISKS for the transaction log! (crucial for performance due to write-ahead-log, NVMe is preferred for heavy load setup).
use 3 nodes (more nodes = slower quorum, less = no HA).
low network latency between zookeeper nodes is very important (latency, not bandwidth).
have at least 4Gb of RAM, disable swap, tune JVM sizes, and garbage collector settings.
ensure that zookeeper will not be CPU-starved by some other processes
monitor zookeeper.
Side note:
in many cases, the slowness of the zookeeper is actually a symptom of some issue with ClickHouse® schema/usage pattern (the most typical issues: an enormous number of partitions/tables/databases with real-time inserts, tiny & frequent inserts).
Here are some common problems you can avoid by configuring ZooKeeper correctly:
inconsistent lists of servers : The list of ZooKeeper servers used by the clients must match the list of ZooKeeper servers that each ZooKeeper server has. Things work okay if the client list is a subset of the real list, but things will really act strange if clients have a list of ZooKeeper servers that are in different ZooKeeper clusters. Also, the server lists in each Zookeeper server configuration file should be consistent with one another.
incorrect placement of transaction log : The most performance critical part of ZooKeeper is the transaction log. ZooKeeper syncs transactions to media before it returns a response. A dedicated transaction log device is key to consistent good performance. Putting the log on a busy device will adversely affect performance. If you only have one storage device, increase the snapCount so that snapshot files are generated less often; it does not eliminate the problem, but it makes more resources available for the transaction log.
incorrect Java heap size : You should take special care to set your Java max heap size correctly. In particular, you should not create a situation in which ZooKeeper swaps to disk. The disk is death to ZooKeeper. Everything is ordered, so if processing one request swaps the disk, all other queued requests will probably do the same. the disk. DON’T SWAP. Be conservative in your estimates: if you have 4G of RAM, do not set the Java max heap size to 6G or even 4G. For example, it is more likely you would use a 3G heap for a 4G machine, as the operating system and the cache also need memory. The best and only recommend practice for estimating the heap size your system needs is to run load tests, and then make sure you are well below the usage limit that would cause the system to swap.
Publicly accessible deployment : A ZooKeeper ensemble is expected to operate in a trusted computing environment. It is thus recommended to deploy ZooKeeper behind a firewall.
5.68.7 - Recovering from complete metadata loss in ZooKeeper
Recovering from complete metadata loss in ZooKeeper
Problem
Every ClickHouse® user experienced a loss of ZooKeeper one day. While the data is available and replicas respond to queries, inserts are no longer possible. ClickHouse uses ZooKeeper in order to store the reference version of the table structure and part of data, and when it is not available can not guarantee data consistency anymore. Replicated tables turn to the read-only mode. In this article we describe step-by-step instructions of how to restore ZooKeeper metadata and bring ClickHouse cluster back to normal operation.
In order to restore ZooKeeper we have to solve two tasks. First, we need to restore table metadata in ZooKeeper. Currently, the only way to do it is to recreate the table with the CREATE TABLE DDL statement.
The second and more difficult task is to populate zookeeper with information of ClickHouse data parts. As mentioned above, ClickHouse stores the reference data about all parts of replicated tables in ZooKeeper, so we have to traverse all partitions and re-attach them to the recovered replicated table in order to fix that.
Info
Starting from ClickHouse version 21.7 there is SYSTEM RESTORE REPLICA command
And now we have an exception that we lost all metadata in zookeeper. It is time to recover!
Current Solution
Detach replicated table.
DETACHTABLEtable_repl;
Save the table’s attach script and change engine of replicated table to non-replicated *mergetree analogue. Table definition is located in the ‘metadata’ folder, ‘/var/lib/clickhouse/metadata/default/table_repl.sql’ in our example. Please make a backup copy and modify the file as follows:
Moving to the ClickHouse® alternative to Zookeeper
Since 2021 the development of built-in ClickHouse® alternative for Zookeeper is happening, whose goal is to address several design pitfalls, and get rid of extra dependency.
ClickHouse Keeper is the recommended choice for new installations. It yields better performance in many cases due to the new features, like async replication or multi read. Some ClickHouse server features cannot be used without Keeper, for example the S3Queue.
Use the latest Keeper version available in your supported upgrade path whenever possible.
The Keeper version doesn’t need to match the ClickHouse server version
Modern Keeper usually performs better than older versions because the codebase has matured significantly, new protocol feature flags have been added, and internal replication has improved.
For existing systems that currently use Apache Zookeeper, you can consider upgrading to clickhouse-keeper especially if you will upgrade ClickHouse
also.
Warning
Before upgrading ClickHouse Keeper from version older than 23.9 please check Upgrade caveat for async_replication Upgrade caveat for async_replication
How does clickhouse-keeper differ from Zookeeper?
Keeper is optimized for ClickHouse workloads and written in C++ (and can be used as single-binary), so it don’t need any external dependencies. It uses the same client protocol but both are implementing different consensus protocol: Zookeeper is using ZAB, while ClickHouse Keeper implements eBay NuRAFT GitHub - eBay/NuRaft: C++ implementation of Raft core logic as a replication library
which improves stability and performance of base RAFT protocol.
ClickHouse Keeper can also run in embedded mode, operating as a separate thread within the ClickHouse server process, which may be suitable for testing purposes or smaller instances where some performance can be sacrificed for simplicity
Migration and upgrade guide
A mixed ZooKeeper / ClickHouse Keeper quorum is not supported. Those are different consensus protocols.
ZooKeeper snapshots and transaction logs are not format-compatible with Keeper. For data migration use clickhouse-keeper-converter.
If the above is too complex you can switch to new, empty Keeper ensemble and recreate the Keeper metadata using SYSTEM RESTORE REPLICA calls. This method takes longer time but it is suitable for smaller clusters. Check procedure to restore multiple tables in RO mode article
Keep in mind that some metadata is available in ZooKeeper only and will be lost if you don’t migrate with clickhouse-keeper-converter using above guide. For example: Distributed DDL queue, RBAC data (if configured), etc. Check Keeper depended features
for more information.
Upgrade caveat for async_replication
async_replication is an internal Keeper optimization for RAFT replication and it’s turned on by default starting from 25.10
. It does not change ClickHouse replicated table semantics, but it can improve Keeper performance.
If you upgrade directly from a version older than 23.9 to 25.10+:
either upgrade Keeper to 23.9+ first, and then continue to 25.10+
or temporarily set keeper_server.coordination_settings.async_replication=0 during the upgrade and enable it after the upgrade is finished
Keeper in kubernetes
If you run ClickHouse on Kubernetes with Altinity operator, Keeper can be managed as a dedicated ClickHouseKeeperInstallation resource (often abbreviated as CHK). That is usually the cleanest way to run and upgrade a separate Keeper ensemble on Kubernetes. Please check examples here
.
The main issue with a larger Keeper ensemble is that it takes more time to re-elect a leader, and commits take longer, which can slow down insertions and DDL queries.
It should be fine, but we don’t recommend running more than three Keeper nodes (excluding observers).
Increasing the number of nodes offers no significant advantages (unless you need to tolerate the simultaneous failure of two Keeper nodes). In terms of performance, it doesn’t perform better—and may even perform worse—and it consumes additional resources (ZooKeeper requires fast, dedicated disks to perform well, as well as some RAM and CPU).
clickhouse-keeper-client
In clickhouse-keeper-client, paths are now parsed more strictly and must be passed as string literals. In practice, this means using single quotes around paths—for example, ls '/' instead of ls /, and get '/clickhouse/path' instead of get /clickhouse/path.
Embedded Keeper
To use the embedded ClickHouse Keeper, add the <keeper_server> section to the ClickHouse server configuration. In this setup, a separate client-side <keeper> section is not required. If your ClickHouse servers use an external ClickHouse Keeper or ZooKeeper ensemble instead, see the section below.
Example of a simple cluster
The Keeper ensemble size must be odd because it requires a majority (50% + 1 nodes) to form a quorum. A 2-node Keeper setup will lose quorum after a single node failure, so the recommended number of Keeper replicas is 3.
createtabletestoncluster'{cluster}'(AInt64,SString)Engine=ReplicatedMergeTree('/clickhouse/{cluster}/tables/{database}/{table}','{replica}')OrderbyA;insertintotestselectnumber,''fromnumbers(100000000);-- on both nodes:
selectcount()fromtest;
Question: Do I need to backup Zookeeper Database, because it’s pretty important for ClickHouse®?
TLDR answer: NO, just backup ClickHouse data itself, and do SYSTEM RESTORE REPLICA during recovery to recreate zookeeper data
Details:
Zookeeper does not store any data, it stores the STATE of the distributed system (“that replica have those parts”, “still need 2 merges to do”, “alter is being applied” etc). That state always changes, and you can not capture / backup / and recover that state in a safe manner. So even backup from few seconds ago is representing some ‘old state from the past’ which is INCONSISTENT with actual state of the data.
In other words - if ClickHouse is working - then the state of distributed system always changes, and it’s almost impossible to collect the current state of zookeeper (while you collecting it it will change many times). The only exception is ‘stop-the-world’ scenario - i.e. shutdown all ClickHouse nodes, with all other zookeeper clients, then shutdown all the zookeeper, and only then take the backups, in that scenario and backups of zookeeper & ClickHouse will be consistent. In that case restoring the backup is as simple (and is equal to) as starting all the nodes which was stopped before. But usually that scenario is very non-practical because it requires huge downtime.
So what to do instead? It’s enough if you will backup ClickHouse data itself, and to recover the state of zookeeper you can just run the command SYSTEM RESTORE REPLICA command AFTER restoring the ClickHouse data itself. That will recreate the state of the replica in the zookeeper as it exists on the filesystem after backup recovery.
Normally Zookeeper ensemble consists of 3 nodes, which is enough to survive hardware failures.
Here is a plan for ZK 3.4.9 (no dynamic reconfiguration):
Add the 3 new ZK nodes to the old cluster. No changes needed for the 3 old ZK nodes at this time.
Configure one of the new ZK nodes as a cluster of 4 nodes (3 old + 1 new), start it.
Configure the other two new ZK nodes as a cluster of 6 nodes (3 old + 3 new), start them.
Make sure the 3 new ZK nodes connected to the old ZK cluster as followers (run echo stat | nc localhost 2181 on the 3 new ZK nodes)
Confirm that the leader has 5 synced followers (run echo mntr | nc localhost 2181 on the leader, look for zk_synced_followers)
Stop data ingestion in CH (this is to minimize errors when CH loses ZK).
Change the zookeeper section in the configs on the CH nodes (remove the 3 old ZK servers, add the 3 new ZK servers)
Make sure that there are no connections from CH to the 3 old ZK nodes (run echo stat | nc localhost 2181 on the 3 old nodes, check their Clients section). Restart all CH nodes if necessary (In some cases CH can reconnect to different ZK servers without a restart).
Remove the 3 old ZK nodes from zoo.cfg on the 3 new ZK nodes.
Restart the 3 new ZK nodes. They should form a cluster of 3 nodes.
When CH reconnects to ZK, start data loading.
Turn off the 3 old ZK nodes.
This plan works, but it is not the only way to do this, it can be changed if needed.
5.68.11 - ZooKeeper cluster migration when using K8s node local storage
ZooKeeper cluster migration when using K8s node local storage
Describes how to migrate a ZooKeeper cluster when using K8s node-local storage such as static PV, local-path, TopoLVM.
Requires HA setup (3+ pods).
This solution is more risky than migration by adding followers
because it reduces
the number of active consensus members but is operationally simpler. When running with clickhouse-keeper, it can be
performed gracefully so that quorum is maintained during the whole operation.
Find the leader pod and note its name
To detect leader run echo stat | nc 127.0.0.1 2181 | grep leader inside pods
Make sure the ZK cluster is healthy and all nodes are in sync
(run on leader) echo mntr | nc 127.0.0.1 2181 | grep zk_synced_followers should be N-1 for N member cluster
Pick the first non-leader pod and delete its PVC,
kubectl delete --wait=false pvc clickhouse-keeper-data-0 -> status should be Terminating
Also delete PV if your StorageClass reclaim policy is set to Retain
If you are using dynamic volume provisioning make adjustments based on your k8s infrastructure (such as moving labels and taints or cordoning node) so that after pod delete the new one will be scheduled on the planned node
date column -> legacy MergeTree partition expression.
sampling expression -> SAMPLE BY
index granularity -> index_granularity
mode -> type of MergeTree table
sign column -> sign - CollapsingMergeTree / VersionedCollapsingMergeTree
primary key -> ORDER BY key if PRIMARY KEY not defined.
sorting key -> ORDER BY key if PRIMARY KEY defined.
data format version -> 1partition key -> PARTITION BY
granularity bytes -> index_granularity_bytes
types of MergeTree tables:
Ordinary=0Collapsing=1Summing=2Aggregating=3Replacing=5Graphite=6VersionedCollapsing=7
/mutations
Log of latest mutations
/columns
List of columns for latest (reference) table version. Replicas would try to reach this state.
/log
Log of latest actions with table.
Related settings:
┌─name────────────────────────┬─value─┬─changed─┬─description────────────────────────────────────────────────────────────────────────────────────────────────────────────────────────────────────────────────────────────────┬─type───┐│max_replicated_logs_to_keep│1000│0│Howmanyrecordsmaybeinlog,ifthereisinactivereplica.Inactivereplicabecomeslostwhenwhenthisnumberexceed.│UInt64││min_replicated_logs_to_keep│10│0│KeepaboutthisnumberoflastrecordsinZooKeeperlog,eveniftheyareobsolete.Itdoesn't affect work of tables: used only to diagnose ZooKeeper log before cleaning. │ UInt64 │
└─────────────────────────────┴───────┴─────────┴────────────────────────────────────────────────────────────────────────────────────────────────────────────────────────────────────────────────────────────────────────────┴────────┘
/replicas
List of table replicas.
/replicas/replica_name/
/replicas/replica_name/mutation_pointer
Pointer to the latest mutation executed by replica
/replicas/replica_name/log_pointer
Pointer to the latest task from replication_queue executed by replica
/replicas/replica_name/max_processed_insert_time
/replica/replica_name/metadata
Table schema of specific replica
/replica/replica_name/columns
Columns list of specific replica.
/quorum
Used for quorum inserts.
6 - Useful queries
Access useful ClickHouse® queries, from finding database size, missing blocks, checking table metadata in Zookeeper, and more.
6.1 - Check table metadata in zookeeper
Check table metadata in zookeeper.
Compare table metadata of different replicas in zookeeper
Check if a table is consistent across all zookeeper replicas. From each replica, returns metdadata, columns, and is_active nodes. Checks whether each replica’s value matches the previous replica’s value, and flags any mismatches (looks_good = 0).
Compare query performance across different time periods
Looks at unique query shapes (by normalized_query_hash) which occurred within two different time intervals (“before” and “after”), and returns performance metrics for each query pattern which performed worse in the “after” interval.
WITH
toStartOfInterval(event_time, INTERVAL 5 MINUTE) = '2023-06-30 13:00:00' as before,
toStartOfInterval(event_time, INTERVAL 5 MINUTE) = '2023-06-30 15:00:00' as after
SELECT
normalized_query_hash,
anyIf(query, before) AS QueryBefore,
anyIf(query, after) AS QueryAfter,
countIf(before) as CountBefore,
sumIf(query_duration_ms, before) / 1000 AS QueriesDurationBefore,
sumIf(ProfileEvents.Values[indexOf(ProfileEvents.Names, 'RealTimeMicroseconds')], before) / 1000000 AS RealTimeBefore,
sumIf(ProfileEvents.Values[indexOf(ProfileEvents.Names, 'UserTimeMicroseconds')], before) / 1000000 AS UserTimeBefore,
sumIf(ProfileEvents.Values[indexOf(ProfileEvents.Names, 'SystemTimeMicroseconds')], before) / 1000000 AS SystemTimeBefore,
sumIf(ProfileEvents.Values[indexOf(ProfileEvents.Names, 'DiskReadElapsedMicroseconds')], before) / 1000000 AS DiskReadTimeBefore,
sumIf(ProfileEvents.Values[indexOf(ProfileEvents.Names, 'DiskWriteElapsedMicroseconds')], before) / 1000000 AS DiskWriteTimeBefore,
sumIf(ProfileEvents.Values[indexOf(ProfileEvents.Names, 'NetworkSendElapsedMicroseconds')], before) / 1000000 AS NetworkSendTimeBefore,
sumIf(ProfileEvents.Values[indexOf(ProfileEvents.Names, 'NetworkReceiveElapsedMicroseconds')], before) / 1000000 AS NetworkReceiveTimeBefore,
sumIf(ProfileEvents.Values[indexOf(ProfileEvents.Names, 'ZooKeeperWaitMicroseconds')], before) / 1000000 AS ZooKeeperWaitTimeBefore,
sumIf(ProfileEvents.Values[indexOf(ProfileEvents.Names, 'OSIOWaitMicroseconds')], before) / 1000000 AS OSIOWaitTimeBefore,
sumIf(ProfileEvents.Values[indexOf(ProfileEvents.Names, 'OSCPUWaitMicroseconds')], before) / 1000000 AS OSCPUWaitTimeBefore,
sumIf(ProfileEvents.Values[indexOf(ProfileEvents.Names, 'OSCPUVirtualTimeMicroseconds')], before) / 1000000 AS OSCPUVirtualTimeBefore,
sumIf(ProfileEvents.Values[indexOf(ProfileEvents.Names, 'SelectedBytes')], before) AS SelectedBytesBefore,
sumIf(ProfileEvents.Values[indexOf(ProfileEvents.Names, 'SelectedRanges')], before) AS SelectedRangesBefore,
sumIf(read_rows, before) AS ReadRowsBefore,
formatReadableSize(sumIf(read_bytes, before) AS ReadBytesBefore),
sumIf(written_rows, before) AS WrittenTowsBefore,
formatReadableSize(sumIf(written_bytes, before)) AS WrittenBytesBefore,
sumIf(result_rows, before) AS ResultRowsBefore,
formatReadableSize(sumIf(result_bytes, before)) AS ResultBytesBefore,
countIf(after) as CountAfter,
sumIf(query_duration_ms, after) / 1000 AS QueriesDurationAfter,
sumIf(ProfileEvents.Values[indexOf(ProfileEvents.Names, 'RealTimeMicroseconds')], after) / 1000000 AS RealTimeAfter,
sumIf(ProfileEvents.Values[indexOf(ProfileEvents.Names, 'UserTimeMicroseconds')], after) / 1000000 AS UserTimeAfter,
sumIf(ProfileEvents.Values[indexOf(ProfileEvents.Names, 'SystemTimeMicroseconds')], after) / 1000000 AS SystemTimeAfter,
sumIf(ProfileEvents.Values[indexOf(ProfileEvents.Names, 'DiskReadElapsedMicroseconds')], after) / 1000000 AS DiskReadTimeAfter,
sumIf(ProfileEvents.Values[indexOf(ProfileEvents.Names, 'DiskWriteElapsedMicroseconds')], after) / 1000000 AS DiskWriteTimeAfter,
sumIf(ProfileEvents.Values[indexOf(ProfileEvents.Names, 'NetworkSendElapsedMicroseconds')], after) / 1000000 AS NetworkSendTimeAfter,
sumIf(ProfileEvents.Values[indexOf(ProfileEvents.Names, 'NetworkReceiveElapsedMicroseconds')], after) / 1000000 AS NetworkReceiveTimeAfter,
sumIf(ProfileEvents.Values[indexOf(ProfileEvents.Names, 'ZooKeeperWaitMicroseconds')], after) / 1000000 AS ZooKeeperWaitTimeAfter,
sumIf(ProfileEvents.Values[indexOf(ProfileEvents.Names, 'OSIOWaitMicroseconds')], after) / 1000000 AS OSIOWaitTimeAfter,
sumIf(ProfileEvents.Values[indexOf(ProfileEvents.Names, 'OSCPUWaitMicroseconds')], after) / 1000000 AS OSCPUWaitTimeAfter,
sumIf(ProfileEvents.Values[indexOf(ProfileEvents.Names, 'OSCPUVirtualTimeMicroseconds')], after) / 1000000 AS OSCPUVirtualTimeAfter,
sumIf(ProfileEvents.Values[indexOf(ProfileEvents.Names, 'SelectedBytes')], after) AS SelectedBytesAfter,
sumIf(ProfileEvents.Values[indexOf(ProfileEvents.Names, 'SelectedRanges')], after) AS SelectedRangesAfter,
sumIf(read_rows, after) AS ReadRowsAfter,
formatReadableSize(sumIf(read_bytes, after) AS ReadBytesAfter),
sumIf(written_rows, after) AS WrittenTowsAfter,
formatReadableSize(sumIf(written_bytes, after)) AS WrittenBytesAfter,
sumIf(result_rows, after) AS ResultRowsAfter,
formatReadableSize(sumIf(result_bytes, after)) AS ResultBytesAfter
FROM system.query_log
WHERE (before OR after) AND type in (2,4) -- QueryFinish, ExceptionWhileProcessing
GROUP BY normalized_query_hash
WITH TOTALS
ORDER BY SelectedRangesAfter- SelectedRangesBefore DESC
LIMIT 10
FORMAT Vertical
Looks at the system.query_log in a window (in this case, 3 days) prior to and following a specified timestamp of interest. Returns performance metrics for each query pattern which performed worse after that timestamp.
WITH
toDateTime('2024-02-09 00:00:00') as timestamp_of_issue,
event_time < timestamp_of_issue as before,
event_time >= timestamp_of_issue as after
select
normalized_query_hash as h,
any(query) as query_sample,
round(quantileIf(0.9)(query_duration_ms, before)) as duration_q90_before,
round(quantileIf(0.9)(query_duration_ms, after)) as duration_q90_after,
countIf(before) as cnt_before,
countIf(after) as cnt_after,
sumIf(query_duration_ms,before) as duration_sum_before,
sumIf(query_duration_ms,after) as duration_sum_after,
sumIf(ProfileEvents['UserTimeMicroseconds'], before) as usertime_sum_before,
sumIf(ProfileEvents['UserTimeMicroseconds'], after) as usertime_sum_after,
sumIf(read_bytes,before) as sum_read_bytes_before,
sumIf(read_bytes,after) as sum_read_bytes_after
from system.query_log
where event_time between timestamp_of_issue - INTERVAL 3 DAY and timestamp_of_issue + INTERVAL 3 DAY
group by h
HAVING cnt_after > 1.1 * cnt_before OR sum_read_bytes_after > 1.2 * sum_read_bytes_before OR usertime_sum_after > 1.2 * usertime_sum_before
ORDER BY sum_read_bytes_after - sum_read_bytes_before
FORMAT Vertical
6.3 - Debug hanging thing
Debug hanging / freezing things
Debug hanging / freezing things
If ClickHouse® is busy with something and you don’t know what’s happening, you can easily check the stacktraces of all the thread which are working
If you can’t start any queries, but you have access to the node, you can sent a signal
# older versions
for i in $(ls -1 /proc/$(pidof clickhouse-server)/task/); do kill -TSTP $i; done
# even older versions
for i in $(ls -1 /proc/$(pidof clickhouse-server)/task/); do kill -SIGPROF $i; done
6.4 - Handy queries for system.query_log
Useful queries for analyzing query performance, resource usage, and overall query statistics
Most resource-intensive queries
For each query (cluster-wide, grouped by query hash and ordered by time), reports:
Latency-related metrics: CPU time categories, disk read and write time, network send and receive time, Zookeeper wait time
Data size-related metrics: counts of bytes and rows read/written, parts/ranges/marks read, files opened, and memory used
Cache hit performance
SELECThostName()ashost,normalized_query_hash,min(event_time),max(event_time),replace(substr(argMax(query,utime),1,80),'\n',' ')ASquery,argMax(query_id,utime)ASsample_query_id,count(),sum(query_duration_ms)/1000ASQueriesDuration,/* wall clock */sum(ProfileEvents['RealTimeMicroseconds'])/1000000ASRealTime,/* same as above but x number of thread */sum(ProfileEvents['UserTimeMicroseconds']asutime)/1000000ASUserTime,/* time when our query was doin some cpu-insense work, creating cpu load */sum(ProfileEvents['SystemTimeMicroseconds'])/1000000ASSystemTime,/* time spend on waiting for some system operations */sum(ProfileEvents['DiskReadElapsedMicroseconds'])/1000000ASDiskReadTime,sum(ProfileEvents['DiskWriteElapsedMicroseconds'])/1000000ASDiskWriteTime,sum(ProfileEvents['NetworkSendElapsedMicroseconds'])/1000000ASNetworkSendTime,/* check the other side of the network! */sum(ProfileEvents['NetworkReceiveElapsedMicroseconds'])/1000000ASNetworkReceiveTime,/* check the other side of the network! */sum(ProfileEvents['ZooKeeperWaitMicroseconds'])/1000000ASZooKeeperWaitTime,sum(ProfileEvents['OSIOWaitMicroseconds'])/1000000ASOSIOWaitTime,/* IO waits, usually disks - that metric is 'orthogonal' to other */sum(ProfileEvents['OSCPUWaitMicroseconds'])/1000000ASOSCPUWaitTime,/* waiting for a 'free' CPU - usually high when the other load on the server creates a lot of contention for cpu */sum(ProfileEvents['OSCPUVirtualTimeMicroseconds'])/1000000ASOSCPUVirtualTime,/* similar to usertime + system time */formatReadableSize(sum(ProfileEvents['NetworkReceiveBytes'])asnetwork_receive_bytes)ASNetworkReceiveBytes,formatReadableSize(sum(ProfileEvents['NetworkSendBytes'])asnetwork_send_bytes)ASNetworkSendBytes,sum(ProfileEvents['SelectedParts'])asSelectedParts,sum(ProfileEvents['SelectedRanges'])asSelectedRanges,sum(ProfileEvents['SelectedMarks'])asSelectedMarks,sum(ProfileEvents['SelectedRows'])asSelectedRows,/* those may different from read_rows - here the number or rows potentially matching the where conditions, not neccessary all will be read */sum(ProfileEvents['SelectedBytes'])asSelectedBytes,sum(ProfileEvents['FileOpen'])asFileOpen,sum(ProfileEvents['ZooKeeperTransactions'])asZooKeeperTransactions,formatReadableSize(sum(ProfileEvents['OSReadBytes'])asos_read_bytes)asOSReadBytesExcludePageCache,formatReadableSize(sum(ProfileEvents['OSWriteBytes'])asos_write_bytes)asOSWriteBytesExcludePageCache,formatReadableSize(sum(ProfileEvents['OSReadChars'])asos_read_chars)asOSReadCharsIncludePageCache,formatReadableSize(sum(ProfileEvents['OSWriteChars'])asos_write_chars)asOSWriteCharsIncludePageCache,formatReadableSize(quantile(0.97)(memory_usage)asmemory_usage_q97)asMemoryUsageQ97,sum(read_rows)ASReadRows,formatReadableSize(sum(read_bytes)asread_bytes_sum)ASReadBytes,sum(written_rows)ASWrittenRows,formatReadableSize(sum(written_bytes)aswritten_bytes_sum)ASWrittenBytes,/* */sum(result_rows)ASResultRows,formatReadableSize(sum(result_bytes)asresult_bytes_sum)ASResultBytesFROMclusterAllReplicas('{cluster}',system.query_log)WHEREevent_date>=today()ANDtypein(2,4)-- QueryFinish, ExceptionWhileProcessing
GROUPBYGROUPINGSETS((normalized_query_hash,host),(host),())ORDERBYOSCPUVirtualTimeDESCLIMIT30FORMATVertical;
Similar to above, for older ClickHouse versions (pre-22.4). Returns the slowest queries from a single host along with elements of latency.
Runs cluster-wide, returns a side-by-side comparison of performance metrics, ordered by relative difference
WITH
query_id='8c050082-428e-4523-847a-caf29511d6ba' AS first,
query_id='618e0c55-e21d-4630-97e7-5f82e2475c32' AS second,
arrayConcat(mapKeys(ProfileEvents), ['query_duration_ms', 'read_rows', 'read_bytes', 'written_rows', 'written_bytes', 'result_rows', 'result_bytes', 'memory_usage', 'normalized_query_hash', 'peak_threads_usage', 'query_cache_usage']) AS metrics,
arrayConcat(mapValues(ProfileEvents), [query_duration_ms, read_rows, read_bytes, written_rows, written_bytes, result_rows, result_bytes, memory_usage, normalized_query_hash, peak_threads_usage, toUInt64(query_cache_usage)]) AS metrics_values
SELECT
metrics[i] AS metric,
anyIf(metrics_values[i], first) AS v1,
anyIf(metrics_values[i], second) AS v2,
formatReadableQuantity(v1 - v2)
FROM clusterAllReplicas(default, system.query_log)
ARRAY JOIN arrayEnumerate(metrics) AS i
WHERE (first OR second) AND (type = 2)
GROUP BY metric
HAVING v1 != v2
ORDER BY
(v2 - v1) / (v1 + v2) DESC,
v2 DESC,
metric ASC
Compares two queries run on the same host in the past day, returning the metrics highlighting the most significant performance differences between the faster and slower query
WITH
'd18fb820-4075-49bf-8fa3-cd7e53b9d523' AS fast_query_id,
'22ffbcc0-c62a-4895-8105-ee9d7447a643' AS slow_query_id,
faster AS
(
SELECT pe.1 AS event_name, pe.2 AS event_value
FROM
(
SELECT ProfileEvents.Names, ProfileEvents.Values
FROM system.query_log
WHERE (query_id = fast_query_id ) AND (type = 'QueryFinish') AND (event_date = today())
)
ARRAY JOIN arrayZip(ProfileEvents.Names, ProfileEvents.Values) AS pe
),
slower AS
(
SELECT pe.1 AS event_name, pe.2 AS event_value
FROM
(
SELECT ProfileEvents.Names, ProfileEvents.Values
FROM system.query_log
WHERE (query_id = slow_query_id) AND (type = 'QueryFinish') AND (event_date = today())
)
ARRAY JOIN arrayZip(ProfileEvents.Names, ProfileEvents.Values) AS pe
)
SELECT
event_name,
formatReadableQuantity(slower.event_value) AS slower_value,
formatReadableQuantity(faster.event_value) AS faster_value,
round((slower.event_value - faster.event_value) / slower.event_value, 2) AS diff_q
FROM faster
LEFT JOIN slower USING (event_name)
WHERE diff_q > 0.05
ORDER BY event_name ASC
SETTINGS join_use_nulls = 1
Queries which did not complete within specified timeframe
For a given time range, returns queries which either did not complete, or did not complete within a configurable timeframe (100 seconds)
Returns a list of columns which are used as filters against a table. Replace %target_table% with the actual table name (or pattern) you want to inspect.
WITH
any(query) AS q,
any(tables) AS _tables,
arrayJoin(extractAll(query, '\\b(?:PRE)?WHERE\\s+(.*?)\\s+(?:GROUP BY|ORDER BY|UNION|SETTINGS|FORMAT$)')) AS w,
any(columns) AS cols,
arrayFilter(x -> (position(w, extract(x, '\\.(`[^`]+`|[^\\.]+)$')) > 0), columns) AS c,
arrayJoin(c) AS c2
SELECT
c2,
count()
FROM system.query_log
WHERE (event_time >= (now() - toIntervalDay(1)))
AND arrayExists(x -> (x LIKE '%target_table%'), tables)
AND (query ILIKE 'SELECT%')
GROUP BY c2
ORDER BY count() ASC;
Most‑selected columns
Over the past week, which columns have been accessed the most frequently in SELECT queries
SELECT
col AS column,
count() AS hits
FROM system.query_log
ARRAY JOIN columns AS col -- expand the column list first
WHERE type = 'QueryFinish'
AND query_kind = 'Select'
AND event_time >= now() - INTERVAL 7 DAY
AND notEmpty(columns)
GROUP BY col
ORDER BY hits DESC
LIMIT 50;
Most‑used functions
Over the past week, which functions have been used the most
SELECT
f AS function,
count() AS hits
FROM system.query_log
ARRAY JOIN used_functions AS f -- used_aggregate_functions, used_aggregate_function_combinators
WHERE type = 'QueryFinish'
AND event_time >= now() - INTERVAL 7 DAY
AND notEmpty(used_functions)
GROUP BY f
ORDER BY hits DESC
LIMIT 50;
“Worst offender” query ranks
Over a specified time range, returns the query shapes which appear to be the worst performing based on a range of ranked criteria
SELECT *
FROM
(
SELECT
*,
DENSE_RANK() OVER (PARTITION BY host ORDER BY cnt DESC) as rank_by_cnt,
DENSE_RANK() OVER (PARTITION BY host ORDER BY QueriesDuration DESC) as rank_by_duration,
DENSE_RANK() OVER (PARTITION BY host ORDER BY RealTime DESC) as rank_by_real_time,
DENSE_RANK() OVER (PARTITION BY host ORDER BY UserTime DESC) as rank_by_user_time,
DENSE_RANK() OVER (PARTITION BY host ORDER BY SystemTime DESC) as rank_by_system_time,
DENSE_RANK() OVER (PARTITION BY host ORDER BY DiskReadTime DESC) as rank_by_disk_read_time,
DENSE_RANK() OVER (PARTITION BY host ORDER BY DiskWriteTime DESC) as rank_by_disk_write_time,
DENSE_RANK() OVER (PARTITION BY host ORDER BY NetworkSendTime DESC) as rank_by_network_send_time,
DENSE_RANK() OVER (PARTITION BY host ORDER BY NetworkReceiveTime DESC) as rank_by_network_receive_time,
DENSE_RANK() OVER (PARTITION BY host ORDER BY OSIOWaitTime DESC) as rank_by_os_io_wait_time,
DENSE_RANK() OVER (PARTITION BY host ORDER BY OSCPUWaitTime DESC) as rank_by_os_cpu_wait_time,
DENSE_RANK() OVER (PARTITION BY host ORDER BY OSCPUVirtualTime DESC) as rank_by_os_cpu_virtual_time,
DENSE_RANK() OVER (PARTITION BY host ORDER BY NetworkReceiveBytes DESC) as rank_by_network_receive_bytes,
DENSE_RANK() OVER (PARTITION BY host ORDER BY NetworkSendBytes DESC) as rank_by_network_send_bytes,
DENSE_RANK() OVER (PARTITION BY host ORDER BY SelectedParts DESC) as rank_by_selected_parts,
DENSE_RANK() OVER (PARTITION BY host ORDER BY SelectedRanges DESC) as rank_by_selected_ranges,
DENSE_RANK() OVER (PARTITION BY host ORDER BY SelectedMarks DESC) as rank_by_selected_marks,
DENSE_RANK() OVER (PARTITION BY host ORDER BY SelectedRows DESC) as rank_by_selected_rows,
DENSE_RANK() OVER (PARTITION BY host ORDER BY SelectedBytes DESC) as rank_by_selected_bytes,
DENSE_RANK() OVER (PARTITION BY host ORDER BY FileOpen DESC) as rank_by_file_open,
DENSE_RANK() OVER (PARTITION BY host ORDER BY ZooKeeperTransactions DESC) as rank_by_zookeeper_transactions,
DENSE_RANK() OVER (PARTITION BY host ORDER BY OSReadBytesExcludePageCache DESC) as rank_by_os_read_bytes_exclude_page_cache,
DENSE_RANK() OVER (PARTITION BY host ORDER BY OSWriteBytesExcludePageCache DESC) as rank_by_os_write_bytes_exclude_page_cache,
DENSE_RANK() OVER (PARTITION BY host ORDER BY OSReadBytesIncludePageCache DESC) as rank_by_os_read_bytes_include_page_cache,
DENSE_RANK() OVER (PARTITION BY host ORDER BY OSWriteCharsIncludePageCache DESC) as rank_by_os_write_chars_include_page_cache,
DENSE_RANK() OVER (PARTITION BY host ORDER BY MemoryUsageQ97 DESC) as rank_by_memory_usage_q97,
DENSE_RANK() OVER (PARTITION BY host ORDER BY ReadRows DESC) as rank_by_read_rows,
DENSE_RANK() OVER (PARTITION BY host ORDER BY ReadBytes DESC) as rank_by_read_bytes,
DENSE_RANK() OVER (PARTITION BY host ORDER BY WrittenRows DESC) as rank_by_written_rows,
DENSE_RANK() OVER (PARTITION BY host ORDER BY WrittenBytes DESC) as rank_by_written_bytes,
DENSE_RANK() OVER (PARTITION BY host ORDER BY ResultRows DESC) as rank_by_result_rows,
DENSE_RANK() OVER (PARTITION BY host ORDER BY ResultBytes DESC) as rank_by_result_bytes
FROM
(
SELECT
hostName() as host,
normalized_query_hash,
min(event_time) as min_event_time,
max(event_time) as max_event_time,
replace(substr(argMax(query, utime), 1, 80), '\n', ' ') AS query,
argMax(query_id, utime) AS sample_query_id,
count() as cnt,
sum(query_duration_ms) / 1000 AS QueriesDuration, /* wall clock */
sum(ProfileEvents['RealTimeMicroseconds']) / 1000000 AS RealTime, /* same as above but x number of thread */
sum(ProfileEvents['UserTimeMicroseconds'] as utime) / 1000000 AS UserTime, /* time when our query was doin some cpu-insense work, creating cpu load */
sum(ProfileEvents['SystemTimeMicroseconds']) / 1000000 AS SystemTime, /* time spend on waiting for some system operations */
sum(ProfileEvents['DiskReadElapsedMicroseconds']) / 1000000 AS DiskReadTime,
sum(ProfileEvents['DiskWriteElapsedMicroseconds']) / 1000000 AS DiskWriteTime,
sum(ProfileEvents['NetworkSendElapsedMicroseconds']) / 1000000 AS NetworkSendTime, /* check the other side of the network! */
sum(ProfileEvents['NetworkReceiveElapsedMicroseconds']) / 1000000 AS NetworkReceiveTime, /* check the other side of the network! */
sum(ProfileEvents['OSIOWaitMicroseconds']) / 1000000 AS OSIOWaitTime, /* IO waits, usually disks - that metric is 'orthogonal' to other */
sum(ProfileEvents['OSCPUWaitMicroseconds']) / 1000000 AS OSCPUWaitTime, /* waiting for a 'free' CPU - usually high when the other load on the server creates a lot of contention for cpu */
sum(ProfileEvents['OSCPUVirtualTimeMicroseconds']) / 1000000 AS OSCPUVirtualTime, /* similar to usertime + system time */
sum(ProfileEvents['NetworkReceiveBytes']) AS NetworkReceiveBytes,
sum(ProfileEvents['NetworkSendBytes']) AS NetworkSendBytes,
sum(ProfileEvents['SelectedParts']) as SelectedParts,
sum(ProfileEvents['SelectedRanges']) as SelectedRanges,
sum(ProfileEvents['SelectedMarks']) as SelectedMarks,
sum(ProfileEvents['SelectedRows']) as SelectedRows, /* those may different from read_rows - here the number or rows potentially matching the where conditions, not neccessary all will be read */
sum(ProfileEvents['SelectedBytes']) as SelectedBytes,
sum(ProfileEvents['FileOpen']) as FileOpen,
sum(ProfileEvents['ZooKeeperTransactions']) as ZooKeeperTransactions,
sum(ProfileEvents['OSReadBytes'] ) as OSReadBytesExcludePageCache,
sum(ProfileEvents['OSWriteBytes'] ) as OSWriteBytesExcludePageCache,
sum(ProfileEvents['OSReadChars'] ) as OSReadBytesIncludePageCache,
sum(ProfileEvents['OSWriteChars'] ) as OSWriteCharsIncludePageCache,
quantile(0.97)(memory_usage) as MemoryUsageQ97 ,
sum(read_rows) AS ReadRows,
sum(read_bytes) AS ReadBytes,
sum(written_rows) AS WrittenRows,
sum(written_bytes) AS WrittenBytes, /* */
sum(result_rows) AS ResultRows,
sum(result_bytes) AS ResultBytes
FROM clusterAllReplicas('{cluster}', system.query_log)
WHERE event_time BETWEEN '2024-04-04 11:31:10' and '2024-04-04 12:36:50' AND type in (2,4)-- QueryFinish, ExceptionWhileProcessing
GROUP BY normalized_query_hash, host
)
)
WHERE
(rank_by_cnt <= 20 and cnt > 10)
OR (rank_by_duration <= 20 and QueriesDuration > 60)
OR (rank_by_real_time <= 20 and RealTime > 60)
OR (rank_by_user_time <= 20 and UserTime > 60)
OR (rank_by_system_time <= 20 and SystemTime > 60)
OR (rank_by_disk_read_time <= 20 and DiskReadTime > 60)
OR (rank_by_disk_write_time <= 20 and DiskWriteTime > 60)
OR (rank_by_network_send_time <= 20 and NetworkSendTime > 60)
OR (rank_by_network_receive_time <= 20 and NetworkReceiveTime > 60)
OR (rank_by_os_io_wait_time <= 20 and OSIOWaitTime > 60)
OR (rank_by_os_cpu_wait_time <= 20 and OSCPUWaitTime > 60)
OR (rank_by_os_cpu_virtual_time <= 20 and OSCPUVirtualTime > 60)
OR (rank_by_network_receive_bytes <= 20 and NetworkReceiveBytes > 500000000)
OR (rank_by_network_send_bytes <= 20 and NetworkSendBytes > 500000000)
OR (rank_by_selected_parts <= 20 and SelectedParts > 1000)
OR (rank_by_selected_ranges <= 20 and SelectedRanges > 1000)
OR (rank_by_selected_marks <= 20 and SelectedMarks > 1000)
OR (rank_by_selected_rows <= 20 and SelectedRows > 1000000)
OR (rank_by_selected_bytes <= 20 and SelectedBytes > 500000000)
OR (rank_by_file_open <= 20 and FileOpen > 1000)
OR (rank_by_zookeeper_transactions <= 20 and ZooKeeperTransactions > 10)
OR (rank_by_os_read_bytes_exclude_page_cache <= 20 and OSReadBytesExcludePageCache > 500000000)
OR (rank_by_os_write_bytes_exclude_page_cache <= 20 and OSWriteBytesExcludePageCache > 500000000)
OR (rank_by_os_read_bytes_include_page_cache <= 20 and OSReadBytesIncludePageCache > 500000000)
OR (rank_by_os_write_chars_include_page_cache <= 20 and OSWriteCharsIncludePageCache > 500000000)
OR (rank_by_memory_usage_q97 <= 20 and MemoryUsageQ97 > 500000000)
OR (rank_by_read_rows <= 20 and ReadRows > 100000)
OR (rank_by_read_bytes <= 20 and ReadBytes > 500000000)
OR (rank_by_written_rows <= 20 and WrittenRows > 100000)
OR (rank_by_written_bytes <= 20 and WrittenBytes > 500000000)
OR (rank_by_result_rows <= 20 and ResultRows > 100000)
OR (rank_by_result_bytes <= 20 and ResultBytes > 100000000)
ORDER BY rank_by_cnt*10 + rank_by_duration*10 + rank_by_real_time*10 + rank_by_user_time*10 + rank_by_system_time*10 + rank_by_disk_read_time*10 + rank_by_disk_write_time*5 + rank_by_network_send_time + rank_by_network_receive_time + rank_by_os_io_wait_time + rank_by_os_cpu_wait_time + rank_by_os_cpu_virtual_time*10 + rank_by_network_receive_bytes*8 + rank_by_network_send_bytes*8 + rank_by_selected_parts*5 + rank_by_selected_ranges*5 + rank_by_selected_marks*5 + rank_by_selected_rows*5 + rank_by_selected_bytes*5 + rank_by_file_open*5 + rank_by_zookeeper_transactions*5 + rank_by_os_read_bytes_exclude_page_cache*5 + rank_by_os_write_bytes_exclude_page_cache*5 + rank_by_os_read_bytes_include_page_cache*5 + rank_by_os_write_chars_include_page_cache*5 + rank_by_memory_usage_q97*10 + rank_by_read_rows*10 + rank_by_read_bytes*10 + rank_by_written_rows*8 + rank_by_written_bytes*8 + rank_by_result_rows*8 + rank_by_result_bytes*8 DESC
Query to gather information about ingestion rate from system.part_log.
Insert rate
Returns aggregated insert metrics, per table, for the current day (by default), including parts per insert, rows/bytes per insert, and rows/bytes per part.
selectdatabase,table,time_bucket,max(number_of_parts_per_insert)max_parts_pi,median(number_of_parts_per_insert)median_parts_pi,min(min_rows_per_part)min_rows_pp,max(max_rows_per_part)max_rows_pp,median(median_rows_per_part)median_rows_pp,min(rows_per_insert)min_rows_pi,median(rows_per_insert)median_rows_pi,max(rows_per_insert)max_rows_pi,sum(rows_per_insert)rows_inserted,sum(seconds_per_insert)parts_creation_seconds,count()inserts,sum(number_of_parts_per_insert)new_parts,max(last_part_pi)-min(first_part_pi)asinsert_period,inserts*60/insert_periodasinserts_per_minutefrom(SELECTdatabase,table,toStartOfDay(event_time)AStime_bucket,count()ASnumber_of_parts_per_insert,min(rows)ASmin_rows_per_part,max(rows)ASmax_rows_per_part,median(rows)ASmedian_rows_per_part,sum(rows)ASrows_per_insert,min(size_in_bytes)ASmin_bytes_per_part,max(size_in_bytes)ASmax_bytes_per_part,median(size_in_bytes)ASmedian_bytes_per_part,sum(size_in_bytes)ASbytes_per_insert,median_bytes_per_part/median_rows_per_partASavg_row_size,sum(duration_ms)/1000asseconds_per_insert,max(event_time)aslast_part_pi,min(event_time)asfirst_part_piFROMsystem.part_logWHERE-- Enum8('NewPart' = 1, 'MergeParts' = 2, 'DownloadPart' = 3, 'RemovePart' = 4, 'MutatePart' = 5, 'MovePart' = 6)
event_type=1AND-- change if another time period is desired
event_date>=today()GROUPBYquery_id,database,table,time_bucket)GROUPBYdatabase,table,time_bucketORDERBYtime_bucket,database,tableASC
New parts per partition
Returns new part counts and average rows per table for the current day (by default)
Returns new part counts and average rows by minute by table
Should not be more often than 1 new part per table per second (60 inserts per minute)
One insert can create several parts because of partitioning and materialized views attached.
WITH
now() - INTERVAL 120 DAY as retain_old_partitions,
replicas AS (SELECT DISTINCT database, table, zookeeper_path || '/block_numbers' AS block_numbers_path FROM system.replicas),
zk_data AS (SELECT DISTINCT name as partition_id, path as block_numbers_path FROM system.zookeeper WHERE path IN (SELECT block_numbers_path FROM replicas) AND mtime < retain_old_partitions AND partition_id <> 'all'),
zk_partitions AS (SELECT DISTINCT database, table, partition_id FROM replicas JOIN zk_data USING block_numbers_path),
partitions AS (SELECT DISTINCT database, table, partition_id FROM system.parts)
SELECT
format('ALTER TABLE `{}`.`{}` {};',database, table, arrayStringConcat( arraySort(groupArray('FORGET PARTITION ID \'' || partition_id || '\'')), ', ')) AS query
FROM zk_partitions
WHERE (database, table, partition_id) NOT IN (SELECT * FROM partitions)
GROUP BY database, table
ORDER BY database, table
FORMAT TSVRaw;
WITH
now() - INTERVAL 120 DAY as retain_old_partitions,
replicas AS (SELECT DISTINCT database, table, zookeeper_path || '/block_numbers' AS block_numbers_path FROM clusterAllReplicas('{cluster}',system.replicas)),
zk_data AS (SELECT DISTINCT name as partition_id, path as block_numbers_path FROM system.zookeeper WHERE path IN (SELECT block_numbers_path FROM replicas) AND mtime < retain_old_partitions AND partition_id <> 'all'),
zk_partitions AS (SELECT DISTINCT database, table, partition_id FROM replicas JOIN zk_data USING block_numbers_path),
partitions AS (SELECT DISTINCT database, table, partition_id FROM clusterAllReplicas('{cluster}',system.parts))
SELECT
format('ALTER TABLE `{}`.`{}` ON CLUSTER \'{{cluster}}\' {};',database, table, arrayStringConcat( arraySort(groupArray('FORGET PARTITION ID \'' || partition_id || '\'')), ', ')) AS query
FROM zk_partitions
WHERE (database, table, partition_id) NOT IN (SELECT * FROM partitions)
GROUP BY database, table
ORDER BY database, table
FORMAT TSVRaw;
6.7 - Removing tasks in the replication queue related to empty partitions
Removing tasks in the replication queue related to empty partitions
Removing tasks in the replication queue related to empty partitions
SELECT 'ALTER TABLE ' || database || '.' || table || ' DROP PARTITION ID \''|| partition_id || '\';' FROM
(SELECT DISTINCT database, table, extract(new_part_name, '^[^_]+') as partition_id FROM clusterAllReplicas('{cluster}', system.replication_queue) ) as rq
LEFT JOIN
(SELECT database, table, partition_id, sum(rows) as rows_count, count() as part_count
FROM clusterAllReplicas('{cluster}', system.parts)
WHERE active GROUP BY database, table, partition_id
) as p
USING (database, table, partition_id)
WHERE p.rows_count = 0 AND p.part_count = 0
FORMAT TSVRaw;
6.8 - Can detached parts in ClickHouse® be dropped?
Cleaning up detached parts without data loss
Overview
This article explains detached parts in ClickHouse®: why they appear, what detached reasons mean, and how to clean up safely.
Use it when investigating:
You can perform two main operations with detached parts:
Recovery: If you’re missing data due to misconfiguration or an error (such as connecting to the wrong ZooKeeper), check the detached parts. The missing data might be recoverable through manual intervention.
Cleanup: Otherwise, clean up the detached parts periodically to free disk space.
Version Scope
Primary scope: ClickHouse 23.10+.
Compatibility note:
In 22.6-23.9, there was optional timeout-based auto-removal for some detached reasons.
In 23.10+, this option was removed; detached-part cleanup is intentionally manual.
Important distinction for ReplicatedMergeTree: ClickHouse® tracks expected parts from ZooKeeper and unexpected parts found locally:
Broken expected parts increment the max_suspicious_broken_parts counter (can block startup).
Broken unexpected parts use a separate counter and do not block startup.
Detailed actions based on the status of detached parts:
Safe to delete (after validation):
ignored
clone.
Temporary, do not delete while in progress:
attaching
deleting
tmp-fetch.
Investigate before deleting:
broken
broken-on-start
broken-from-backup
covered-by-broken
noquorum
merge-not-byte-identical
mutate-not-byte-identical
Monitoring of detached parts
You can find information in clickhouse-server.log, for what happened when the parts were detached during startup. If clickhouse-server.log is lost it might be impossible to figure out what happened and why the parts were detached.
Another good source of information is system.part_log table, which can be used to investigate the history/timeline of specific parts involved in the detaching process:
SELECTevent_time,event_type,database,`table`,part_name,partition_id,rows,size_in_bytes,merged_from,error,exceptionFROMsystem.part_logWHEREpart_nameIN('all_1_5_0','all_6_10_1')-- example part names, replace with actual part names from detached_parts or clickhouse-server.log
ORDERBYpart_nameASC,event_timeASC
Also system.detached_parts table contains useful information:
It is important to monitor for detached parts and act quickly when they appear. You can use system.asynchronous_metric/metric_log to track some metrics.
Use system.asynchronous_metrics for current values:
The DROP DETACHED command in ClickHouse® is used to remove parts or partitions that have previously been detached (i.e., moved to the detached directory and forgotten by the server). The syntax is:
Warning
Be careful before dropping any detached part or partition. Validate that data is no longer needed and keep a backup before running destructive commands.
This command removes the specified part or all parts of the specified partition from the detached directory. For more details on how to specify the partition expression, see the documentation on how to set the partition expression DROP DETACHED PARTITION|PART.
Note: You must have the allow_drop_detached setting enabled to use this command.
DROP DML
Warning
Review generated DROP DETACHED commands carefully before executing them. They can cause data loss if used incorrectly. Ensure you have a valid backup before destructive operations. Treat generated commands as candidates for manual review, not as commands to run blindly.
Here is a query that can help with investigations. It looks for active parts containing the same data blocks as the detached parts and generates commands to drop the detached parts.
SELECTa.*,concat('ALTER TABLE ',a.database,'.',a.table,' DROP DETACHED PART ''',a.name,''' SETTINGS allow_drop_detached=1;',' -- db=',a.database,' table=',a.table,' reason=',a.reason,' partition_id=',a.partition_id,' min_block=',toString(a.min_block_number),' max_block=',toString(a.max_block_number))ASdrop_commandFROMsystem.detached_partsASaLEFTJOIN(SELECTdatabase,table,partition_id,name,active,min_block_number,max_block_numberFROMsystem.partsWHEREactive)bONa.database=b.databaseANDa.table=b.tableANDa.partition_id=b.partition_idWHEREa.min_block_numberISNOTNULLANDa.max_block_numberISNOTNULLANDa.min_block_number>=b.min_block_numberANDa.max_block_number<=b.max_block_numberORDERBYa.table,a.min_block_number,a.max_block_numberSETTINGSjoin_use_nulls=1
For each column in a table, unique value counts, min/max, and top 5 most frequent values
SELECTcount(),*APPLY(uniq),*APPLY(max),*APPLY(min),*APPLY(topK(5))FROMtable_nameFORMATVertical;-- also you can add * APPLY (entropy) to show entropy (i.e. 'randomness' of the column).
-- if the table is huge add some WHERE condition to slice some 'representative' data range, for example single month / week / day of data.
Understanding the ingest pattern:
For parts which are recently created and are unmerged, returns row, size, and count information by db and table.
High count, low rows: lots of small parts
High countif(NOT active) relative to count(): merges are keeping up
Low countIf(NOT active) relative to count(): merges may be falling behind
uniqExact(partition): how many partitions are being written to
Partition distribution analysis, aggregating system.parts metrics by partition. The quantiles results can indicate whether there is skewed distribution of data between partitions.
6.10 - Notes on Various Errors with respect to replication and distributed connections
Notes on errors related to replication and distributed connections
ClickHouseDistributedConnectionExceptions
This alert usually indicates that one of the nodes isn’t responding or that there’s an interconnectivity issue. Debug steps:
1. Check Cluster Connectivity
Verify connectivity inside the cluster by running:
SELECT count() FROM clusterAllReplicas('{cluster}', cluster('{cluster}', system.one))
2. Check for Errors
Run the following queries to see if any nodes report errors:
SELECT hostName(), * FROM clusterAllReplicas('{cluster}', system.clusters) WHERE errors_count > 0;
SELECT hostName(), * FROM clusterAllReplicas('{cluster}', system.errors) WHERE last_error_time > now() - 3600 ORDER BY value;
Depending on the results, ensure that the affected node is up and responding to queries. Also, verify that connectivity (DNS, routes, delays) is functioning correctly.
Unless you’re seeing huge numbers, these alerts can generally be ignored. They’re often a sign of temporary replication issues that ClickHouse resolves on its own. However, if the issue persists or increases rapidly, follow the steps to debug replication issues:
Check the replication status using tables such as system.replicas and system.replication_queue.
Examine server logs, system.errors, and system load for any clues.
Try to restart the replica (SYSTEM RESTART REPLICA db_name.table_name command) and, if necessary, contact Altinity support.
6.11 - Number of active parts in a partition
Number of active parts in a partition
Q: Why do I have several active parts in a partition? Why ClickHouse® does not merge them immediately?
A: CH does not merge parts by time
Merge scheduler selects parts by own algorithm based on the current node workload / number of parts / size of parts.
CH merge scheduler balances between a big number of parts and a wasting resources on merges.
Merges are CPU/DISK IO expensive. If CH will merge every new part then all resources will be spend on merges and will no resources remain on queries (selects ).
SELECT
database,
table,
partition,
sum(rows) AS rows,
count() AS part_count
FROM system.parts
WHERE (active = 1) AND (table LIKE '%') AND (database LIKE '%')
GROUP BY
database,
table,
partition
ORDER BY part_count DESC
limit 20
All you need to know about ClickHouse® schema design, including materialized view, limitations, lowcardinality, codecs.
7.1 - ClickHouse® limitations
How much is too much?
In most of the cases ClickHouse® doesn’t have any hard limits. But obviously there there are some practical limitation / barriers for different things - often they are caused by some system / network / filesystem limitation.
So after reaching some limits you can get different kind of problems, usually it never a failures / errors, but different kinds of degradations (slower queries / high cpu/memory usage, extra load on the network / zookeeper etc).
While those numbers can vary a lot depending on your hardware & settings there is some safe ‘Goldilocks’ zone where ClickHouse work the best with default settings & usual hardware.
Number of tables (system-wide, across all databases)
non-replicated MergeTree-family
tables = few thousands is still acceptable, if you don’t do realtime inserts in more that few dozens of them. See #32259
ReplicatedXXXMergeTree = few hundreds is still acceptable, if you don’t do realtime inserts in more that few dozens of them. Every Replicated table comes with it’s own cost (need to do housekeeping operations, monitoring replication queues etc). See #31919
Log family table = even dozens of thousands is still ok, especially if database engine = Lazy is used.
Number of databases
Fewer than number of tables (above). Dozens / hundreds is usually still acceptable.
Number of inserts per seconds
For usual (non async) inserts - dozen is enough. Every insert creates a part, if you will create parts too often, ClickHouse will not be able to merge them and you will be getting ’too many parts’.
One is enough. Single ClickHouse can use resources of the node very efficiently, and it may require some complicated tuning to run several instances on a single node.
Number of parts / partitions (system-wide, across all databases)
Number of tables & partitions touched by a single insert
If you have realtime / frequent inserts no more than few.
For the inserts are rare - up to couple of dozens.
Number of parts in the single table
More than ~ 5 thousands may lead to issues with alters in Replicated tables (caused by jute.maxbuffer overrun, see details
), and query speed degradation.
Disk size per shard
Less than 10TB of compressed data per server. Bigger disk are harder to replace / resync.
Number of shards
Dozens is still ok. More may require having more complex (non-flat) routing.
Number of replicas in a single shard
2 is minimum for HA. 3 is a ‘golden standard’. Up to 6-8 is still ok. If you have more with realtime inserts - it can impact the zookeeper traffic.
3 (Three) for most of the cases is enough (you can loose one node). Using more nodes allows to scale up read throughput for zookeeper, but doesn’t improve writes at all.
Up to few. The less the better if the table is getting realtime inserts. (no matter if MV are chained or all are fed from the same source table).
The more you have the more costly your inserts are, and the bigger risks to get some inconsistencies between some MV (inserts to MV and main table are not atomic).
If the table doesn’t have realtime inserts you can have more MV.
Number of projections inside a single table.
Up to few. Similar to MV above.
Number of secondary indexes a single table.
One to about a dozen. Different types of indexes has different penalty, bloom_filter is 100 times heavier than min_max index
At some point your inserts will slow down. Try to create possible minimum of indexes.
You can combine many columns into a single index and this index will work for any predicate but create less impact.
High number of Kafka tables maybe quite expensive (every consumer = very expensive librdkafka object with several threads inside).
Usually alternative approaches are preferable (mixing several datastreams in one topic, denormalizing, consuming several topics of identical structure with a single Kafka table, etc).
If you really need a lot of Kafka tables you may need more ram / CPU on the node and
increase background_message_broker_schedule_pool_size (default is 16) to the number of Kafka tables.
There is quite common requirement to do deduplication on a record level in ClickHouse.
Sometimes duplicates are appear naturally on collector side.
Sometime they appear due the the fact that message queue system (Kafka/Rabbit/etc) offers at-least-once guarantees.
Sometimes you just expect insert idempotency on row level.
For the general case, ClickHouse does not provide a cheap built-in way to enforce arbitrary row-level uniqueness across an already large table.
That is a different problem from retry-safe insert deduplication, which ClickHouse supports separately for MergeTree family inserts.
The reason is simple: to check if the row already exists you need a lookup that is closer to a key-value access pattern (which is not what ClickHouse is optimized for),
in general case - across the whole huge table (which can be terabyte/petabyte size).
But there many usecases when you can achieve something like row-level deduplication in ClickHouse:
Approach 0. Make deduplication before ingesting data to ClickHouse
Pros:
you have full control
clean and simple schema and selects in ClickHouse
Cons:
extra coding and ‘moving parts’, storing some ids somewhere
check if row exists in ClickHouse before insert can give non-satisfying results if you use ClickHouse cluster (i.e. Replicated / Distributed tables) - due to eventual consistency.
Approach 1. Allow duplicates during ingestion.
Remove them on SELECT level (by things like GROUP BY)
Pros:
simple inserts
Cons:
complicates selects
all selects will be significantly slower
Approach 2. Eventual deduplication using ReplacingMergeTree
Pros:
simple
Cons:
can force you to use suboptimal ORDER BY (which will guarantee record uniqueness)
deduplication is eventual - you never know when it will happen, and you will get some duplicates if you don’t use FINAL
selects with FINAL (select * from table_name FINAL) add overhead and should be benchmarked
Approach 5. Keep data fragments where duplicates are possible to isolate.
Usually you can expect the duplicates only in some time window (like 5 minutes, or one hour, or something like that).
You can put that ‘dirty’ data in separate place, and put it to final MergeTree table after deduplication window timeout.
For example - you insert data in some tiny tables (Engine=StripeLog) with minute suffix, and move data from tinytable older that X minutes to target MergeTree (with some external queries).
In the meanwhile you can see realtime data using Engine=Merge / VIEWs etc.
Pros:
good control
no duplicated in target table
perfect ingestion speed
Cons:
quite complicated
Approach 6. Deduplication using MV pipeline.
You insert into some temporary table (even with Engine=Null) and MV do join or subselect
(which will check the existence of arrived rows in some time frame of target table) and copy new only rows to destination table.
Pros:
don’t impact the select speed
Cons:
complicated
for clusters can be inaccurate due to eventual consistency
slows down inserts significantly (every insert will need to do lookup in target table first)
In all case: due to eventual consistency of ClickHouse replication you can still get duplicates if you insert into different replicas/shards.
7.3 - Column backfilling with alter/update using a dictionary
Column backfilling with alter/update using a dictionary
Column backfilling
Sometimes you need to add a column into a huge table and backfill it with a data from another source, without reingesting all data.
Replicated setup
In case of a replicated / sharded setup you need to have the dictionary and source table (dict_table / item_dict) on all nodes and they have to all have EXACTLY the same data. The easiest way to do this is to make dict_table replicated.
In this case, you will need to set the setting allow_nondeterministic_mutations=1 on the user that runs the ALTER TABLE. See the ClickHouse® docs
for more information about this setting.
Here is an example.
createdatabasetest;usetest;-- table with an existing data, we need to backfill / update S column
createtablefact(key1UInt64,key2String,key3String,DDate,SString)EngineMergeTreepartitionbyDorderby(key1,key2,key3);-- example data
insertintofactselectnumber,toString(number%103),toString(number%13),today(),toString(number)fromnumbers(1e9);0rowsinset.Elapsed:155.066sec.Processed1.00billionrows,8.00GB(6.45millionrows/s.,51.61MB/s.)insertintofactselectnumber,toString(number%103),toString(number%13),today()-30,toString(number)fromnumbers(1e9);0rowsinset.Elapsed:141.594sec.Processed1.00billionrows,8.00GB(7.06millionrows/s.,56.52MB/s.)insertintofactselectnumber,toString(number%103),toString(number%13),today()-60,toString(number)fromnumbers(1e10);0rowsinset.Elapsed:1585.549sec.Processed10.00billionrows,80.01GB(6.31millionrows/s.,50.46MB/s.)selectcount()fromfact;12000000000-- 12 billions rows.
-- table - source of the info to update
createtabledict_table(key1UInt64,key2String,key3String,SString)EngineMergeTreeorderby(key1,key2,key3);-- example data
insertintodict_tableselectnumber,toString(number%103),toString(number%13),toString(number)||'xxx'fromnumbers(1e10);0rowsinset.Elapsed:1390.121sec.Processed10.00billionrows,80.01GB(7.19millionrows/s.,57.55MB/s.)-- DICTIONARY witch will be the source for update / we cannot query dict_table directly
CREATEDICTIONARYitem_dict(key1UInt64,key2String,key3String,SString)PRIMARYKEYkey1,key2,key3SOURCE(CLICKHOUSE(TABLEdict_tableDB'test'USER'default'))LAYOUT(complex_key_cache(size_in_cells50000000))Lifetime(60000);-- let's test that the dictionary is working
selectdictGetString('item_dict','S',tuple(toUInt64(1),'1','1'));┌─dictGetString('item_dict','S',tuple(toUInt64(1),'1','1'))─┐│1xxx│└───────────────────────────────────────────────────────────────┘1rowsinset.Elapsed:0.080sec.SELECTdictGetString('item_dict','S',(toUInt64(1111111),'50','1'))┌─dictGetString('item_dict','S',tuple(toUInt64(1111111),'50','1'))─┐│1111111xxx│└──────────────────────────────────────────────────────────────────────┘1rowsinset.Elapsed:0.004sec.-- Now let's lower number of simultaneous updates/mutations
selectvaluefromsystem.settingswherenamelike'%background_pool_size%';┌─value─┐│16│└───────┘altertablefactmodifysettingnumber_of_free_entries_in_pool_to_execute_mutation=15;-- only one mutation is possible per time / 16 - 15 = 1
-- the mutation itself
altertabletest.factupdateS=dictGetString('test.item_dict','S',tuple(key1,key2,key3))where1;-- mutation took 26 hours and item_dict used bytes_allocated: 8187277280
select*fromsystem.mutationswherenotis_done\GRow1:──────database:testtable:factmutation_id:mutation_11452.txtcommand:UPDATES=dictGetString('test.item_dict','S',(key1,key2,key3))WHERE1create_time:2022-01-2920:21:00block_numbers.partition_id:['']block_numbers.number:[11452]parts_to_do_names:['20220128_1_954_4','20211230_955_1148_3','20211230_1149_1320_3','20211230_1321_1525_3','20211230_1526_1718_3','20211230_1719_1823_3','20211230_1824_1859_2','20211230_1860_1895_2','20211230_1896_1900_1','20211230_1901_1906_1','20211230_1907_1907_0','20211230_1908_1908_0','20211130_2998_9023_5','20211130_9024_10177_4','20211130_10178_11416_4','20211130_11417_11445_2','20211130_11446_11446_0']parts_to_do:17is_done:0latest_failed_part:latest_fail_time:1970-01-0100:00:00latest_fail_reason:SELECTtable,(elapsed*(1/progress))-elapsed,elapsed,progress,is_mutation,formatReadableSize(total_size_bytes_compressed)ASsize,formatReadableSize(memory_usage)ASmemFROMsystem.mergesORDERBYprogressDESC┌─table────────────────────────┬─minus(multiply(elapsed,divide(1,progress)),elapsed)─┬─────────elapsed─┬────────────progress─┬─is_mutation─┬─size───────┬─mem───────┐│fact│7259.920140111059│8631.476589565│0.5431540560211632│1│1.89GiB│0.00B││fact│60929.22808705666│23985.610558929│0.28246665649246827│1│9.86GiB│4.25MiB│└──────────────────────────────┴────────────────────────────────────────────────────────┴─────────────────┴─────────────────────┴─────────────┴────────────┴───────────┘SELECT*FROMsystem.dictionariesWHEREname='item_dict'\GRow1:──────database:testname:item_dictuuid:28fda092-260f-430f-a8fd-a092260f330fstatus:LOADEDorigin:28fda092-260f-430f-a8fd-a092260f330ftype:ComplexKeyCachekey.names:['key1','key2','key3']key.types:['UInt64','String','String']attribute.names:['S']attribute.types:['String']bytes_allocated:8187277280query_count:12000000000hit_rate:1.6666666666666666e-10found_rate:1element_count:67108864load_factor:1source:ClickHouse:test.dict_tablelifetime_min:0lifetime_max:60000loading_start_time:2022-01-2920:20:50last_successful_update_time:2022-01-2920:20:51loading_duration:0.829last_exception:-- Check that data is updated
SELECT*FROMtest.factWHEREkey1=11111┌──key1─┬─key2─┬─key3─┬──────────D─┬─S────────┐│11111│90│9│2021-12-30│11111xxx││11111│90│9│2022-01-28│11111xxx││11111│90│9│2021-11-30│11111xxx│└───────┴──────┴──────┴────────────┴──────────┘
7.4 - Functions to count uniqs
Functions to count uniqs.
Functions to count uniqs
Function
Function(State)
StateSize
Result
QPS
uniqExact
uniqExactState
1600003
100000
59.23
uniq
uniqState
200804
100315
85.55
uniqCombined
uniqCombinedState
98505
100314
108.09
uniqCombined(12)
uniqCombinedState(12)
3291
98160
151.64
uniqCombined(15)
uniqCombinedState(15)
24783
100768
110.18
uniqCombined(18)
uniqCombinedState(18)
196805
100332
101.56
uniqCombined(20)
uniqCombinedState(20)
786621
100088
65.05
uniqCombined64(12)
uniqCombined64State(12)
3291
98160
164.96
uniqCombined64(15)
uniqCombined64State(15)
24783
100768
133.96
uniqCombined64(18)
uniqCombined64State(18)
196805
100332
110.85
uniqCombined64(20)
uniqCombined64State(20)
786621
100088
66.48
uniqHLL12
uniqHLL12State
2651
101344
177.91
uniqTheta
uniqThetaState
32795
98045
144.05
uniqUpTo(100)
uniqUpToState(100)
1
101
222.93
Stats collected via script below on 22.2
funcname=("uniqExact""uniq""uniqCombined""uniqCombined(12)""uniqCombined(15)""uniqCombined(18)""uniqCombined(20)""uniqCombined64(12)""uniqCombined64(15)""uniqCombined64(18)""uniqCombined64(20)""uniqHLL12""uniqTheta""uniqUpTo(100)")funcname2=("uniqExactState""uniqState""uniqCombinedState""uniqCombinedState(12)""uniqCombinedState(15)""uniqCombinedState(18)""uniqCombinedState(20)""uniqCombined64State(12)""uniqCombined64State(15)""uniqCombined64State(18)""uniqCombined64State(20)""uniqHLL12State""uniqThetaState""uniqUpToState(100)")length=${#funcname[@]}for((j=0; j<length; j++ ));dof1="${funcname[$j]}"f2="${funcname2[$j]}"size=$( clickhouse-client -q "select ${f2}(toString(number)) from numbers_mt(100000) FORMAT RowBinary"| wc -c )result="$( clickhouse-client -q "select ${f1}(toString(number)) from numbers_mt(100000)")"time=$( rm /tmp/clickhouse-benchmark.json;echo"select ${f1}(toString(number)) from numbers_mt(100000)"| clickhouse-benchmark -i200 --json=/tmp/clickhouse-benchmark.json &>/dev/null; cat /tmp/clickhouse-benchmark.json | grep QPS )printf"|%s|%s,%s,%s,%s\n""$f1""$f2""$size""$result""$time"done
groupBitmap
Use Roaring Bitmaps
underneath.
Return amount of uniq values.
Can be used with Int* types
Works really great when your values quite similar. (Low memory usage / state size)
Example with blockchain data, block_number is monotonically increasing number.
Copy data from example_table_old into example_table_temp
a. Use this query to generate a list of INSERT statements
-- old Clickhouse versions before a support of `where _partition_id`
selectconcat('insert into example_table_temp select * from example_table_old where toYYYYMM(date)=',partition)ascmd,database,table,partition,sum(rows),sum(bytes_on_disk),count()fromsystem.partswheredatabase='default'andtable='example_table_old'groupbydatabase,table,partitionorderbypartition-- newer Clickhouse versions with a support of `where _partition_id`
selectconcat('insert into example_table_temp select * from ',table,' where _partition_id = \'',partition_id, '\';')ascmd,database,table,partition,sum(rows),sum(bytes_on_disk),count()fromsystem.partswheredatabase='default'andtable='example_table_old'groupbydatabase,table,partition_id,partitionorderbypartition_id
After each query compare the number of rows in both tables.
If the INSERT statement was interrupted and failed to copy data, drop the partition in example_table and repeat the INSERT.
If a partition was copied successfully, proceed to the next partition.
Attach data from the intermediate table to example_table
a. Use this query to generate a list of ATTACH statements
selectconcat('alter table example_table attach partition id ''',partition,''' from example_table_temp')ascmd,database,table,partition,sum(rows),sum(bytes_on_disk),count()fromsystem.partswheredatabase='default'andtable='example_table_temp'groupbydatabase,table,partitionorderbypartition
Using ClickHouse® features to avoid duplicate data
Replicated tables have a special feature insert deduplication (enabled by default).
Documentation:Data blocks are deduplicated. For multiple writes of the same data block (data blocks of the same size containing the same rows in the same order), the block is only written once. The reason for this is in case of network failures when the client application does not know if the data was written to the DB, so the INSERT query can simply be repeated. It does not matter which replica INSERTs were sent to with identical data. INSERTs are idempotent. Deduplication parameters are controlled by merge_tree server settings.
Example
createtabletest_insert(AInt64)Engine=ReplicatedMergeTree('/clickhouse/cluster_test/tables/{table}','{replica}')orderbyA;insertintotest_insertvalues(1);insertintotest_insertvalues(1);insertintotest_insertvalues(1);insertintotest_insertvalues(1);select*fromtest_insert;┌─A─┐│1│-- only one row has been inserted, the other rows were deduplicated
└───┘altertabletest_insertdeletewhere1;-- that single row was removed
insertintotest_insertvalues(1);select*fromtest_insert;0rowsinset.Elapsed:0.001sec.-- the last insert was deduplicated again,
-- because `alter ... delete` does not clear deduplication checksums
-- only `alter table drop partition` and `truncate` clear checksums
In clickhouse-server.log you may see trace messages Block with ID ... already exists locally as part ... ignoring it
# cat /var/log/clickhouse-server/clickhouse-server.log|grep test_insert|grep Block
..17:52:45.064974.. Block with ID all_7615936253566048997_747463735222236827 already exists locally as part all_0_0_0; ignoring it.
..17:52:45.068979.. Block with ID all_7615936253566048997_747463735222236827 already exists locally as part all_0_0_0; ignoring it.
..17:52:45.072883.. Block with ID all_7615936253566048997_747463735222236827 already exists locally as part all_0_0_0; ignoring it.
..17:52:45.076738.. Block with ID all_7615936253566048997_747463735222236827 already exists locally as part all_0_0_0; ignoring it.
Deduplication checksums are stored in Zookeeper
in /blocks table’s znode for each partition separately, so when you drop partition, they could be identified and removed for this partition.
(during alter table delete it’s impossible to match checksums, that’s why checksums stay in Zookeeper).
setinsert_deduplicate=0;-- insert_deduplicate is now disabled in this session
insertintotest_insertvalues(1);insertintotest_insertvalues(1);insertintotest_insertvalues(1);select*fromtest_insertformatPrettyCompactMonoBlock;┌─A─┐│1││1││1│-- all 3 insterted rows are in the table
└───┘altertabletest_insertdeletewhere1;insertintotest_insertvalues(1);insertintotest_insertvalues(1);select*fromtest_insertformatPrettyCompactMonoBlock;┌─A─┐│1││1│└───┘
Insert deduplication is a user-level setting, it can be disabled in a session or in a user’s profile (insert_deduplicate=0).
clickhouse-client --insert_deduplicate=0 ....
How to disable insert_deduplicate by default for all queries:
createtabletest_insert(AInt64)Engine=MergeTreeorderbyAsettingsnon_replicated_deduplication_window=100;-- 100 - how many latest checksums to store
insertintotest_insertvalues(1);insertintotest_insertvalues(1);insertintotest_insertvalues(1);insertintotest_insertvalues(2);insertintotest_insertvalues(2);select*fromtest_insertformatPrettyCompactMonoBlock;┌─A─┐│2││1│└───┘
In case of non-replicated tables deduplication checksums are stored in files in the table’s folder:
Checksums are calculated not from the inserted data but from formed parts.
Insert data is separated to parts by table’s partitioning.
Parts contain rows sorted by the table’s order by and all values of functions (i.e. now()) or Default/Materialized columns are expanded.
Example with partial insertion because of partitioning:
createtabletest_insert(AInt64,BInt64)Engine=MergeTreepartitionbyBorderbyAsettingsnon_replicated_deduplication_window=100;insertintotest_insertvalues(1,1);insertintotest_insertvalues(1,1)(1,2);select*fromtest_insertformatPrettyCompactMonoBlock;┌─A─┬─B─┐│1│1││1│2│-- the second insert was skipped for only one partition!!!
└───┴───┘
Example with deduplication despite the rows order:
droptabletest_insert;createtabletest_insert(AInt64,BInt64)Engine=MergeTreeorderby(A,B)settingsnon_replicated_deduplication_window=100;insertintotest_insertvalues(1,1)(1,2);insertintotest_insertvalues(1,2)(1,1);-- the order of rows is not equal with the first insert
select*fromtest_insertformatPrettyCompactMonoBlock;┌─A─┬─B─┐│1│1││1│2│└───┴───┘2rowsinset.Elapsed:0.001sec.-- the second insert was skipped despite the rows order
Example to demonstrate how Default/Materialize columns are expanded:
droptabletest_insert;createtabletest_insert(AInt64,BInt64Defaultrand())Engine=MergeTreeorderbyAsettingsnon_replicated_deduplication_window=100;insertintotest_insert(A)values(1);-- B calculated as rand()
insertintotest_insert(A)values(1);-- B calculated as rand()
select*fromtest_insertformatPrettyCompactMonoBlock;┌─A─┬──────────B─┐│1│3467561058││1│3981927391│└───┴────────────┘insertintotest_insert(A,B)values(1,3467561058);-- B is not calculated / will be deduplicated
select*fromtest_insertformatPrettyCompactMonoBlock;┌─A─┬──────────B─┐│1│3981927391││1│3467561058│└───┴────────────┘
Example to demonstrate how functions are expanded:
Since ClickHouse® 22.2 there is a new setting insert_deduplication_token
.
This setting allows you to define an explicit token that will be used for deduplication instead of calculating a checksum from the inserted data.
CREATETABLEtest_table(AInt64)ENGINE=MergeTreeORDERBYASETTINGSnon_replicated_deduplication_window=100;INSERTINTOtest_tableSETTINGSinsert_deduplication_token='test'VALUES(1);-- the next insert won't be deduplicated because insert_deduplication_token is different
INSERTINTOtest_tableSETTINGSinsert_deduplication_token='test1'VALUES(1);-- the next insert will be deduplicated because insert_deduplication_token
-- is the same as one of the previous
INSERTINTOtest_tableSETTINGSinsert_deduplication_token='test'VALUES(2);SELECT*FROMtest_table┌─A─┐│1│└───┘┌─A─┐│1│└───┘
7.8 - JSONEachRow, Tuples, Maps and Materialized Views
How to use Tuple() and Map() with nested JSON messages in MVs
Using JSONEachRow with Tuple() in Materialized views
Sometimes we can have a nested json message with a fixed size structure like this:
We can use the above table as a source for a materialized view, like it was a Kafka table and in case our message has unexpected keys we make the Kafka table ignore them with the setting (23.3+):
💡 Beware of column names in ClickHouse® they are Case sensitive. If a JSON message has the key names in Capitals, the Kafka/Source table should have the same column names in Capitals.
💡 Also this Tuple() approach is not for Dynamic json schemas as explained above. In the case of having a dynamic schema, use the classic approach using JSONExtract set of functions. If the schema is fixed, you can use Tuple() for JSONEachRow format but you need to use classic tuple notation (using index reference) inside the MV, because using named tuples inside the MV won’t work:
💡 tuple.1 AS column1, tuple.2 AS column2CORRECT!
💡 tuple.column1 AS column1, tuple.column2 AS column2WRONG!
💡 use AS (alias) for aggregated columns or columns affected by functions because MV do not work by positional arguments like SELECTs,they work by names**
Example:
parseDateTime32BestEffort(t_date)WRONG!
parseDateTime32BestEffort(t_date) AS t_dateCORRECT!
Using JSONEachRow with Map() in Materialized views
Sometimes we can have a nested json message with a dynamic size like these and all elements inside the nested json must be of the same type:
ETL vs Materialized Views vs Projections in ClickHouse®
Pre-Aggregation approaches: ETL vs Materialized Views vs Projections
ETL
MV
Projections
Realtime
no
yes
yes
How complex queries can be used to build the preaggregaton
any
complex
very simple
Impacts the insert speed
no
yes
yes
Are inconsistancies possible
Depends on ETL. If it process the errors properly - no.
yes (no transactions / atomicity)
no
Lifetime of aggregation
any
any
Same as the raw data
Requirements
need external tools/scripting
is a part of database schema
is a part of table schema
How complex to use in queries
Depends on aggregation, usually simple, quering a separate table
Depends on aggregation, sometimes quite complex, quering a separate table
Very simple, quering the main table
Can work correctly with ReplacingMergeTree as a source
Yes
No
No
Can work correctly with CollapsingMergeTree as a source
Yes
For simple aggregations
For simple aggregations
Can be chained
Yes (Usually with DAGs / special scripts)
Yes (but may be not straightforward, and often is a bad idea)
No
Resources needed to calculate the increment
May be significant
Usually tiny
Usually tiny
7.10 - SnowflakeID for Efficient Primary Keys
SnowflakeID for Efficient Primary Keys
In data warehousing (DWH) environments, the choice of primary key (PK) can significantly impact performance, particularly in terms of RAM usage and query speed. This is where SnowflakeID
comes into play, providing a robust solution for PK management. Here’s a deep dive into why and how Snowflake IDs are beneficial and practical implementation examples.
Why Snowflake ID?
Natural IDs Suck: Natural keys derived from business data can lead to various issues like complexity and instability. Surrogate keys, on the other hand, are system-generated and stable.
Surrogate keys simplify joins and indexing, which is crucial for performance in large-scale data warehousing.
Monotonic or sequential IDs help maintain the order of entries, which is essential for performance tuning and efficient range queries.
Having both a timestamp and a unique ID in the same column allows for fast filtering of rows during SELECT operations. This is particularly useful for time-series data.
Building Snowflake IDs
There are two primary methods to construct the lower bits of a Snowflake ID:
Hash of Important Columns:
Using a hash function on significant columns ensures uniqueness and distribution.
Row Number in insert batch
Utilizing the row number within data blocks provides a straightforward approach to generating unique identifiers.
Implementation as UDF
Here’s how to implement Snowflake IDs using standard SQL functions while utilizing second and millisecond timestamps.
Pack hash to lower 22 bits for DateTime64 and 32bits for DateTime
Note: Using User-Defined Functions (UDFs) in CREATE TABLE statements is not always useful, as they expand to create table DDL, and changing them is inconvenient.
Using a Null Table, Materialized View, and rowNumberInAllBlocks
A more efficient approach involves using a Null table and materialized views.
Converting from UUID to SnowFlakeID for subsequent events
Consider that your event stream only has a UUID column identifying a particular user. Registration time that can be used as a base for SnowFlakeID is presented only in the first ‘register’ event, but not in subsequent events. It’s easy to generate SnowFlakeID for the register event, but next, we need to get it from some other table without disturbing the ingestion process too much. Using Hash JOINs in Materialized Views is not recommended, so we need some “nested loop join” to get data fast. In Clickhouse, the “nested loop join” is still not supported, but Direct Dictionary can work around it.
CREATETABLEUUID2ID_store(user_idUUID,idUInt64)ENGINE=MergeTree()-- EmbeddedRocksDB can be used instead
ORDERBYuser_idsettingsindex_granularity=256;CREATEDICTIONARYUUID2ID_dict(user_idUUID,idUInt64)PRIMARYKEYuser_idLAYOUT(DIRECT())SOURCE(CLICKHOUSE(TABLE'UUID2ID_store'));CREATEORREPLACEFUNCTIONUUID2IDAS(uuid)->dictGet('UUID2ID_dict',id,uuid);CREATEMATERIALIZEDVIEW_toUUID_storeTOUUID2ID_storeASselectuser_id,toSnowflake64(event_time,cityHash64(user_id))asidfromActions;
Conclusion
Snowflake IDs provide an efficient mechanism for generating unique, monotonic primary keys, which are essential for optimizing query performance in data warehousing environments. By combining timestamps and unique identifiers, snowflake IDs facilitate faster row filtering and ensure stable, surrogate key generation. Implementing these IDs using SQL functions and materialized views ensures that your data warehouse remains performant and scalable.
7.11 - Two columns indexing
How to create ORDER BY suitable for filtering over two different columns in two different queries
Suppose we have telecom CDR data in which A party calls B party. Each data row consists of A party details: event_timestamp, A MSISDN , A IMEI, A IMSI , A start location, A end location , B MSISDN, B IMEI, B IMSI , B start location, B end location, and some other metadata.
Searches will use one of the A or B fields, for example, A IMSI, within the start and end time window.
A msisdn, A imsi, A imei values are tightly coupled as users rarely change their phones.
ClickHouse® primary skip index (ORDER BY/PRIMARY KEY) works great when you always include leading ORDER BY columns in the WHERE filter. There are exceptions for low-cardinality columns and high-correlated values, but here is another case. A & B both have high cardinality, and it seems that their correlation is at a medium level.
Various solutions exist, and their effectiveness largely depends on the correlation of different column data. Testing all solutions on actual data is necessary to select the best one.
mortonEncode
function requires UInt columns, but sometimes different column types are needed (like String or ipv6). In such a case, the cityHash64() function can be used both for inserting and querying:
that is quite typical pattern for timeseries databases
Cons
different metrics values stored in same columns (worse compression)
to use values of different datatype you need to cast everything to string or introduce few columns for values of different types.
not always nice as you need to repeat all ‘common’ fields for each row
if you need to select all data for one time point you need to scan several ranges of data.
2 Each measurement (with lot of metrics) in it’s own row
In that way you need to put all the metrics in one row (i.e.: timestamp, sourceid, ….)
That approach is usually a source of debates about how to put all the metrics in one row.
easy to extend, you can have very dynamic / huge number of metrics.
you can use Array(LowCardinality(String)) for storing metric names efficiently
good for sparse recording (each time point can have only 1% of all the possible metrics)
Cons
you need to extract all metrics for row to reach a single metric
not very handy / complicated non-standard syntax
different metrics values stored in single array (bad compression)
to use values of different datatype you need to cast everything to string or introduce few arrays for values of different types.
2c Using JSON
i.e.: timestamp, sourceid, metrics_data_json
Pros and cons:
Pros
easy to extend, you can have very dynamic / huge number of metrics.
the only option to store hierarchical / complicated data structures, also with arrays etc. inside.
good for sparse recording (each time point can have only 1% of all the possible metrics)
ClickHouse® has efficient API to work with JSON
nice if your data originally came in JSON (don’t need to reformat)
Cons
uses storage non efficiently
different metrics values stored in single array (bad compression)
you need to extract whole JSON field to reach single metric
slower than arrays
2d Using querystring-format URLs
i.e.: timestamp, sourceid, metrics_querystring
Same pros/cons as raw JSON, but usually bit more compact than JSON
Pros and cons:
Pros
ClickHouse has efficient API to work with URLs (extractURLParameter etc)
can have sense if you data came in such format (i.e. you can store GET / POST request data directly w/o reprocessing)
Cons
slower than arrays
2e Several ‘baskets’ of arrays
i.e.: timestamp, sourceid, metric_names_basket1, metric_values_basket1, …, metric_names_basketN, metric_values_basketN
The same as 2b, but there are several key-value arrays (‘basket’), and metric go to one particular basket depending on metric name (and optionally by metric type)
Pros and cons:
Pros
address some disadvantages of 2b (you need to read only single, smaller basket for reaching a value, better compression - less unrelated metrics are mixed together)
Cons
complex
2f Combined approach
In real life Pareto principle is correct for many fields.
For that particular case: usually you need only about 20% of metrics 80% of the time. So you can pick the metrics which are used intensively, and which have a high density, and extract them into separate columns (like in option 2a), leaving the rest in a common ’trash bin’ (like in variants 2b-2e).
With that approach you can have as many metrics as you need and they can be very dynamic. At the same time the most used metrics are stored in special, fine-tuned columns.
At any time you can decide to move one more metric to a separate column ALTER TABLE ... ADD COLUMN metricX Float64 MATERIALIZED metrics.value[indexOf(metrics.names,'metricX')];
Used by default. Extremely fast; good compression; balanced speed and efficiency
ZSTD(level)
Any
Good compression; pretty fast; best for high compression needs. Don’t use levels higher than 3.
LZ4HC(level)
Any
LZ4 High Compression algorithm with configurable level; slower but better compression than LZ4, but decompression is still fast.
Delta
Integer Types, Time Series Data, Timestamps
Preprocessor (should be followed by some compression codec). Stores difference between neighboring values; good for monotonically increasing data.
DoubleDelta
Integer Types, Time Series Data
Stores difference between neighboring delta values; suitable for time series data
Gorilla
Floating Point Types
Calculates XOR between current and previous value; suitable for slowly changing numbers
T64
Integer, Time Series Data, Timestamps
Preprocessor (should be followed by some compression codec). Crops unused high bits; puts them into a 64x64 bit matrix; optimized for 64-bit data types
GCD
Integer Numbers
Preprocessor (should be followed by some compression codec). Greatest common divisor compression; divides values by a common divisor; effective for divisible integer sequences
Supported since 20.10 (PR #15089
). On older versions you will get exception:
DB::Exception: Codec Delta is not applicable for Array(UInt64) because the data type is not of fixed size.
Q. I think I’m still trying to understand how de-normalized is okay - with my relational mindset, I want to move repeated string fields into their own table, but I’m not sure to what extent this is necessary
I will look at LowCardinality in more detail - I think it may work well here
A. If it’s a simple repetition, which you don’t need to manipulate/change in future - LowCardinality works great, and you usually don’t need to increase the system complexity by introducing dicts.
For example: name of team ‘Manchester United’ will rather not be changed, and even if it will you can keep the historical records with historical name. So normalization here (with some dicts) is very optional, and de-normalized approach with LowCardinality is good & simpler alternative.
From the other hand: if data can be changed in future, and that change should impact the reports, then normalization may be a big advantage.
For example if you need to change the used currency rare every day- it would be quite stupid to update all historical records to apply the newest exchange rate. And putting it to dict will allow to do calculations with latest exchange rate at select time.
For dictionary it’s possible to mark some of the attributes as injective. An attribute is called injective if different attribute values correspond to different keys. It would allow ClickHouse® to replace dictGet call in GROUP BY with cheap dict key.
7.15 - Flattened table
Flattened table
It’s possible to use dictionaries for populating columns of fact table.
CREATETABLEcustomer(`customer_id`UInt32,`first_name`String,`birth_date`Date,`sex`Enum('M'=1,'F'=2))ENGINE=MergeTreeORDERBYcustomer_idCREATETABLEorder(`order_id`UInt32,`order_date`DateTimeDEFAULTnow(),`cust_id`UInt32,`amount`Decimal(12,2))ENGINE=MergeTreePARTITIONBYtoYYYYMM(order_date)ORDERBY(order_date,cust_id,order_id)INSERTINTOcustomerVALUES(1,'Mike',now()-INTERVAL30YEAR,'M');INSERTINTOcustomerVALUES(2,'Boris',now()-INTERVAL40YEAR,'M');INSERTINTOcustomerVALUES(3,'Sofie',now()-INTERVAL24YEAR,'F');INSERTINTOorder(order_id,cust_id,amount)VALUES(50,1,15);INSERTINTOorder(order_id,cust_id,amount)VALUES(30,1,10);SELECT*EXCEPT'order_date'FROMorder┌─order_id─┬─cust_id─┬─amount─┐│30│1│10.00││50│1│15.00│└──────────┴─────────┴────────┘CREATEDICTIONARYcustomer_dict(`customer_id`UInt32,`first_name`String,`birth_date`Date,`sex`UInt8)PRIMARYKEYcustomer_idSOURCE(CLICKHOUSE(TABLE'customer'))LIFETIME(MIN0MAX300)LAYOUT(FLAT)ALTERTABLEorderADDCOLUMN`cust_first_name`StringDEFAULTdictGetString('default.customer_dict','first_name',toUInt64(cust_id)),ADDCOLUMN`cust_sex`Enum('M'=1,'F'=2)DEFAULTdictGetUInt8('default.customer_dict','sex',toUInt64(cust_id)),ADDCOLUMN`cust_birth_date`DateDEFAULTdictGetDate('default.customer_dict','birth_date',toUInt64(cust_id));INSERTINTOorder(order_id,cust_id,amount)VALUES(10,3,30);INSERTINTOorder(order_id,cust_id,amount)VALUES(20,3,60);INSERTINTOorder(order_id,cust_id,amount)VALUES(40,2,20);SELECT*EXCEPT'order_date'FROMorderFORMATPrettyCompactMonoBlock┌─order_id─┬─cust_id─┬─amount─┬─cust_first_name─┬─cust_sex─┬─cust_birth_date─┐│30│1│10.00│Mike│M│1991-08-05││50│1│15.00│Mike│M│1991-08-05││10│3│30.00│Sofie│F│1997-08-05││40│2│20.00│Boris│M│1981-08-05││20│3│60.00│Sofie│F│1997-08-05│└──────────┴─────────┴────────┴─────────────────┴──────────┴─────────────────┘ALTERTABLEcustomerUPDATEbirth_date=now()-INTERVAL35YEARWHEREcustomer_id=2;SYSTEMRELOADDICTIONARYcustomer_dict;ALTERTABLEorderUPDATEcust_birth_date=dictGetDate('default.customer_dict','birth_date',toUInt64(cust_id))WHERE1-- or if you do have track of changes it's possible to lower amount of dict calls
-- UPDATE cust_birth_date = dictGetDate('default.customer_dict', 'birth_date', toUInt64(cust_id)) WHERE customer_id = 2
SELECT*EXCEPT'order_date'FROMorderFORMATPrettyCompactMonoBlock┌─order_id─┬─cust_id─┬─amount─┬─cust_first_name─┬─cust_sex─┬─cust_birth_date─┐│30│1│10.00│Mike│M│1991-08-05││50│1│15.00│Mike│M│1991-08-05││10│3│30.00│Sofie│F│1997-08-05││40│2│20.00│Boris│M│1986-08-05││20│3│60.00│Sofie│F│1997-08-05│└──────────┴─────────┴────────┴─────────────────┴──────────┴─────────────────┘
ALTER TABLE order UPDATE would completely overwrite this column in table, so it’s not recommended to run it often.
Because ClickHouse® uses MPP order of execution of a single query can vary on each run, and you can get slightly different results from the float column every time you run the query.
Usually, this deviation is small, but it can be significant when some kind of arithmetic operation is performed on very large and very small numbers at the same time.
Some decimal numbers has no accurate float representation
clickhouse-client-q'select toString(number) s, number n, number/1000 f from numbers(100000000) format TSV'>speed.tsvclickhouse-client-q'select toString(number) s, number n, number/1000 f from numbers(100000000) format RowBinary'>speed.RowBinaryclickhouse-client-q'select toString(number) s, number n, number/1000 f from numbers(100000000) format Native'>speed.Nativeclickhouse-client-q'select toString(number) s, number n, number/1000 f from numbers(100000000) format CSV'>speed.csvclickhouse-client-q'select toString(number) s, number n, number/1000 f from numbers(100000000) format JSONEachRow'>speed.JSONEachRowclickhouse-client-q'select toString(number) s, number n, number/1000 f from numbers(100000000) format Parquet'>speed.parquetclickhouse-client-q'select toString(number) s, number n, number/1000 f from numbers(100000000) format Avro'>speed.avro-- Engine=Null does not have I/O / sorting overhead
-- we test only formats parsing performance.
createtablen(sString,nUInt64,fFloat64)Engine=Null-- clickhouse-client parses formats itself
-- it allows to see user CPU time -- time is used in a multithreaded application
-- another option is to disable parallelism `--input_format_parallel_parsing=0`
-- real -- wall / clock time.
timeclickhouse-client-t-q'insert into n format TSV'<speed.tsv2.693real0m2.728suser0m14.066stimeclickhouse-client-t-q'insert into n format RowBinary'<speed.RowBinary3.744real0m3.773suser0m4.245stimeclickhouse-client-t-q'insert into n format Native'<speed.Native2.359real0m2.382suser0m1.945stimeclickhouse-client-t-q'insert into n format CSV'<speed.csv3.296real0m3.328suser0m18.145stimeclickhouse-client-t-q'insert into n format JSONEachRow'<speed.JSONEachRow8.872real0m8.899suser0m30.235stimeclickhouse-client-t-q'insert into n format Parquet'<speed.parquet4.905real0m4.929suser0m5.478stimeclickhouse-client-t-q'insert into n format Avro'<speed.avro11.491real0m11.519suser0m12.166s
As you can see the JSONEachRow is the worst format (user 0m30.235s) for this synthetic dataset. Native is the best (user 0m1.945s). TSV / CSV are good in wall time but spend a lot of CPU (user time).
7.18 - IPs/masks
IPs/masks
How do I Store IPv4 and IPv6 Address In One Field?
There is a clean and simple solution for that. Any IPv4 has its unique IPv6 mapping:
Tables with engine Null don’t store data but can be used as a source for materialized views.
JSONAsString a special input format which allows to ingest JSONs into a String column. If the input has several JSON objects (comma separated) they will be interpreted as separate rows. JSON can be multiline.
createtableentrypoint(JString)Engine=Null;createtabledatastore(aString,iInt64,fFloat64)Engine=MergeTreeorderbya;creatematerializedviewjsonConvertertodatastoreasselect(JSONExtract(J,'Tuple(String,Tuple(Int64,Float64))')asx),x.1asa,x.2.1asi,x.2.2asffromentrypoint;$echo'{"s": "val1", "b2": {"i": 42, "f": 0.1}}'|\clickhouse-client-q"insert into entrypoint format JSONAsString"$echo'{"s": "val1","b2": {"i": 33, "f": 0.2}},{"s": "val1","b2": {"i": 34, "f": 0.2}}'|\clickhouse-client-q"insert into entrypoint format JSONAsString"SELECT*FROMdatastore;┌─a────┬──i─┬───f─┐│val1│42│0.1│└──────┴────┴─────┘┌─a────┬──i─┬───f─┐│val1│33│0.2││val1│34│0.2│└──────┴────┴─────┘
In CREATE TABLE statement allows specifying LowCardinality modifier for types of small fixed size (8 or less). Enabling this may increase merge times and memory consumption.
low_cardinality_max_dictionary_size
default - 8192
Maximum size (in rows) of shared global dictionary for LowCardinality type.
low_cardinality_use_single_dictionary_for_part
LowCardinality type serialization setting. If is true, than will use additional keys when global dictionary overflows. Otherwise, will create several shared dictionaries.
low_cardinality_allow_in_native_format
Use LowCardinality type in Native format. Otherwise, convert LowCardinality columns to ordinary for select query, and convert ordinary columns to required LowCardinality for insert query.
output_format_arrow_low_cardinality_as_dictionary
Enable output LowCardinality type as Dictionary Arrow type
7.21 - ClickHouse® Materialized Views
Making the most of this powerful ClickHouse® feature
ClickHouse® MATERIALIZED VIEWs behave like AFTER INSERT TRIGGER to the left-most table listed in their SELECT statement and never read data from disk. Only rows that are placed to the RAM buffer by INSERT are read.
Useful links
ClickHouse Materialized Views Illuminated, Part 1:
This way you have full control backfilling process (you can backfill in smaller parts to avoid timeouts, do some cross-checks / integrity-checks, change some settings, etc.)
FAQ
Q. Can I attach MATERIALIZED VIEW to the VIEW, or engine=Merge, or engine=MySQL, etc.?
Since MATERIALIZED VIEWs are updated on every INSERT to the underlying table and you can not insert anything to the usual VIEW, the materialized view update will never be triggered.
Normally, you should build MATERIALIZED VIEWs on the top of the table with the MergeTree engine family.
Q. I’ve created a materialized error with some error, and since it’s reading from Kafka, I don’t understand where the error is
Look into system.query_views_log table or server logs, or system.text_log table. Also, see the next question.
Q. How to debug misbehaving MATERIALIZED VIEW?
You can also attach the same MV to a dummy table with engine=Null and do manual inserts to debug the behavior. In a similar way (as the Materialized view often contains some pieces of the application’s business logic), you can create tests for your schema.
Warning
Always test MATERIALIZED VIEWs first on staging or testing environments
Possible test scenario:
create a copy of the original table CREATE TABLE src_copy ... AS src
create MV on that copy CREATE MATERIALIZED VIEW ... AS SELECT ... FROM src_copy
check if inserts to src_copy work properly, and mv is properly filled. INSERT INTO src_copy SELECT * FROM src LIMIT 100
cleanup the temp stuff and recreate MV on real table.
Q. Can I use subqueries / joins in MV?
It is possible but it is a very bad idea for most of the use cases**.**
So it will most probably work not as you expect and will hit insert performance significantly.
The MV will be attached (as AFTER INSERT TRIGGER) to the left-most table in the MV SELECT statement, and it will ‘see’ only freshly inserted rows there. It will ‘see’ the whole set of rows of other tables, and the query will be executed EVERY TIME you do the insert to the left-most table. That will impact the performance speed there significantly.
If you really need to update the MV with the left-most table, not impacting the performance so much you can consider using dictionary / engine=Join / engine=Set for right-hand table / subqueries (that way it will be always in memory, ready to use).
Q. How are MVs executed sequentially or in parallel?
By default, the execution is sequential and alphabetical. It can be switched by parallel_view_processing
.
Parallel processing could be helpful if you have a lot of spare CPU power (cores) and want to utilize it. Add the setting to the insert statement or to the user profile. New blocks created by MVs will also follow the squashing logic similar to the one used in the insert, but they will use the min_insert_block_size_rows_for_materialized_views and min_insert_block_size_bytes_for_materialized_views settings.
Q. How to alter MV implicit storage (w/o TO syntax)
take the existing MV definition
SHOWCREATETABLEdbname.mvname;
Adjust the query in the following manner:
replace ‘CREATE MATERIALIZED VIEW’ to ‘ATTACH MATERIALIZED VIEW’
add needed columns;
Detach materialized view with the command:
DETACHTABLEdbname.mvnameONCLUSTERcluster_name;
Add the needed column to the underlying ReplicatedAggregatingMergeTree table
-- if the Materialized view was created without TO keyword
ALTERTABLEdbname.`.inner.mvname`ONCLUSTERcluster_nameaddcolumntokensAggregateFunction(uniq,UInt64);-- othewise just alter the target table used in `CREATE MATERIALIZED VIEW ...` `TO ...` clause
attach MV back using the query you create at p. 1.
As you can see that operation is NOT atomic, so the safe way is to stop data ingestion during that procedure.
If you have version 19.16.13 or newer you can change the order of step 2 and 3 making the period when MV is detached and not working shorter (related issue https://github.com/ClickHouse/ClickHouse/issues/7878
).
7.21.1 - Idempotent inserts into a materialized view
How to make idempotent inserts into a materialized view".
Why inserts into materialized views are not idempotent?
ClickHouse® still does not have transactions. They were to be implemented around 2022Q2 but still not in the roadmap.
Because of ClickHouse materialized view is a trigger. And an insert into a table and an insert into a subordinate materialized view it’s two different inserts so they are not atomic altogether.
And insert into a materialized view may fail after the successful insert into the table. In case of any failure a client gets the error about failed insertion.
You may enable insert_deduplication (it’s enabled by default for Replicated engines) and repeat the insert with an idea to archive idempotate insertion,
and insertion will be skipped into the source table because of deduplication but it will be skipped for materialized view as well because
by default materialized view inherits deduplication from the source table.
It’s controlled by a parameter deduplicate_blocks_in_dependent_materialized_viewshttps://clickhouse.com/docs/en/operations/settings/settings/#settings-deduplicate-blocks-in-dependent-materialized-views
If your materialized view is wide enough and always has enough data for consistent deduplication then you can enable deduplicate_blocks_in_dependent_materialized_views.
Or you may add information for deduplication (some unique information / insert identifier).
Example 1. Inconsistency with deduplicate_blocks_in_dependent_materialized_views 0
createtabletest(AInt64,DDate)Engine=ReplicatedMergeTree('/clickhouse/{cluster}/tables/{table}','{replica}')partitionbytoYYYYMM(D)orderbyA;creatematerializedviewtest_mvEngine=ReplicatedSummingMergeTree('/clickhouse/{cluster}/tables/{table}','{replica}')partitionbyDorderbyDasselectD,count()CNTfromtestgroupbyD;setmax_partitions_per_insert_block=1;-- trick to fail insert into MV.
insertintotestselectnumber,today()+number%3fromnumbers(100);DB::Exception:Receivedfromlocalhost:9000.DB::Exception:Toomanypartitionsselectcount()fromtest;┌─count()─┐│100│-- Insert was successful into the test table
└─────────┘selectsum(CNT)fromtest_mv;0rowsinset.Elapsed:0.001sec.-- Insert was unsuccessful into the test_mv table (DB::Exception)
-- Let's try to retry insertion
setmax_partitions_per_insert_block=100;-- disable trick
insertintotestselectnumber,today()+number%3fromnumbers(100);-- insert retry / No error
selectcount()fromtest;┌─count()─┐│100│-- insert was deduplicated
└─────────┘selectsum(CNT)fromtest_mv;0rowsinset.Elapsed:0.001sec.-- Inconsistency! Unfortunatly insert into MV was deduplicated as well
Example 2. Inconsistency with deduplicate_blocks_in_dependent_materialized_views 1
createtabletest(AInt64,DDate)Engine=ReplicatedMergeTree('/clickhouse/{cluster}/tables/{table}','{replica}')partitionbytoYYYYMM(D)orderbyA;creatematerializedviewtest_mvEngine=ReplicatedSummingMergeTree('/clickhouse/{cluster}/tables/{table}','{replica}')partitionbyDorderbyDasselectD,count()CNTfromtestgroupbyD;setdeduplicate_blocks_in_dependent_materialized_views=1;insertintotestselectnumber,today()fromnumbers(100);-- insert 100 rows
insertintotestselectnumber,today()fromnumbers(100,100);-- insert another 100 rows
selectcount()fromtest;┌─count()─┐│200│-- 200 rows in the source test table
└─────────┘selectsum(CNT)fromtest_mv;┌─sum(CNT)─┐│100│-- Inconsistency! The second insert was falsely deduplicated because count() was = 100 both times
└──────────┘
Example 3. Solution: no inconsistency with deduplicate_blocks_in_dependent_materialized_views 1
Let’s add some artificial insert_id generated by the source of inserts:
create table test (A Int64, D Date, insert_id Int64)
Engine = ReplicatedMergeTree('/clickhouse/{cluster}/tables/{table}','{replica}')
partition by toYYYYMM(D) order by A;
create materialized view test_mv
Engine = ReplicatedSummingMergeTree('/clickhouse/{cluster}/tables/{table}','{replica}')
partition by D order by D as
select D, count() CNT, any(insert_id) insert_id from test group by D;
set deduplicate_blocks_in_dependent_materialized_views=1;
insert into test select number, today(), 333 from numbers(100);
insert into test select number, today(), 444 from numbers(100,100);
select count() from test;
┌─count()─┐
│ 200 │
└─────────┘
select sum(CNT) from test_mv;
┌─sum(CNT)─┐
│ 200 │ -- no inconsistency, the second (100) was not deduplicated because 333<>444
└──────────┘
set max_partitions_per_insert_block=1; -- trick to fail insert into MV.
insert into test select number, today()+number%3, 555 from numbers(100);
DB::Exception: Too many partitions for single INSERT block (more than 1)
select count() from test;
┌─count()─┐
│ 300 │ -- insert is successful into the test table
└─────────┘
select sum(CNT) from test_mv;
┌─sum(CNT)─┐
│ 200 │ -- insert was unsuccessful into the test_mv table
└──────────┘
set max_partitions_per_insert_block=100;
insert into test select number, today()+number%3, 555 from numbers(100); -- insert retry
select count() from test;
┌─count()─┐
│ 300 │ -- insert was deduplicated
└─────────┘
select sum(CNT) from test_mv;
┌─sum(CNT)─┐
│ 300 │ -- No inconsistency! Insert was not deduplicated.
└──────────┘
create materialized view test_mv
Engine = ReplicatedSummingMergeTree('/clickhouse/{cluster}/tables/{table}','{replica}')
partition by D
order by D
as
select
D,
count() CNT,
sum( cityHash(*) ) insert_id
from test group by D;
7.21.2 - Backfill/populate MV in a controlled manner
Backfill/populate MV in a controlled manner
Q. How to populate MV create with TO syntax? INSERT INTO mv SELECT * FROM huge_table? Will it work if the source table has billions of rows?
A. single huge insert ... select ... actually will work, but it will take A LOT of time, and during that time lot of bad things can happen (lack of disk space, hard restart etc). Because of that, it’s better to do such backfill in a more controlled manner and in smaller pieces.
One of the best options is to fill one partition at a time, and if it breaks you can drop the partition and refill it.
If you need to construct a single partition from several sources - then the following approach may be the best.
CREATETABLEmv_importASmv;INSERTINTOmv_importSELECT*FROMhuge_tableWHEREtoYYYYMM(ts)=202105;/* or other partition expression*//* that insert select may take a lot of time, if something bad will happen
during that - just truncate mv_import and restart the process *//* after successful loading of mv_import do*/ALTERTABLEmvATTACHPARTITIONID'202105'FROMmv_import;
Q. I still do not have enough RAM to GROUP BY the whole partition.
A. Push aggregating to the background during MERGES
There is a modified version of MergeTree Engine, called AggregatingMergeTree
. That engine has additional logic that is applied to rows with the same set of values in columns that are specified in the table’s ORDER BY expression. All such rows are aggregated to only one rows using the aggregating functions defined in the column definitions. There are two “special” column types, designed specifically for that purpose:
INSERT … SELECT operating over the very large partition will create data parts by 1M rows (min_insert_block_size_rows), those parts will be aggregated during the merge process the same way as GROUP BY do it, but the number of rows will be much less than the total rows in the partition and RAM usage too. Merge combined with GROUP BY will create a new part with a much less number of rows. That data part possibly will be merged again with other data, but the number of rows will be not too big.
CREATETABLEmv_import(idUInt64,tsSimpleAggregatingFunction(max,DateTime),-- most fresh
v1SimpleAggregatingFunction(sum,UInt64),-- just sum
v2SimpleAggregatingFunction(max,String),-- some not empty string
v3AggregatingFunction(argMax,String,ts)-- last value
)ENGINE=AggregatingMergeTree()ORDERBYid;INSERTINTOmv_importSELECTid,-- ORDER BY column
ts,v1,v2,-- state for SimpleAggregatingFunction the same as value
initializeAggregation('argMaxState',v3,ts)-- we need to convert from values to States for columns with AggregatingFunction type
FROMhuge_tableWHEREtoYYYYMM(ts)=202105;
Actually, the first GROUP BY run will happen just before 1M rows will be stored on disk as a data part. You may disable that behavior by switching off optimize_on_insert
setting if you have heavy calculations during aggregation.
You may attach such a table (with AggregatingFunction columns) to the main table as in the example above, but if you don’t like having States in the Materialized Table, data should be finalized and converted back to normal values. In that case, you have to move data by INSERT … SELECT again:
INSERTINTOMVSELECTid,ts,v1,v2,-- nothing special for SimpleAggregatingFunction columns
finalizeAggregation(v3)frommv_importFINAL
The last run of GROUP BY will happen during FINAL execution and AggregatingFunction types converted back to normal values. To simplify retries after failures an additional temporary table and the same trick with ATTACH could be applied.
8 - Using the Altinity Kubernetes Operator for ClickHouse®
Run ClickHouse® in Kubernetes without any issues.
Useful links
The Altinity Kubernetes Operator for ClickHouse® repo has very useful documentation:
In the current version of operator default user is limited to IP addresses of the cluster pods. We plan to have a password option for 0.20.0 and use a ‘secret’ authentication for distributed queries
Best way is to scale down the deployments to 0 replicas, after that reboot the node and scale up again:
first check that all your PVCs have the retain policy:
kubectl get pv -o=custom-columns=PV:.metadata.name,NAME:.spec.claimRef.name,POLICY:.spec.persistentVolumeReclaimPolicy
# Patch it if you needkubectl patch pv <pv_id> -p '{"spec":{"persistentVolumeReclaimPolicy":"Retain"}}'
After that just create a stop.yaml and kubectl apply -f stop.yaml
kind:ClickHouseInstallationspec:stop:yes
Reboot kubernetes node
Scale up deployment changing the stop property to no and do an kubectl apply -f stop.yml
kind:ClickHouseInstallationspec:stop:no
Check where pods are executing
kubectl get pod -o=custom-columns=NAME:.metadata.name,STATUS:.status.phase,NODE:.spec.nodeName -n zk
# Check which hosts in which AZskubectl get node -o=custom-columns=NODE:.metadata.name,ZONE:.metadata.labels.'failure-domain\.beta\.kubernetes\.io/zone'
kubectl get pvc -o=custom-columns=NAME:.metadata.name,SIZE:.spec.resources.requests.storage,CLASS:.spec.storageClassName,VOLUME:.spec.volumeName
...
NAME SIZE CLASS VOLUME
datadir-volume-zookeeper-0 25Gi gp2 pvc-9a3...9ee
kubectl get storageclass/gp2
...
NAME PROVISIONER RECLAIMPOLICY...
gp2 (default) ebs.csi.aws.com Delete
Operator does not delete volumes, so those were probably deleted by Kubernetes. In some new versions there is a feature flag that deletes PVCs attached to STS when STS is deleted.
Please try do the following: Use operator 0.20.3. Add the following to the defaults:
``
defaults:storageManagement:provisioner:Operator
That enables storage management by operator, instead of STS. It allows to extend volumes without re-creating STS, and us increase Volume size without restart of clickhouse statefulset pods for CSI drivers which support allowVolumeExpansion in storage classes because statefulset template don’t change and we don’t need delete/create statefulset
kubectl -n <namespace> get chi
NAME CLUSTERS HOSTS STATUS HOSTS-COMPLETED AGE
dnieto-test 14 Completed 211d
mbak-test 11 Completed 44d
rory-backupmar8 14 Completed 42h
kubectl -n <namespace> edit ClickHouseInstallation dnieto-test
Clickhouse-backup for CHOP
Examples for use clickhouse-backup + clickhouse-operator for EKS cluster which not managed by altinity.cloud
Main idea: second container in clickhouse pod + CronJob which will insert and poll system.backup_actions commands to execute clickhouse-backup commands
> kubectl create ns zoo3ns
> kubectl -n zoo3ns apply -f https://raw.githubusercontent.com/Altinity/clickhouse-operator/master/deploy/zookeeper/quick-start-persistent-volume/zookeeper-3-nodes-1GB-for-tests-only.yaml
# check names they should be like:# zookeeper.zoo3ns if using a new namespace# If using the same namespace zookeeper.<localnamespace># zookeeper must be accessed using the service like service_name.namespace
# dnieto-test-chop.yamlapiVersion:"clickhouse.altinity.com/v1"kind:"ClickHouseInstallation"metadata:name:"dnieto-dev"spec:configuration:settings:max_concurrent_queries:"200"merge_tree/ttl_only_drop_parts:"1"profiles:default/queue_max_wait_ms:"10000"readonly/readonly:"1"users:admin/networks/ip:- 0.0.0.0/0- '::/0'admin/password_sha256_hex:""admin/profile:defaultadmin/access_management:1zookeeper:nodes:- host:zookeeper.dnieto-test-chopport:2181clusters:- name:dnieto-devtemplates:podTemplate:pod-template-with-volumesserviceTemplate:chi-service-templatelayout:shardsCount:1# put the number of desired nodes 3 by defaultreplicasCount:2templates:podTemplates:- name:pod-template-with-volumesspec:containers:- name:clickhouseimage:clickhouse/clickhouse-server:22.3# separate data from logs volumeMounts:- name:data-storage-vc-templatemountPath:/var/lib/clickhouse- name:log-storage-vc-templatemountPath:/var/log/clickhouse-serverserviceTemplates:- name:chi-service-templategenerateName:"service-{chi}"# type ObjectMeta struct from k8s.io/meta/v1metadata:annotations:# https://kubernetes.io/docs/concepts/services-networking/service/#internal-load-balancer# this tags for elb load balancer#service.beta.kubernetes.io/aws-load-balancer-backend-protocol: tcp#service.beta.kubernetes.io/aws-load-balancer-cross-zone-load-balancing-enabled: "true"#https://kubernetes.io/docs/concepts/services-networking/service/#aws-nlb-supportservice.beta.kubernetes.io/aws-load-balancer-internal:"true"service.beta.kubernetes.io/aws-load-balancer-type:nlbspec:ports:- name:httpport:8123- name:clientport:9000type:LoadBalancervolumeClaimTemplates:- name:data-storage-vc-templatespec:# no storageClassName - means use default storageClassName# storageClassName: default# here if you have a storageClassName defined for gp2 you can use it.# kubectl get storageclassaccessModes:- ReadWriteOnceresources:requests:storage:50GireclaimPolicy:Retain- name:log-storage-vc-templatespec:accessModes:- ReadWriteOnceresources:requests:storage:2Gi
Install monitoring:
In order to setup prometheus as a backend for all the asynchronous_metric_log / metric_log tables and also set up grafana dashboards:
There’s a problem with stuck finalizers that can cause old CHI installations to hang. The sequence of operations looks like this.
You delete the existing ClickHouse operator using kubectl delete -f operator-installation.yaml with running CHI clusters.
You then drop the namespace where the CHI clusters are running, e.g., kubectl delete ns my-namespace
This hangs. You run kubectl get ns my-namespace -o yaml and you’ll see a message like the following: “message: ‘Some content in the namespace has finalizers remaining: finalizer.clickhouseinstallation.altinity.com
”
That means the CHI can’t delete because its finalizer was deleted out from under it.
The fix is to figure out the chi name which should still be visible and edit it to remove the finalizer reference.
The biggest problem with running ClickHouse® in K8s, happens when clickhouse-server can’t start for some reason and pod is falling in CrashloopBackOff, so you can’t easily get in the pod and check/fix/restart ClickHouse.
There is multiple possible reasons for this, some of them can be fixed without manual intervention in pod:
Wrong configuration files Fix: Check templates which are being used for config file generation and fix them.
While upgrade some backward incompatible changes prevents ClickHouse from start. Fix: Downgrade and check backward incompatible changes for all versions in between.
Next reasons would require to have manual intervention in pod/volume.
There is two ways, how you can get access to data:
Change entry point of ClickHouse pod to something else, so pod wouldn’t be terminated due ClickHouse error.
Attach ClickHouse data volume to some generic pod (like Ubuntu).
Unclear restart which produced broken files and/or state on disk is differs too much from state in zookeeper for replicated tables. Fix: Create force_restore_data flag.
Wrong file permission for ClickHouse files in pod. Fix: Use chown to set right ownership for files and directories.
Errors in ClickHouse table schema prevents ClickHouse from start. Fix: Rename problematic table.sql scripts to table.sql.bak
Occasional failure of distributed queries because of wrong user/password. Due nature of k8s with dynamic ip allocations, it’s possible that ClickHouse would cache wrong ip-> hostname combination and disallow connections because of mismatched hostname. Fix: run SYSTEM DROP DNS CACHE;<disable_internal_dns_cache>1</disable_internal_dns_cache> in config.xml.
Caveats:
Not all configuration/state folders are being covered by persistent volumes. (geobases
)
Page cache belongs to k8s node and pv are being mounted to pod, in case of fast shutdown there is possibility to loss some data(needs to be clarified)
Some cloud providers (GKE) can have slow unlink command, which is important for ClickHouse because it’s needed for parts management. (max_part_removal_threads setting)
Q. ClickHouse is caching the Kafka pod’s IP and trying to connect to the same ip even when there is a new Kafka pod running and the old one is deprecated. Is there some setting where we could refresh the connection
<disable_internal_dns_cache>1</disable_internal_dns_cache> in config.xml
Per documentation on Istio Project's website
, Istio is “an open source service mesh that layers transparently onto existing distributed applications. Istio’s powerful features provide a uniform and more efficient way to secure, connect, and monitor services. Istio is the path to load balancing, service-to-service authentication, and monitoring – with few or no service code changes.”
Istio works quite well at providing this functionality, and does so through controlling service-to-service communication in a Cluster, find-grained control of traffic behavior, routing rules, load-balancing, a policy layer and configuration API supporting access controls, rate limiting, etc.
It also provides metrics about all traffic in a cluster. One can get an amazing amount of metrics from it. Datadog even has a provider that when turned on is a bit like a firehose of information.
Istio essentially uses a proxy to intercapt all network traffic and provides the ability to configured for providing a appliction-aware features.
ClickHouse and Istio
The implications for ClickHouse need to be taken into consideration however, and this page will attempt to address this from real-life scenarios that Altinity devops, infrastructural, and support engineers have had to solve.
Operator High Level Description
The Altinity ClickHouse Operator, when installed using a deployment, also creates four custom resources:
For the first two, it uses StatefullSets to run both Keeper and and ClickHouse clusters. For Keeper, it manages how many replicas specified, and for ClickHouse, it manages both how many replicas and shards are specified.
In managing ClickHouseInstallations, it requires that the operator can interact with the database running on clusters it creates using a specific clickhouse_operator user and needs network access rules that allow connection to the ClickHouse pods.
Many of the issues with Istio can pertain to issues where this can be a problem, particularly in the case where the IP address of the Operator pod changes and no longer is allowed to connect to it’s ClickHouse clusters that it manages.
Issue: Authentication error of clickhouse-operator
This was a ClickHouse cluster running in a Kubernetes setup with Istio.
The clickhouse operator was unable to query the clickhouse pods because of authentication errors. After a period of time, the operator gave up yet the ClickHouse cluster (ClickHouseInstallation) worked normally.
Errors showed AUTHENTICATION_FAILED and connections from :ffff:127.0.0.6 are not allowed as well as IP_ADDRESS_NOT_ALLOWED
Also, the clickhouse_operator user correctly configured
There was a recent issue that on the surface looked similar to a recent issue with https://altinity.com/blog/deepseek-clickhouse-and-the-altinity-kubernetes-operator (disabled network access for default user due to issue with DeepSeek) and one idea seemed as if upgrading the operator (which would fix the issue if it were default user).
However, the key to this issue is that the problem was with the clickhouse_operator user, not default user, hence not due to the aforementioned issue.
More consiration was given in light of how Istio effects what services can connect which made it more obvious that it was an issue with using Istio in the operator vs. operator version
Frequent questions users have about clickhouse-client
9.1 - clickhouse-client
ClickHouse® client
Q. How can I input multi-line SQL code? can you guys give me an example?
A. Just run clickhouse-client with -m switch, and it starts executing only after you finish the line with a semicolon.
Q. How can i use pager with clickhouse-client
A. Here is an example: clickhouse-client --pager 'less -RS'
Q. Data is returned in chunks / several tables.
A. Data get streamed from the server in blocks, every block is formatted individually when the default PrettyCompact format is used. You can use PrettyCompactMonoBlock format instead, using one of the options:
start clickhouse-client with an extra flag: clickhouse-client --format=PrettyCompactMonoBlock
add FORMAT PrettyCompactMonoBlock at the end of your query.
If you upgrade the existing installation with a lot of legacy queries, please pick mature versions with extended lifetime for upgrade (use Altinity Stable Builds
or LTS releases from the upstream).
Review Release Notes/Changelog
Compare the release notes/changelog between your current release and the target release.
For Altinity Stable Builds: check the release notes of the release you do upgrade to (if you going from some older release - you may need to read several of them for every release in between (for example to upgrade from 22.3 to 23.8 you will need to check 22.8
,
23.3
,
23.8
etc.)
Also ensure that no configuration changes are needed.
Sometimes, you may need to adjust configuration settings for better compatibility.
or to opt-out some new features you don’t need (maybe needed to to make the downgrade path possible, or to make it possible for 2 versions to work together)
Prepare Upgrade Checklist
Upgrade the package (note that this does not trigger an automatic restart of the clickhouse-server).
Restart the clickhouse-server service.
Check health checks and logs.
Repeat the process on other nodes.
Prepare “Canary” Update Checklist
Mixing several versions in the same cluster can lead to different degradations. It is usually not recommended to have a significant delay between upgrading different nodes in the same cluster.
(If needed / depends on use case) stop ingestion into odd replicas / remove them for load-balancer etc.
Perform the upgrade on the odd replicas first. Once they are back online, repeat same on the even replicas.
Test and verify that everything works properly. Check for any errors in the log files.
Upgrade Dev/Staging Environment
Follow 3rd and 4th checklist and perform Upgrade the Dev/Staging environment.
Ensure your schema/queries work properly in the Dev/staging environment.
Perform testing before plan for production upgrade.
Also worth to test the downgrade (to have plan B on upgrade failure)
Upgrade Production
Once the Dev/Staging environment is verified, proceed with the production upgrade.
Note: Prepare and test downgrade procedures on staging so the server can be returned to the previous version if necessary.
In some upgrade scenarios (depending on which version you are upgrading from and to), when different replicas use different ClickHouse versions, you may encounter the following issues:
Replication doesn’t work at all, and delays grow.
Errors about ‘checksum mismatch’ occur, and traffic between replicas increases as they need to resync merge results.
Both problems will be resolved once all replicas are upgraded.
All releases starting from v21.10.2.15 have that problem fixed.
Also, the fix was backported to 21.3 and 21.8 branches - versions v21.8.11.4-lts and v21.3.19.1-lts
accordingly have the problem fixed (and all newer releases in those branches).
The latest Altinity stable releases also contain the bugfix.
If you use some older version we recommend upgrading.
Before the upgrade - please ensure that ports 9000 and 8123 are not exposed to the internet, so external
clients who can try to exploit those vulnerabilities can not access your clickhouse node.
Removing of empty parts is a new feature introduced in ClickHouse® 20.12.
Earlier versions leave empty parts (with 0 rows) if TTL removes all rows from a part (https://github.com/ClickHouse/ClickHouse/issues/5491
).
If you set up TTL for your data it is likely that there are quite many empty parts in your system.
The new version notices empty parts and tries to remove all of them immediately.
This is a one-time operation which runs right after an upgrade.
After that TTL will remove empty parts on its own.
What we can do to avoid this problem during an upgrade:
Drop empty partitions before upgrading to decrease the number of empty parts in the system.
SELECTconcat('alter table ',database,'.',table,' drop partition id ''',partition_id,''';')FROMsystem.partsWHEREactiveGROUPBYdatabase,table,partition_idHAVINGcount()=countIf(rows=0)
Upgrade/restart one replica (in a shard) at a time.
If only one replica is cleaning empty parts there will be no deadlock because of replicas waiting for one another.
Restart one replica, wait for replication queue to process, then restart the next one.
Removing of empty parts can be disabled by adding remove_empty_parts=0 to the default profile.
The problem is fixed in 21.8 and backported to 21.3.16, 21.6.9, 21.7.6.
Regarding the procedure to reproduce the issue:
The procedure was not confirmed, but I think it should work.
Wait for a merge on a particular partition (or run an OPTIMIZE to trigger one)
At this point you can collect the names of parts participating in the merge from the system.merges table, or the system.parts table.
When the merge finishes, stop one of the replicas before the inactive parts are dropped (or detach the table).
Bring the replica back up (or attach the table).
Check that there are no inactive parts in system.parts, but they stayed in ZooKeeper.
Also check that the inactive parts got removed from ZooKeeper for another replica.
Here is the query to check ZooKeeper:
select name, ctime from system.zookeeper
where path='<table_zpath>/replicas/<replica_name>/parts/'
and name like '<put an expression for the parts that were merged>'
Drop the partition on the replica that DOES NOT have those extra parts in ZooKeeper.
Check the list of parts in ZooKeeper.
We hope that after this the parts on disk will be removed on all replicas, but one of the replicas will still have some parts left in ZooKeeper.
If this happens, then we think that after a restart of the replica with extra parts in ZooKeeper it will try to download them from another replica.
A query to drop empty partitions with failing replication tasks
select'alter table '||database||'.'||table||' drop partition id '''||partition_id||''';'from(selectdatabase,table,splitByChar('_',new_part_name)[1]partition_idfromsystem.replication_queuewheretype='GET_PART'andnotis_currently_executingandcreate_time<toStartOfDay(yesterday())groupbydatabase,table,partition_id)qleftjoin(selectdatabase,table,partition_id,countIf(active)cnt_active,count()cnt_totalfromsystem.partsgroupbydatabase,table,partition_id)pusingdatabase,table,partition_idwherecnt_active=0
11 - Dictionaries
All you need to know about creating and using ClickHouse® dictionaries.
For more information on ClickHouse® Dictionaries, see
-- casted into CH Arrays
createtablearr_src(_keybigint(20)NOTNULL,_array_inttext,_array_strtext,PRIMARYKEY(_key));INSERTINTOarr_srcVALUES(42,'[0,42,84,126,168]','[''str0'',''str42'',''str84'',''str126'',''str168'']'),(66,'[0,66,132,198,264]','[''str0'',''str66'',''str132'',''str198'',''str264'']');
Dictionary in MySQL
-- supporting table to cast data
CREATETABLEarr_src(`_key`UInt8,`_array_int`String,`array_int`Array(Int32)ALIAScast(_array_int,'Array(Int32)'),`_array_str`String,`array_str`Array(String)ALIAScast(_array_str,'Array(String)'))ENGINE=MySQL('mysql_host','ch','arr_src','ch','pass');-- dictionary fetches data from the supporting table
CREATEDICTIONARYmysql_arr_dict(_keyUInt64,array_intArray(Int64)DEFAULT[1,2,3],array_strArray(String)DEFAULT['1','2','3'])PRIMARYKEY_keySOURCE(CLICKHOUSE(DATABASE'default'TABLE'arr_src'))LIFETIME(120)LAYOUT(HASHED());select*frommysql_arr_dict;┌─_key─┬─array_int──────────┬─array_str───────────────────────────────────┐│66│[0,66,132,198,264]│['str0','str66','str132','str198','str264']││42│[0,42,84,126,168]│['str0','str42','str84','str126','str168']│└──────┴────────────────────┴─────────────────────────────────────────────┘SELECTdictGet('mysql_arr_dict','array_int',toUInt64(42))ASres_int,dictGetOrDefault('mysql_arr_dict','array_str',toUInt64(424242),['none'])ASres_str┌─res_int───────────┬─res_str──┐│[0,42,84,126,168]│['none']│└───────────────────┴──────────┘SELECTdictGet('mysql_arr_dict','array_int',toUInt64(66))ASres_int,dictGetOrDefault('mysql_arr_dict','array_str',toUInt64(66),['none'])ASres_str┌─res_int────────────┬─res_str─────────────────────────────────────┐│[0,66,132,198,264]│['str0','str66','str132','str198','str264']│└────────────────────┴─────────────────────────────────────────────┘
11.2 - Dictionary on the top of several tables using VIEW
Dictionary on the top of several tables using VIEW
To optimize the performance of reporting queries, dimensional tables should be loaded into RAM as ClickHouse Dictionaries whenever feasible. It’s becoming increasingly common to allocate 100-200GB of RAM per server specifically for these Dictionaries. Implementing sharding by tenant can further reduce the size of these dimension tables, enabling a greater portion of them to be stored in RAM and thus enhancing query speed.
Different Dictionary Layouts can take more or less RAM (in trade for speed).
The cached dictionary layout is ideal for minimizing the amount of RAM required to store dimensional data when the hit ratio is high. This layout allows frequently accessed data to be kept in RAM while less frequently accessed data is stored on disk, thereby optimizing memory usage without sacrificing performance.
HASHED_ARRAY or SPARSE_HASHED dictionary layouts take less RAM than HASHED. See tests here
.
Normalization techniques can be used to lower RAM usage (see below)
If the amount of data is so high that it does not fit in the RAM even after suitable sharding, a disk-based table with an appropriate engine and its parameters can be used for accessing dimensional data in report queries.
MergeTree engines (including Replacing or Aggregating) are not tuned by default for point queries due to the high index granularity (8192) and the necessity of using FINAL (or GROUP BY) when accessing mutated data.
When using the MergeTree engine for Dimensions, the table’s index granularity should be lowered to 256. More RAM will be used for PK, but it’s a reasonable price for reading less data from the disk and making report queries faster, and that amount can be lowered by lightweight PK design (see below).
The EmbeddedRocksDB engine could be used as an alternative. It performs much better than ReplacingMergeTree for highly mutated data, as it is tuned by design for random point queries and high-frequency updates. However, EmbeddedRocksDB does not support Replication, so INSERTing data to such tables should be done over a Distributed table with internal_replication set to false, which is vulnerable to different desync problems. Some “sync” procedures should be designed, developed, and applied after serious data ingesting incidents (like ETL crashes).
When the Dimension table is built on several incoming event streams, AggregatingMergeTree is preferable to ReplacingMergeTree, as it allows putting data from different event streams without external ETL processes:
EmbeddedRocksDB natively supports UPDATEs without any complications with AggregatingFunctions.
For dimensions where some “start date” column is used in filtering, the Range_Hashed
dictionary layout can be used if it is acceptable for RAM usage. For MergeTree variants, ASOF JOIN in queries is needed. Such types of dimensions are the first candidates for placement into RAM.
EmbeddedRocksDB is not suitable here.
Primary Key
To increase query performance, I recommend using a single UInt64 (not String) column for PK, where the upper 32 bits are reserved for tenant_id (shop_id) and the lower 32 bits for actual object_id (like customer_id, product_id, etc.)
That benefits both EmbeddedRocksDB Engine (it can have only one Primary Key column) and ReplacingMergeTree, as FINAL processing will work much faster with a light ORDER BY column of a single UInt64 value.
Direct Dictionary and UDFs
To make the SQL code of report queries more readable and manageable, I recommend always using Dictionaries to access dimensions. A direct dictionary layout should be used for disk-stored dimensions (EmbeddedRocksDB or *MergeTree).
When Clickhouse builds a query to Direct Dictionary, it automatically creates a filter with a list of all needed ID values. There is no need to write code to filter necessary dimension rows to reduce the hash table for the right join table.
Another trick for code manageability is creating an interface function for every dimension to place here all the complexity of managing IDs by packing several values into a single PK value:
It also allows the flexibility of changing dictionary names when testing different types of Engines or can be used to spread dimensional data to several dictionaries. F.e. most active tenants can be served by expensive in-RAM dictionary, while others (not active) tenants will be served from disk.
We always recommended DENORMALIZATION for Fact tables. However, NORMALIZATION is still a usable approach for taking less RAM for Dimension data stored as dictionaries.
Example of storing a long company name (String) in a separate dictionary:
CREATETABLEDim_Customers(idUInt64,nameString,new_or_returningbool)ENGINE=ReplacingMergeTree()ORDERBYidPARTITIONBYintDiv(id,0x800000000000000)/* 32 buckets by shop_id */settingsindex_granularity=256;CREATEDICTIONARYdict_Customers(idUInt64,nameString,new_or_returningbool)PRIMARYKEYidLAYOUT(DIRECT())SOURCE(CLICKHOUSE(query'select * from Dim_Customers FINAL'));setdo_not_merge_across_partitions_select_final=1;-- or place it to profile
selectdictGet('dict_Customers','name',bitShiftLeft(3648061509::UInt64,32)+1);
Tests 1M random reads over 10M entries per shop_id in the Dimension table
There is no difference in SELECT on that synthetic test with all MergeTree optimizations applied. The test must be rerun on actual data with the expected update volume. The difference could be seen on a table with high-volume real-time updates.
As an example, in ClickHouse, run SHOW TABLE STATUS LIKE 'table_name' and try to figure out was table schema changed or not from MySQL response field Update_time.
By default, to properly data loading from MySQL8 source to dictionaries, please turn off the information_schema cache.
You can change default behavior with create /etc/mysql/conf.d/information_schema_cache.cnfwith following content:
[mysqld]information_schema_stats_expiry=0
Or setup it via SQL query:
SETGLOBALinformation_schema_stats_expiry=0;
11.6 - Partial updates
Partial updates
ClickHouse® is able to fetch from a source only updated rows. You need to define update_field section.
As an example, We have a table in an external source MySQL, PG, HTTP, … defined with the following code sample:
When you add new row and update some rows in this table you should update updated_at with the new timestamp.
-- fetch updated rows every 30 seconds
CREATEDICTIONARYcities_dict(polygonArray(Tuple(Float64,Float64)),cityString)PRIMARYKEYpolygonSOURCE(CLICKHOUSE(TABLEcitiesDB'default'update_field'updated_at'))LAYOUT(POLYGON())LIFETIME(MIN30MAX30)
A dictionary with update_fieldupdated_at will fetch only updated rows. A dictionary saves the current time (now) time of the last successful update and queries the source where updated_at >= previous_update - 1 (shift = 1 sec.).
In case of HTTP source ClickHouse will send get requests with update_field as an URL parameter &updated_at=2020-01-01%2000:01:01
11.7 - range_hashed example - open intervals
range_hashed example - open intervals
The following example shows a range_hashed example at open intervals.
As you can see SPARSE_HASHED is memory efficient and use about 3 times less memory (!!!) but is almost 3 times slower as well. On the other side HASHED_ARRAY is even more efficient in terms of memory usage and maintains almost the same performance as HASHED layout.
12 - Using This Knowledge Base
Add pages, make updates, and contribute to this ClickHouse® knowledge base.
The Altinity Knowledge Base is built on GitHub Pages, using Hugo and Docsy. This guide provides a brief description on how to make updates and add to this knowledge base.
Page and Section Basics
The knowledge base is structured in a simple directory format, with the content of the Knowledge Base stored under the directory content/en.
Each section is a directory, with the file _index.md that provides that sections information. For example, the Upgrade section has the following layout:
Each Markdown file provides the section’s information and the title that is displayed on the left navigation panel, with the file _index.md providing the top level information on the section.
Each page is set in the following format that sets the page attributes:
---title:"Using This Knowledge Base"linkTitle:"Using This Knowledge Base"description:> How to add pages, make updates, and expand this knowledge base.weight:11---The content of the page in Markdown format.
The attributes are as follows:
title: The title of the page displayed at the top of the page.
linkTitle: The title used in the left navigation panel.
description: A short description of the page listed under the title.
weight: The placement of the page in the hierarchy in the left navigation panel. The higher the weight, the higher in the display order it will be. For example, the file engines/_index.md has a weight of 1, pushing its display to the top of the list.
Create Pages and Sections
Create or Edit A Page
To create a new page or edit an existing one in the knowledge base:
From the page to start from:
To create a new page, select Create child page.
To edit an existing page, select Edit this page.
This will open the page’s location in the GitHub repository. Update the page using Markdown. See the Docsy Formatting Options section below for tips and details.
View how the page will look Preview. The GitHub Preview is not 100% the same as the page will be displayed on the knowledge base, but it is a close enough approximation.
Saving the file will depend on your role.
For those who have been granted Knowledgebase Contributor status, select Commit New File. The changes will be automatically applied to the GitHub repository, and the additions will be displayed to the knowledge base within 1-5 minutes.
For those who have not been granted Knowledgebase Contributor status, they will have to fork the changes and then create a new pull request through the following process:
When editing is complete, select Propose New File. This will being you to the GitHub Pull Request page.
Verify the new file is accurate, then select Create Pull Request.
Name the Pull Request, then select Create pull request.
First time contributors will be required to review and sign the Contributor License Agreement(CLA)
. To signify they agree with the CLA, the following comment must be left as part of the pull request:
I have read the CLA Document and I hereby sign the CLA
This signature will be stored as part of the GitHub repository indicating the GitHub username, the date of the agreement, and the pull request where the signer indicated their consent with the CLA.
The Pull Request will be reviewed and if approved, the changes will be applied to the Knowledge Base.
Create a New Section
To create a new section in the knowledge base, add a new directory under content/en from either the GitHub Repository
or through some other GitHub related method., and add the file index.md. The same submission process will be followed as outlined in Create or Edit A Page
.
Docsy Formatting Options
Docsy uses Markdown
, providing a simple method of formatting documents. Refer to the Markdown documentation for how to edit pages and achieve the display results.
The following guide recommendations should be followed:
Code should should be code segments, which uses three back tics to start and end a code section, with the type of code used. For example, if the code segment is regarding SQL then the section would start with ```sql` .
Display text should be in bold. For example, when requesting someone click Create New Page on a page, Create New Page is in bold.
Adding Images
New images and other static files are stored in the directory static, with the following categories:
Images are stored under static/assets.
Pdf files are stored under static/assets
12.1 - Mermaid Example
A short example of using the Mermaid library to add charts.
This Knowledge Base now supports Mermaid
, a handy way to create charts from text. The following example shows a very simple chart, and the code to use.
To add a Mermaid chart, encase the Mermaid code between {{< mermaid >}}, as follows: