This is the multi-page printable view of this section. Click here to print.
Operations and Troubleshooting
1 - Setting the background message broker schedule pool size
background_message_broker_schedule_pool_size setting for Kafka, RabbitMQ, and NATS table engines in your database.Overview
When using Kafka, RabbitMQ, or NATS table engines in ClickHouse®, you may encounter issues related to a saturated background thread pool. One common symptom is a warning similar to the following:
2025.03.14 08:44:26.725868 [ 344 ] {} <Warning> StorageKafka (events_kafka): [rdk:MAXPOLL] [thrd:main]: Application maximum poll interval (60000ms) exceeded by 159ms (adjust max.poll.interval.ms for long-running message processing): leaving group
This warning typically appears not because ClickHouse fails to poll, but because there are no available threads in the background pool to handle the polling in time. In rare cases, the same error might also be caused by long flushing operations to Materialized Views (MVs), especially if their logic is complex or chained.
To resolve this, you should monitor and, if needed, increase the value of the background_message_broker_schedule_pool_size setting.
Step 1: Check Thread Pool Utilization
Run the following SQL query to inspect the current status of your background message broker thread pool:
SELECT
    (
        SELECT value
        FROM system.metrics
        WHERE metric = 'BackgroundMessageBrokerSchedulePoolTask'
    ) AS tasks,
    (
        SELECT value
        FROM system.metrics
        WHERE metric = 'BackgroundMessageBrokerSchedulePoolSize'
    ) AS pool_size,
    pool_size - tasks AS free_threads
If you have metric_log enabled, you can also monitor the minimum number of free threads over the day:
SELECT min(CurrentMetric_BackgroundMessageBrokerSchedulePoolSize - CurrentMetric_BackgroundMessageBrokerSchedulePoolTask) AS min_free_threads
FROM system.metric_log
WHERE event_date = today()
If free_threads is close to zero or negative, it means your thread pool is saturated and should be increased.
Step 2: Estimate Required Pool Size
To estimate a reasonable value for background_message_broker_schedule_pool_size, run the following query:
WITH
    toUInt32OrDefault(extract(engine_full, 'kafka_num_consumers\s*=\s*(\d+)')) as kafka_num_consumers,
    extract(engine_full, 'kafka_thread_per_consumer\s*=\s*(\d+|\'true\')') not in ('', '0') as kafka_thread_per_consumer,
    multiIf(
        engine = 'Kafka',
            if(kafka_thread_per_consumer AND kafka_num_consumers > 0, kafka_num_consumers, 1),
        engine = 'RabbitMQ',
            3,
        engine = 'NATS',
            3,
        0 /* should not happen */
    ) as threads_needed
SELECT
    ceil(sum(threads_needed) * 1.25)
FROM
    system.tables
WHERE
    engine in ('Kafka', 'RabbitMQ', 'NATS')
This will return an estimate that includes a 25% buffer to accommodate spikes in load.
Step 3: Apply the New Setting
Create or update the following configuration file:
Path:
/etc/clickhouse-server/config.d/background_message_broker_schedule_pool_size.xmlContent:
<yandex>
    <background_message_broker_schedule_pool_size>120</background_message_broker_schedule_pool_size>
</yandex>
Replace
120with the value recommended from Step 2 (rounded up if needed).(Only for ClickHouse versions 23.8 and older)
Add the same setting to the default user profile:
Path:
/etc/clickhouse-server/users.d/background_message_broker_schedule_pool_size.xmlContent:
<yandex>
    <profiles>
        <default>
            <background_message_broker_schedule_pool_size>120</background_message_broker_schedule_pool_size>
        </default>
    </profiles>
</yandex>
Step 4: Restart ClickHouse
After applying the configuration, restart ClickHouse to apply the changes:
sudo systemctl restart clickhouse-server
Summary
A saturated background message broker thread pool can lead to missed Kafka polls and consumer group dropouts. Monitoring your metrics and adjusting background_message_broker_schedule_pool_size accordingly ensures stable operation of Kafka, RabbitMQ, and NATS integrations.
If the problem persists even after increasing the pool size, consider investigating slow MV chains or flushing logic as a potential bottleneck.
2 - Error handling
Pre 21.6
There are couple options:
Certain formats which has schema in built in them (like JSONEachRow) could silently skip any unexpected fields after enabling setting input_format_skip_unknown_fields
It’s also possible to skip up to N malformed messages for each block, with used setting kafka_skip_broken_messages but it’s also does not support all possible formats.
After 21.6
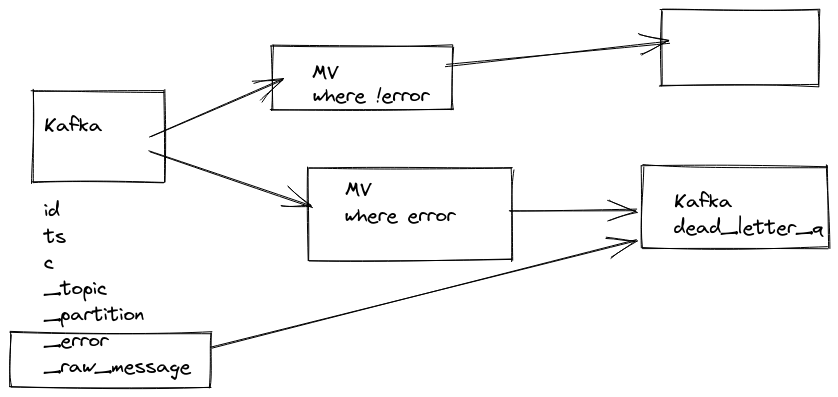
It’s possible to stream messages which could not be parsed, this behavior could be enabled via setting: kafka_handle_error_mode='stream' and ClickHouse® wil write error and message from Kafka itself to two new virtual columns: _error, _raw_message.
So you can create another Materialized View which would collect to a separate table all errors happening while parsing with all important information like offset and content of message.
CREATE TABLE default.kafka_engine
(
    `i` Int64,
    `s` String
)
ENGINE = Kafka
SETTINGS kafka_broker_list = 'kafka:9092'
kafka_topic_list = 'topic',
kafka_group_name = 'clickhouse',
kafka_format = 'JSONEachRow',
kafka_handle_error_mode='stream';

CREATE TABLE default.kafka_errors
(
    `topic` String,
    `partition` Int64,
    `offset` Int64,
    `raw` String,
    `error` String
)
ENGINE = MergeTree
ORDER BY (topic, partition, offset)
SETTINGS index_granularity = 8192


CREATE MATERIALIZED VIEW default.kafka_errors_mv TO default.kafka_errors
AS
SELECT
    _topic AS topic,
    _partition AS partition,
    _offset AS offset,
    _raw_message AS raw,
    _error AS error
FROM default.kafka_engine
WHERE length(_error) > 0
https://github.com/ClickHouse/ClickHouse/pull/20249
https://github.com/ClickHouse/ClickHouse/pull/21850
https://altinity.com/blog/clickhouse-kafka-engine-faq
Since 25.8
dead letter queue can be used via setting: kafka_handle_error_mode='dead_letter_queue' https://github.com/ClickHouse/ClickHouse/pull/68873
and error related data will be saved in system.dead_letter_queue table.